NAUKRI trade ideas

naukri buy after 4350 levelsell below 4150 level as per Fibonacci levels and buy if closes above 4350.

[Positional] Naukri Retracement Bet BuyNote -
One of the best forms of Price Action is to not try to predict at all. Instead of that, ACT on the price. So, this chart tells at "where" to act in "what direction. Unless it triggers, like, let's say the candle doesn't break the level which says "Buy if it breaks", You should not buy at all.
=======
I use shorthands for my trades.
"Positional" - means You can carry these positions and I do not see sharp volatility ahead. (I tally upcoming events and many small kinds of stuff to my own tiny capacity.)
"Intraday" -means You must close this position at any cost by the end of the day.
"Theta" , "Bounce" , "3BB" or "Entropy" - My own systems.
=======
I won't personally follow any rules. If I "think" (It is never gut feel. It is always some reason.) the trade is wrong, I may take reverse trade. I may carry forward an intraday position. What is meant here - You shouldn't follow me because I may miss updating. You should follow the system I share.
=======
Like -
Always follow a stop loss.
In the case of Intraday trades, it is mostly the "Day's High".
In the case of Positional trades, it is mostly the previous swings.
I do not use Stop Loss most of the time. But I manage my risk with options as I do most of the trades using derivatives.
=======


Info Edge Good to buy from hereLooking Good coming back to high again
Good to buy from here info Edge
Near by support

NAUKRINSE:NAUKRI
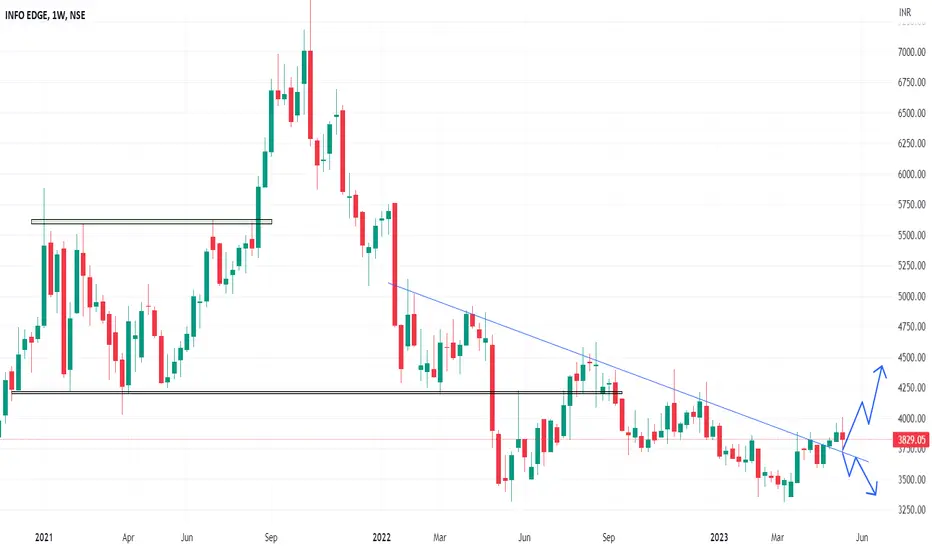
One Can Enter Now ! Or Wait for Retest of the Trendline (BO) Or wait For better R:R ratio
Note :
1.One Can Go long with a Strict SL below the Trendline or Swing Low of Daily Candle.
2. Close, should be good and Clean.
3. R:R ratio should be 1 :2 minimum
4. Plan as per your RISK appetite
Disclaimer : You are responsible for your Profits and loss, Shared for Educational purpose

NAUKRI Info Edge52WH Breakout and Out of range after 15 months.
Perfect double bottom pattern formation
Weekly Positional Long for 5050 and then 5700+ levels

Long target 4348Looking bullish in chart so go for long of
1st target 4348
2nd target 4650
with sl 4055
NSE:NAUKRI

NAUKRI BUY TRADE
Price is in Uptrend as its violating the Supplys and Respecting the Demands now there is a Fresh Weekly Supply @ 5482.00 and currently the Price is in a Weekly Demand, this Demand has a favourable Reward to Risk ratio hence a Buy Trade
ENJOY THE RIDE ! ! !

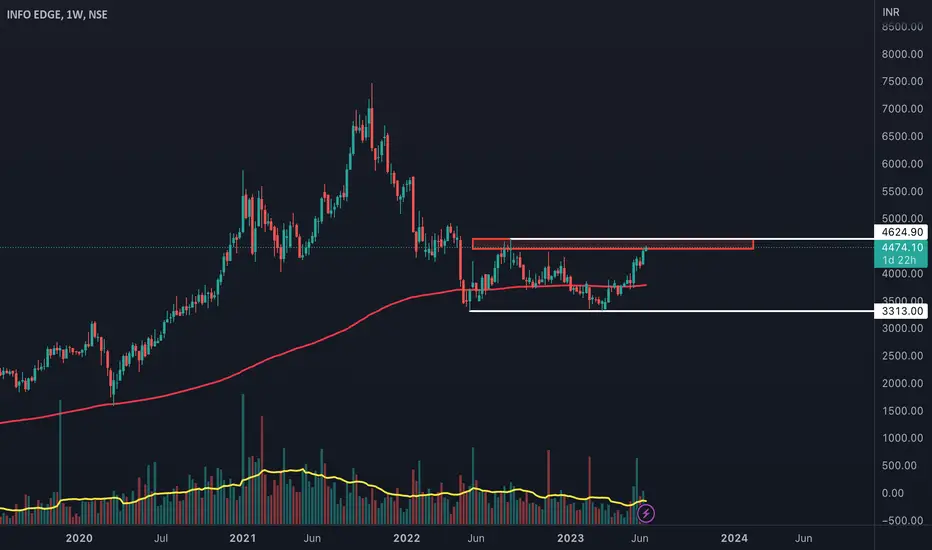
Beginning of a New UPTREND In NAUKRI.COM???The stock price of Naukri was trading in a weekly downtrend since October 21 and then started ranging between 4625 and 3300.
This consolidation could be the accumulation phase and if this consolidation gives a bullish breakout, a new UPTREND in Naukri will begin.
If weekly candle closes above 4625, NAUKRI can be a good pick for mid-term investment.
NAUKRI Ascending triangle chart pattern in 4 hour time fram take break out at resistance level with High volume and make retest at that level also make double bottom in weekly time fram that's bullish Sign , RSI and MACD saw fair value for bullish trend so first Target will be 4820.25 and Stop loss will be 4001.85
This is for educational purpose not a trading advice so that's my view comment down your view 🤗

Long view on Naukri We can see clear break out with high volume n consolidation for 2 weeks now it can probably go to all time high

NAUKRI/INFO EDGEA very good correction and rejection from major levels charts suggest a buy .. chart structure can change .double bottom + descending triangle ✨ a techincal pick not a fundamental.

Inverted Head & Shoulder PatternIn Naukri/Nifty Ratio chart made a inverse head & shoulder pattern after a deep correction , for now high probability #naukri outperform Nifty .

Naukri Descending Triangle breakout and double bottom in makingNaukri Broke out of a Descending triangle pattern with good volumes, there is also a double bottom pattern currently forming with neckline at 4635. Potential Targets are 5610 and 6020.


NAUKRI - Weekly AnalysisIn the Weekly Chart of NAUKRI ,
we can see that, it has given breakout but it is not strong.
Also it has made a Big Decision making Halt candle.
Lets see which side does it take a Mometum.

#NAUKARI... Looking good @15.05.23#NAUKARI... ✅▶️
Intraday as well as swing trade
All levels given in charts ...
IF good potential seen then we work in options also
if activate then possible a huge movement Keep eye on this ...
We take trade only when it activates...
Possible to give good target
TRADING FACTS

Bullish pattern in info edgeThere is inverse head and shoulder pattern break out on daily basis chart. Trader can hold it for short term period.

{INFO EDGE(NAUKRI) } : (TAKING A LAST DIP)
Price is in a Fresh Weekly Supply which has violated the opposite Weekly Demand which signifies more sell orders in the Current Weekly Supply
Reward to Risk ratio is 3:1, Hence short position.

Skeptical on her StrengthThe holdings of Zomato will yield more pain...
However, revenue from operations looks consistent. The exceptional items of the balance sheet hurt investor sentiments. As the rising liabilities in last four quarters and astounding expenses on Ads and employees is affecting the operating margin

Naukri (Info Edge) Long TradeThis is a future probable trade. Entry, Target and Stoploss are mentioned in the chart. Keep an eye on reversal in the range.
Reversal Zone - 3390 - 3460
Trade - Buy
SL - 3310
Target - 3610,3720,3820
