NAVINFLUOR on the Verge of BreakoutNAVINFLUOR is on the Breakout level, but there is a negative RSI divergence in both DTF and WTF. Hence expecting it to Breakdown, unless heavy buying comes in and shoot RSI in overbought zone.
Stock is NC, but shared for learning purpose
NAVINFLUOR trade ideas

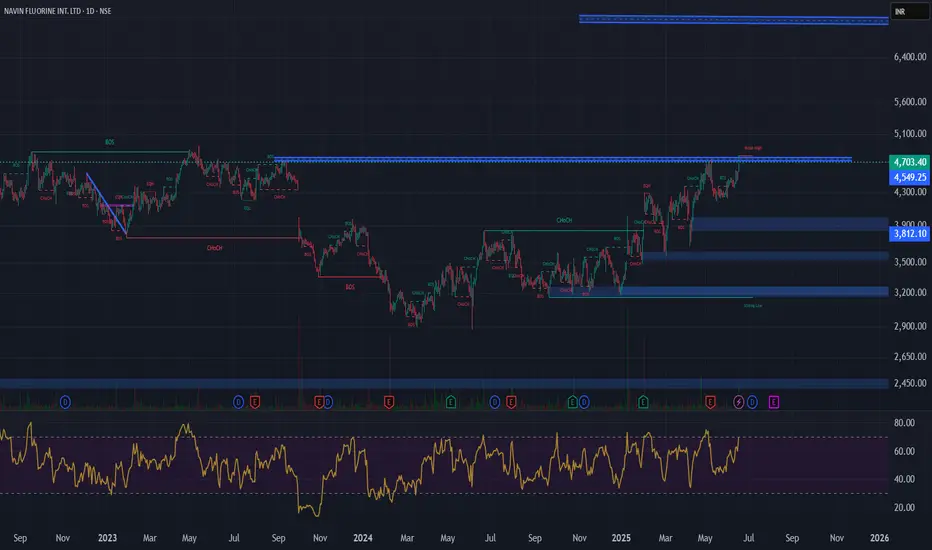
Cup & Handle Breakout - NAVINFLOURCurrent Price: ₹4,703
Technical Analysis:
Cup & Handle Breakout Pattern: The provided chart for NAVIN FLUORINE INT. LTD. shows a pattern that resembles a Cup & Handle. The current price action indicates it is at or near a potential breakout level.
Waiting for Confirmation: Your statement "Waiting for confirmation" is crucial. A confirmed breakout typically involves the price sustaining above the resistance level with strong trading volume.
Immediate Target: ₹7,000
Time Frame: 6 months to 1 year.
Fundamental Analysis:
Sales (Revenue from Operations): Consistently growing over the years, from ₹486 Cr in Mar 2014 to ₹2,349 Cr in Mar 2025.
Operating Profit: Shows a strong upward trend, from ₹66 Cr in Mar 2014 to ₹534 Cr in Mar 2025.
Net Profit: Also shows consistent growth, from ₹68 Cr in Mar 2014 to ₹289 Cr in Mar 2025.
EPS in Rs.: Increased from ₹13.47 in Mar 2014 to ₹58.19 in Mar 2025. This indicates healthy year-on-year growth in earnings.
Compounded Sales Growth: Healthy growth with 14% (TTM), 17% (3 Years), 17% (5 Years), and 15% (10 Years).
Compounded Profit Growth: Very strong growth with 25% (TTM), -7% (3 Years), and 20% (10 Years). The negative 3-year profit growth needs to be investigated, as the net profit has consistently increased in the past 3 years (258 Cr in Mar 2022, 375 Cr in Mar 2023, 270 Cr in Mar 2024, 289 Cr in Mar 2025). This might be due to a specific high base year or non-recurring items impacting the compounded calculation for that period.
Return on Equity (ROE): Strong and consistent, with 12% (Last Year), 13% (3 Years), 14% (5 Years), and 16% (10 Years).
Dividend Payout %: Consistent dividend payouts, with 21% in Mar 2025.
Stock P/E: While not provided in the specific image for Navin Fluorine's fundamental ratios, based on the current price of ₹4703 and FY25 EPS of ₹58.19, the trailing P/E would be approximately 80.82. This is a very high P/E ratio, indicating significant growth expectations are priced into the stock.
Corporate Actions & Latest News:
Dividends: The company has a consistent history of paying dividends.
Capacity Expansion/R&D: As a specialty chemicals and fluorochemicals company, corporate actions and news for Navin Fluorine often revolve around:
New project announcements or capacity expansions to meet growing demand.
R&D initiatives for new products or applications.
Strategic partnerships or collaborations.
Client wins in niche chemical segments.
Q4 FY25 Results: The latest news would include the Q4 FY25 financial results, which show a Net Profit of ₹289 Cr.
Company Order Book:
For a specialty chemicals company like Navin Fluorine, the "order book" typically includes long-term contracts with key clients and new project wins. A growing sales trend suggests a healthy order pipeline.
Overall Assessment:
Navin Fluorine International Ltd. presents a fundamentally strong picture with consistent growth in sales and net profit, along with robust profitability ratios like ROE. This strong fundamental performance supports the company's premium valuation.
The Cup & Handle breakout pattern is a bullish technical indicator. If confirmed with strong volume, it could potentially lead to the stock moving towards higher levels.
Key Considerations:
High Valuation: The calculated P/E of approximately 80.82 is very high. This means the market is already pricing in substantial future growth. The company needs to continue delivering exceptional results to justify and sustain this valuation.
Confirmation of Breakout: It's crucial to wait for proper confirmation of the Cup & Handle breakout with strong volume to validate the technical signal.
Profit Growth Anomaly: Investigate the negative "Compounded Profit Growth" for 3 years, despite the increasing net profit trend shown in the table. This might be a calculation anomaly or specific high-base effect.
Given the strong underlying business, consistent growth in key financial metrics, and the bullish technical pattern, the immediate target of ₹7,000, while ambitious, could be plausible within the 6-month to 1-year timeframe, provided the technical breakout is confirmed and the company continues its strong fundamental performance.
Disclaimer: This analysis is for informational purposes only and does not constitute investment advice. Investing in stocks, especially those with high valuations, carries inherent risks. Always conduct your own thorough research, carefully analyze the stock chart, assess your risk tolerance, and consult with a qualified financial advisor before making any investment decisions. The stock market carries inherent risks.
Investment IDEABase formation happened in Navin Fluorine and breakout with good volume was just a few weeks ago, buying around 3900 for first target of 5000RS and towards 10k in next 3 years or before.

[Swing Trade] NAVINFLUOR CMP - 3630.95Analysis:
Pattern Formation:
The chart shows a symmetrical triangle pattern, formed by a series of lower highs and higher lows. There is a price consolidation and a battle between buyers and sellers I assume, there may be a potential breakout / breakdown.. but if price is above all the MAs and spike in volume, I believe it will definitely give us 30%..
Breakout Zone:
The upper blue trendline (~₹3,750) represents the resistance zone. A breakout above this level signals bullish momentum, and if there is a spike in volume and some sustainability, it can breakout
Smile
Keep an eye on MAs, Volume and breakout of the blue line
Do your own research before you trade this stock. This is purely for education purpose.

NAVINFLUOR | Wait for Friday closing...Disclaimer:
This is not financial advice. Please do your own research or consult with a financial advisor before making any investment decisions. Investments in stocks can be risky and may result in loss of capital.

POV: NAVINFLUOR - Learning for Swing TradersPOV: NAVINFLUOR - Learning for Swing Traders
Chart Reading:
I marked five potential entry areas on the chart where most swing traders typically take positions. However, there are no clear signs of targets, which makes such stocks more suitable for short-term or intraday trading.
As a swing trader, I firmly believe that not all stocks are meant for swing trading. We need to selectively focus on those that align with our strategies.
For educational purposes only. This is not financial advice. Please consult a professional before making financial decisions.
#NiVYAMi


NAVINFLUOR | Time to Chemical StocksTime to Chemical Stocks !!!
Disclaimer:
This is not financial advice. Please do your own research or consult with a financial advisor before making any investment decisions. Investments in stocks can be risky and may result in loss of capital.

Lapu Star 500 Pc
Trend lines are diagonal lines drawn either above or below the price, serving as valuable indicators of the current trend direction and signaling shifts in trends. Additionally, they function as support and resistance levels, offering opportunities for entering and exiting positions.
Trading with trend lines can be approached in two primary ways:

Navin Fluorine short term analysis Navin Fluorine is looking really good right now. If it breaks through and stays above 3657, it could go up to 4100 in the short term. But for the downside, the important support zone is between 3433 and 3361. It’s best to avoid that area and wait for either a further drop to 3272-3173 or for it to cross 3657 again.

NAVIN FLURO - LONGNSE:NAVINFLUOR Weekly chart price at bottom fishing location with buyers. Also probably form positive head shoulder.

navinfluorin break from a consolidation zone after a downfallafter a downfall and consildation , ready for upmove.buy at 3420, target 3660, 3880
sl -3300

Potential Bearish Reversal in Navin Fluorine Intl. LtdThis weekly chart of Navin Fluorine Intl. Ltd. indicates a possible bearish reversal from the Fibonacci retracement levels. The stock is currently trading around ₹3,298.00, facing resistance at key Fibonacci levels.
Entry: ₹3,298.00
Stop Loss: ₹3,370.85
Target: ₹3,150.15
The setup shows a potential move lower, with key resistance levels aligning with Fibonacci retracements of 0.5 at ₹3,368.65 and 0.618 at ₹3,251.25. A break below these levels could signal a further decline toward the target area near ₹3,150.15.
Key Levels:
Resistance at 0.5 Fibonacci Level: ₹3,368.65
Support at 0.618 Fibonacci Level: ₹3,251.25
Target: ₹3,150.15
Stop Loss: ₹3,370.85
Analysis: The volume pattern suggests weakening momentum on the upside, and a potential break below the 0.618 Fibonacci level may lead to a further bearish move. Traders should monitor the price action around these critical levels and adjust their strategy accordingly

NAVINFLUORNSE:NAVINFLUOR
Forming C&H formation
CAN BUY AT cmp or around 3200
Sl- 3020 on CLBS
Target 4800+++
Holding for one year
Pivot S2 is 3286 act as strong support
RsI Is below 40
It is in oversold zone so trade carefully
My all idea is just an education purpose not recommendation.

NAVINFLUORINE reversal trade? 🧐NSE:NAVINFLUOR confirmed a reversal in price action yesterday. Target and SL are marked on the charts. Trade responsibly.
Remember, nothing is guaranteed and nothing overnight in stock markets.
P.S. 200 EMA should be a short target for low-risk takers.
All the best!

NavinFlourine - Reversal candidate?⚠️Disclaimer: We are not registered advisors. The views expressed here are merely personal opinions. Irrespective of the language used, Nothing mentioned here should be considered as advice or recommendation. Please consult with your financial advisors before making any investment decisions. Like everybody else, we too can be wrong at times ✌🏻

Short candidate, 10 to 25% plus downside possibleNavin is weak and mostly in Wave A correction.
Once the stock close below 3080, it has potential to touch 2770 and 2240 in next few months (mid april'24).
once trade is active, keep stoploss of 3230

REverse H n S?Price breaking out of Reverse Head and Shpulder
Strictly for educatio purpose
CMD 3250
target 3600, 3800
SL 3060
MACD showing buy signal

NAVIN FLUORINE + PTT + SMC + EILLOT WAVES + GANN SQ 9The chart shows recent implusive decline in 5 wave as seen in the chart.
The price is trading above Progressive Trend Tracker created by KivancOzbilgic, that indicates strength to the bulls.
The GANN square of 9 provides important resistance and support levels as observed in the chart.

NAVINFLUOR WEEKLY CHARTNAVINFLUOR WEEKLY CHART
Ellipse breakdown @ 3430 MOB @ 2600-2500
This stock has witnessed an ellipse breakdown @ 3430 levels, MOB projected @ 2600-2500 levels.
Its only my observation & not any suggestion or recommendation.

Navin florine ready for down , Best upcoming investment stock .Hello Frds
Navin Florine ready for down as per Elliot wave.
Retailers only entered
Big money will enter hence it will create Double bottom
keep an eye 3300 -3200 Levels for buying . Big money always buy at cheaper than retailers .
Best investment for 1 year. Target 4500-4600
Note: this is for Education purpose only.

“Navin fluorine” near term possible movement It’s my personal analysis, I could be wrong. Kindly don’t take it as advice. It’s purely done for knowledge sharing purpose and nothing else.

My view on NavinfuorTrendline breakout possible in navinfluor
Above 4650
Tgt 4740-4800-4900
Keeping on radar NAVINFLUOR 4700 CE (next contract)
