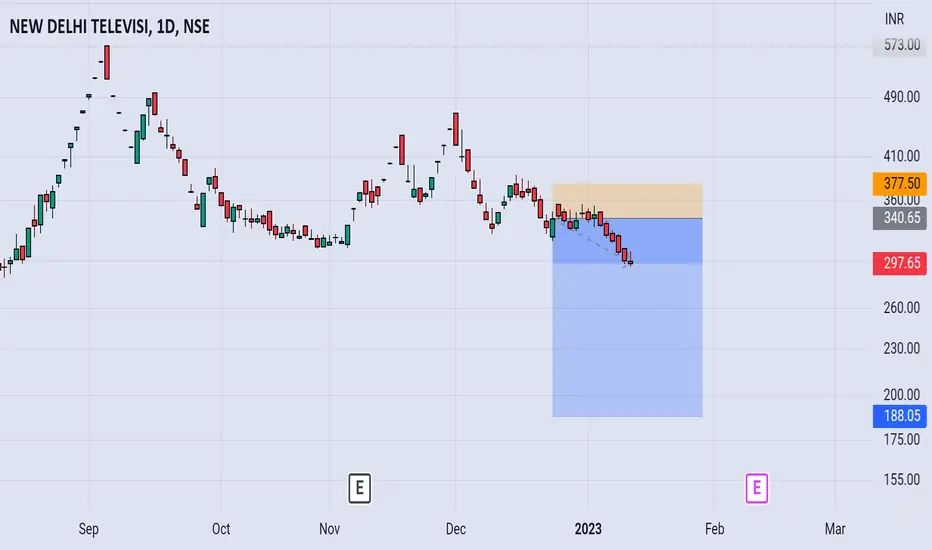
NDTV # Chance to Grap 30%NDTV is Showing potential reversal from current levels till 30% upside. Risky Trade considering the fundamentals .
−37.18 INR
−2.16 B INR
4.65 B INR
19.53 M
About NDTV LTD
Sector
Industry
CEO
Rahul Kanwal
Website
Headquarters
New Delhi
Founded
1984
ISIN
INE155G01029
FIGI
BBG000FBTZQ1
New Delhi Television Ltd. engages in the provision of telecommunication, broadcasting, and information supply services. The company was founded by Prannoy Roy and Radhika Roy in 1984 and is headquartered in New Delhi, India.
Related stocks

SWING IDEA - NDTVThe Stock seems to be following the Trendline and successfully forming Higher High and Higher Low Pattern.
Convergence Divergence is also in play currently.
MACD Crossover has also happened exactly at Trendline retouch indicating a move upward.
Election results has helped the stock to rally as well

New Delhi Television LtdTARGET IN CHART
SL - 200
FUNDAMENTALS
Market Cap
₹ 1,727 Cr.
Current Price
₹ 268
High / Low
₹ 359 / 167
Stock P/E
Book Value
₹ 42.9
Dividend Yield
0.00 %
ROCE
18.6 %
ROE
15.7 %
Face Value
₹ 4.00
Promoter holding
69.7 %
EPS last year
₹ 7.56
EPS latest quarter
₹ 0.92
Debt
₹ 6.23 Cr.

ndtv indiasecured its board's approval to restart the regular operations of its channel, NDTV Profit, on Dec. 8, according to a Tuesday filing.
The company halted the operations of the channel in June 2017.

NDTV - Ichimoku BreakoutStock Name - New Delhi Television Limited
Ichimoku Cloud Setup :
1). Today's close is above the Conversion Line
2). Future Kumo is Turning Bullish
3). Chikou span is slanting upwards
All these parameters are showing bullishness at Current Market Price
and more bullishness AFTER crossing 268
#

NDYV likely ready for a break to 225-35-55Anticipating an extended bullish flag with on going consolidation. Supported with continuous drise in delivery rate. This may give 10-15% returns in a 2 month time frame.
Being a adani group company it has high beta and may show high volatility. It not a recommendation to buy it's a narrative repres

NDTV - DAILY TIME FRAMEThe Structure looks good to us, waiting for this instrument to correct and then give us these opportunities as shown on this instrument (Price Chart).
Note: Its my view only and its for educational purpose only. Only who has got knowledge about this strategy, will understand what to be done on this

NDTV Looks in Wave 4...upside looks promising Please go through the chart of NDTV where in we can see the structure that is looking like an impulse. In minor wave it is in 4th wave 5th wave may go up to 273.
Note it.
This is not a trade reco.
Regards.

NDTV perfect move so farIn my previous idea i showed the NDTV is good to short.. now trade is going very well
Time to short NDTVNDTV looks Very bearish in higher 1D timeframe.
4H is also very bearish. short and wait..
Recommended 💪

See all ideas
Summarizing what the indicators are suggesting.
Oscillators
Neutral
SellBuy
Strong sellStrong buy
Strong sellSellNeutralBuyStrong buy
Oscillators
Neutral
SellBuy
Strong sellStrong buy
Strong sellSellNeutralBuyStrong buy
Summary
Neutral
SellBuy
Strong sellStrong buy
Strong sellSellNeutralBuyStrong buy
Summary
Neutral
SellBuy
Strong sellStrong buy
Strong sellSellNeutralBuyStrong buy
Summary
Neutral
SellBuy
Strong sellStrong buy
Strong sellSellNeutralBuyStrong buy
Moving Averages
Neutral
SellBuy
Strong sellStrong buy
Strong sellSellNeutralBuyStrong buy
Moving Averages
Neutral
SellBuy
Strong sellStrong buy
Strong sellSellNeutralBuyStrong buy
Displays a symbol's price movements over previous years to identify recurring trends.
Frequently Asked Questions
The current price of NDTV is 140.49 INR — it has decreased by −3.01% in the past 24 hours. Watch NDTV LTD stock price performance more closely on the chart.
Depending on the exchange, the stock ticker may vary. For instance, on NSE exchange NDTV LTD stocks are traded under the ticker NDTV.
NDTV stock has fallen by −6.20% compared to the previous week, the month change is a −7.96% fall, over the last year NDTV LTD has showed a −35.39% decrease.
NDTV reached its all-time high on Sep 6, 2022 with the price of 573.00 INR, and its all-time low was 19.10 INR and was reached on Mar 20, 2020. View more price dynamics on NDTV chart.
See other stocks reaching their highest and lowest prices.
See other stocks reaching their highest and lowest prices.
NDTV stock is 4.79% volatile and has beta coefficient of 1.14. Track NDTV LTD stock price on the chart and check out the list of the most volatile stocks — is NDTV LTD there?
Today NDTV LTD has the market capitalization of 9.37 B, it has increased by 1.20% over the last week.
Yes, you can track NDTV LTD financials in yearly and quarterly reports right on TradingView.
NDTV net income for the last quarter is −703.80 M INR, while the quarter before that showed −608.80 M INR of net income which accounts for −15.60% change. Track more NDTV LTD financial stats to get the full picture.
No, NDTV doesn't pay any dividends to its shareholders. But don't worry, we've prepared a list of high-dividend stocks for you.
As of Jul 29, 2025, the company has 796 employees. See our rating of the largest employees — is NDTV LTD on this list?
EBITDA measures a company's operating performance, its growth signifies an improvement in the efficiency of a company. NDTV LTD EBITDA is −1.91 B INR, and current EBITDA margin is −37.10%. See more stats in NDTV LTD financial statements.
Like other stocks, NDTV shares are traded on stock exchanges, e.g. Nasdaq, Nyse, Euronext, and the easiest way to buy them is through an online stock broker. To do this, you need to open an account and follow a broker's procedures, then start trading. You can trade NDTV LTD stock right from TradingView charts — choose your broker and connect to your account.
Investing in stocks requires a comprehensive research: you should carefully study all the available data, e.g. company's financials, related news, and its technical analysis. So NDTV LTD technincal analysis shows the sell today, and its 1 week rating is sell. Since market conditions are prone to changes, it's worth looking a bit further into the future — according to the 1 month rating NDTV LTD stock shows the sell signal. See more of NDTV LTD technicals for a more comprehensive analysis.
If you're still not sure, try looking for inspiration in our curated watchlists.
If you're still not sure, try looking for inspiration in our curated watchlists.