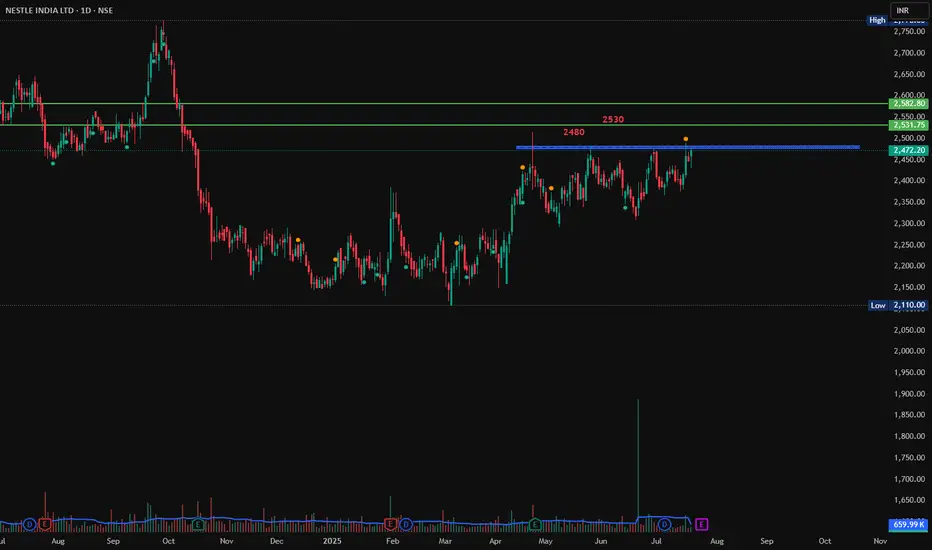
Nestle India, Breakout, 1D, LongNestle India tried to break the resistance at 2480 but failed multiple times. If it breaks this level of 2480 with Bullish candlestick patterns like Bullish Engulfing, Hammer & Inverted Hammer, Piercing Line, Morning Star, Three White Soldiers, Tweezer Bottoms or Bullish Harami, then a trade can be
Next report date
—
Report period
—
EPS estimate
—
Revenue estimate
—
32.25 INR
32.08 B INR
201.30 B INR
357.57 M
About NESTLE INDIA LTD
Sector
Industry
CEO
Suresh Narayanan
Website
Headquarters
Gurgaon
Founded
1912
ISIN
INE239A01024
FIGI
BBG000CX27Y8
Nestlé India Ltd. engages in the manufacture and sale of food products. The firm offers beverages; breakfast cereals; chocolates and confectionery; dairy; nutrition; foods; vending and food services; imports; exports; and Nestle ad campaigns brands. It operates through the India and Outside India geographical segments. The company was founded in 1912 and is headquartered in Gurgaon, India.
Related stocks
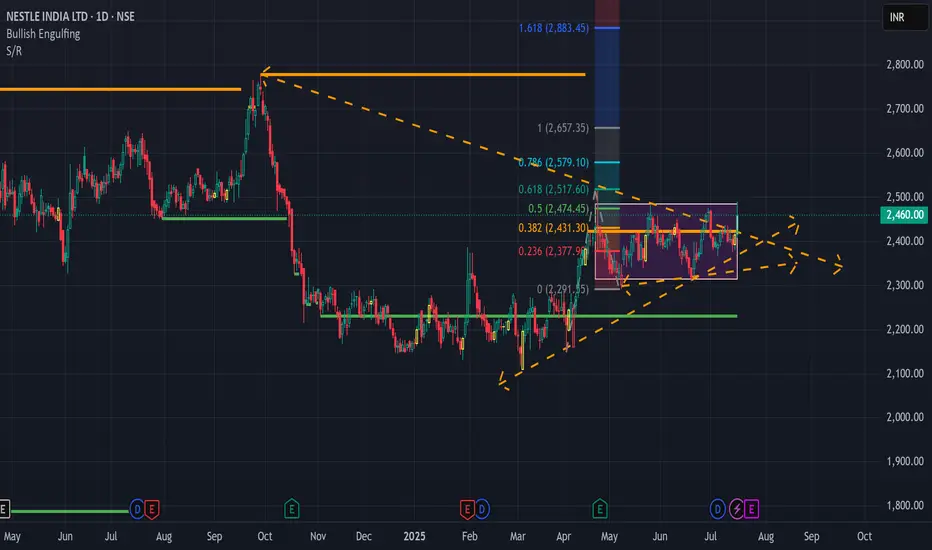
Nestle India in BreakoutNSE:NESTLEIND shows a breakout of a bullish ascending traingle trend. You can enter at 2460 and Target for 2640.
Nestle indiaconsolidation on WTF. with tight range also supported by20 & 200 MA. very low risk entry available on this trade see the analysis.
swing trade for 2 months atleast
entry on current price near 4400
SL 3800
Target 6000

#Nestle - Pivot Point is 2423.50 Date: 06-06-2025
#Nestle Current Price: 2415
Pivot Point: 2423.50 Support: 2378.05 Resistance: 2469.29
Upside Targets:
Target 1: 2513.39
Target 2: 2557.50
Target 3: 2607.75
Target 4: 2658.00
Downside Targets:
Target 1: 2333.78
Target 2:

NESTLE INDIA SWING TRADE SETUP📊 Price Action & Trend Analysis
Analyzing market trends using price action, key support/resistance levels, and candlestick patterns to identify high-probability trade setups.
Always follow the trend and manage risk wisely!
Price Action Analysis Interprets Market Movements Using Patterns And Trend

Nestle for short term is in upmove soon will reach 2489NESTLE Is showing strong momentum and hope soon it will touch 2489, lets see

NESTLE INDIA If the price bounces from this support, the next resistance level could be around 2,450–2,500.
If the price breaks this support, it would be a bearish breakdown, and the price could fall to 2,250 or even lower.
If you find this helpful and want more FREE forecasts in TradingView, Hit the 'BOOST' b

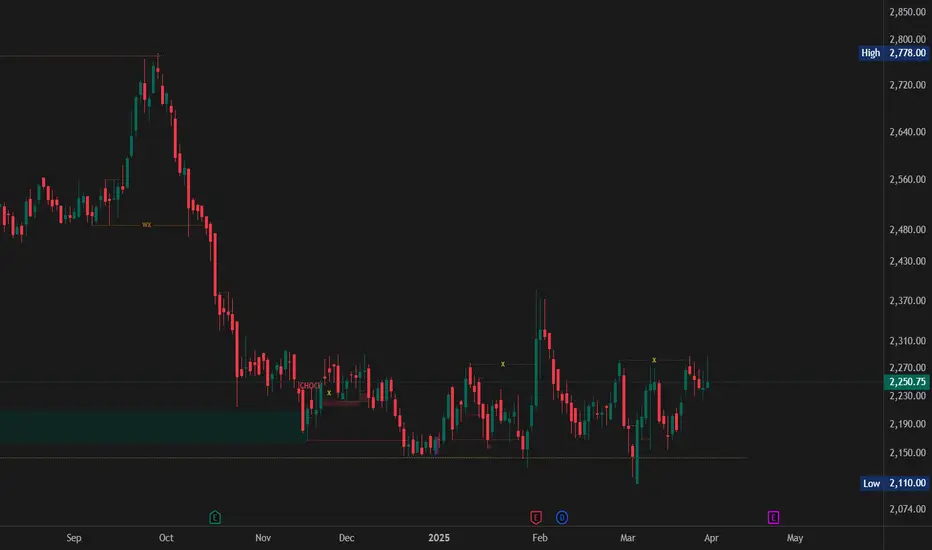
NESTLEIND - Range Bound -Box BreakOut -DailyThis is a technical analysis chart of **Nestle India Ltd. (NSE: NESTLEIND)** on a **daily timeframe**, and here's a breakdown of what it's showing:
---
### 📊 **Price Action and Pattern**
- **Range Bound (Accumulation)**: From around **November 2024 to mid-April 2025**, the price was consolidating

Nestle Crossing 200 EMASince FMCG Sector are defensive sector and moves aggresivly when market falls.
Nestle after a long consolidation near the support area broke out the 200 EMA and now ready to move for a uptrend.
Note: May not expected super rally if market moves rapidly because during bull markets, FMCG might underpe

Nestlé India – Strong Buy Opportunity After 25% Correction! 🔎 Market Overview & Technical Structure
Nestlé India has undergone a significant 25% correction from its all-time high, presenting a strategic investment opportunity. The stock has recently swiped a key monthly swing low and is now showing signs of potential upside movement.
📉 Stock Correction from
See all ideas
Summarizing what the indicators are suggesting.
Neutral
SellBuy
Strong sellStrong buy
Strong sellSellNeutralBuyStrong buy
Neutral
SellBuy
Strong sellStrong buy
Strong sellSellNeutralBuyStrong buy
Neutral
SellBuy
Strong sellStrong buy
Strong sellSellNeutralBuyStrong buy
An aggregate view of professional's ratings.
Neutral
SellBuy
Strong sellStrong buy
Strong sellSellNeutralBuyStrong buy
Neutral
SellBuy
Strong sellStrong buy
Strong sellSellNeutralBuyStrong buy
Neutral
SellBuy
Strong sellStrong buy
Strong sellSellNeutralBuyStrong buy
Displays a symbol's price movements over previous years to identify recurring trends.
Curated watchlists where NESTLEIND is featured.

Indian stocks: Racing ahead
46 No. of Symbols
See all sparks
Frequently Asked Questions
The current price of NESTLEIND is 2,274.60 INR — it has decreased by −2.05% in the past 24 hours. Watch NESTLE INDIA LTD stock price performance more closely on the chart.
Depending on the exchange, the stock ticker may vary. For instance, on NSE exchange NESTLE INDIA LTD stocks are traded under the ticker NESTLEIND.
NESTLEIND stock has fallen by −7.50% compared to the previous week, the month change is a −4.11% fall, over the last year NESTLE INDIA LTD has showed a −10.62% decrease.
We've gathered analysts' opinions on NESTLE INDIA LTD future price: according to them, NESTLEIND price has a max estimate of 2,820.00 INR and a min estimate of 2,075.00 INR. Watch NESTLEIND chart and read a more detailed NESTLE INDIA LTD stock forecast: see what analysts think of NESTLE INDIA LTD and suggest that you do with its stocks.
NESTLEIND reached its all-time high on Sep 27, 2024 with the price of 2,778.00 INR, and its all-time low was 229.50 INR and was reached on Apr 23, 2010. View more price dynamics on NESTLEIND chart.
See other stocks reaching their highest and lowest prices.
See other stocks reaching their highest and lowest prices.
NESTLEIND stock is 2.48% volatile and has beta coefficient of 0.78. Track NESTLE INDIA LTD stock price on the chart and check out the list of the most volatile stocks — is NESTLE INDIA LTD there?
Today NESTLE INDIA LTD has the market capitalization of 2.19 T, it has increased by 2.57% over the last week.
Yes, you can track NESTLE INDIA LTD financials in yearly and quarterly reports right on TradingView.
NESTLE INDIA LTD is going to release the next earnings report on Oct 16, 2025. Keep track of upcoming events with our Earnings Calendar.
NESTLEIND earnings for the last quarter are 6.84 INR per share, whereas the estimation was 7.84 INR resulting in a −12.79% surprise. The estimated earnings for the next quarter are 8.51 INR per share. See more details about NESTLE INDIA LTD earnings.
NESTLE INDIA LTD revenue for the last quarter amounts to 50.96 B INR, despite the estimated figure of 51.09 B INR. In the next quarter, revenue is expected to reach 54.46 B INR.
NESTLEIND net income for the last quarter is 6.47 B INR, while the quarter before that showed 8.73 B INR of net income which accounts for −25.97% change. Track more NESTLE INDIA LTD financial stats to get the full picture.
NESTLE INDIA LTD dividend yield was 1.20% in 2024, and payout ratio reached 81.16%. The year before the numbers were 0.00% and 0.00% correspondingly. See high-dividend stocks and find more opportunities for your portfolio.
As of Jul 26, 2025, the company has 16.25 K employees. See our rating of the largest employees — is NESTLE INDIA LTD on this list?
EBITDA measures a company's operating performance, its growth signifies an improvement in the efficiency of a company. NESTLE INDIA LTD EBITDA is 48.36 B INR, and current EBITDA margin is 23.80%. See more stats in NESTLE INDIA LTD financial statements.
Like other stocks, NESTLEIND shares are traded on stock exchanges, e.g. Nasdaq, Nyse, Euronext, and the easiest way to buy them is through an online stock broker. To do this, you need to open an account and follow a broker's procedures, then start trading. You can trade NESTLE INDIA LTD stock right from TradingView charts — choose your broker and connect to your account.
Investing in stocks requires a comprehensive research: you should carefully study all the available data, e.g. company's financials, related news, and its technical analysis. So NESTLE INDIA LTD technincal analysis shows the strong sell today, and its 1 week rating is sell. Since market conditions are prone to changes, it's worth looking a bit further into the future — according to the 1 month rating NESTLE INDIA LTD stock shows the sell signal. See more of NESTLE INDIA LTD technicals for a more comprehensive analysis.
If you're still not sure, try looking for inspiration in our curated watchlists.
If you're still not sure, try looking for inspiration in our curated watchlists.