SWING IDEA - NEULAND LABNeuland Lab , a niche API manufacturer with strong export presence and leadership in complex molecules, is offering a technically strong swing trade opportunity from key support levels.
Reasons are listed below :
11,500 zone acting as a crucial support area
Formation of a hammer candle on the weekly timeframe, signaling potential reversal
Reversing from the 0.618 Fibonacci retracement zone – the golden pocket
Taking support at the 50-week EMA , holding long-term trend structure
Target - 14900 // 17600
Stoploss - weekly close below 10215
DISCLAIMER -
Decisions to buy, sell, hold or trade in securities, commodities and other investments involve risk and are best made based on the advice of qualified financial professionals. Any trading in securities or other investments involves a risk of substantial losses. The practice of "Day Trading" involves particularly high risks and can cause you to lose substantial sums of money. Before undertaking any trading program, you should consult a qualified financial professional. Please consider carefully whether such trading is suitable for you in light of your financial condition and ability to bear financial risks. Under no circumstances shall we be liable for any loss or damage you or anyone else incurs as a result of any trading or investment activity that you or anyone else engages in based on any information or material you receive through TradingView or our services.
@visionary.growth.insights
NEULANDLAB trade ideas

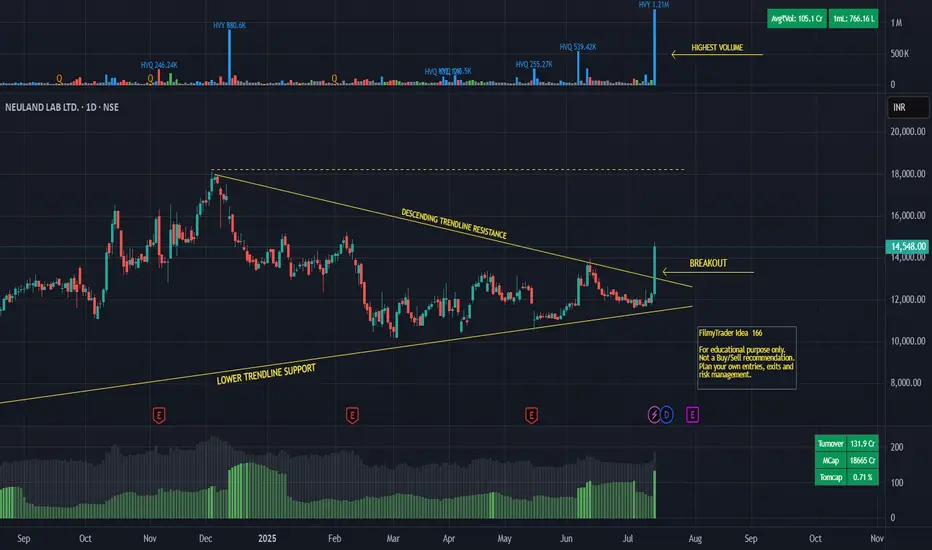
Neuland Lab - Trendline BreakoutNEULAND LABORATORIES LTD.
Breakout from trendline resistance on daily timeframe.
Breakout with heavy volume.
Close crossing last week high.
Increasing relative strength.
Disclaimer:
For educational purpose only.
Please do your own research before taking any trades.
Happy Trading!
NeulandLabs2 Months Consolidation Breakout.
Trendline Breakout with good volumes.
Target 13200
15000
StopLoss
Closing below 10800

NEULANDLAB short opportunityUpon the breakdown of the trendline NEULANDLAB has immense downside of 42 odd percentage. Next quarter results will be the catalyst, making or breaking the stock. Negative surprise in last two consecutive results declare us participants to beware of the liquidity present below this key level.
Short below daily close of 11,100
Stoploss - 8%
TP - Trail the 50 DMA close above

NEULAND LAB LTD S/R Support and Resistance Levels:
Support Levels: These are price points (green line/shade) where a downward trend may be halted due to a concentration of buying interest. Imagine them as a safety net where buyers step in, preventing further decline.
Resistance Levels: Conversely, resistance levels (red line/shade) are where upward trends might stall due to increased selling interest. They act like a ceiling where sellers come in to push prices down.
Breakouts:
Bullish Breakout: When the price moves above resistance, it often indicates strong buying interest and the potential for a continued uptrend. Traders may view this as a signal to buy or hold.
Bearish Breakout: When the price falls below support, it can signal strong selling interest and the potential for a continued downtrend. Traders might see this as a cue to sell or avoid buying.
20 EMA (Exponential Moving Average):
Above 20 EMA(50 EMA): If the stock price is above the 20 EMA, it suggests a potential uptrend or bullish momentum.
Below 20 EMA: If the stock price is below the 20 EMA, it indicates a potential downtrend or bearish momentum.
Trendline: A trendline is a straight line drawn on a chart to represent the general direction of a data point set.
Uptrend Line: Drawn by connecting the lows in an upward trend. Indicates that the price is moving higher over time. Acts as a support level, where prices tend to bounce upward.
Downtrend Line: Drawn by connecting the highs in a downward trend. Indicates that the price is moving lower over time. It acts as a resistance level, where prices tend to drop.
RSI: RSI readings greater than the 70 level are overbought territory, and RSI readings lower than the 30 level are considered oversold territory.
Combining RSI with Support and Resistance:
Support Level: This is a price level where a stock tends to find buying interest, preventing it from falling further. If RSI is showing an oversold condition (below 30) and the price is near or at a strong support level, it could be a good buy signal.
Resistance Level: This is a price level where a stock tends to find selling interest, preventing it from rising further. If RSI is showing an overbought condition (above 70) and the price is near or at a strong resistance level, it could be a signal to sell or short the asset.
Disclaimer:
I am not a SEBI registered. The information provided here is for learning purposes only and should not be interpreted as financial advice. Consider the broader market context and consult with a qualified financial advisor before making investment decisions.

#NEULANDLAB BULLISH SWINGNEULAND LAB on NSE is at a significant pivot point where it has closed above the 50 DEMA,
The Stock has had pullback above @ 38.2% of its previous impulse indicating a trend continuation.
A CHange of Character(CHoCh) at daily price close above 6450 , this is good entry point with a first target of 7100 (10% gain) to traverse the downward gap of 300 Rs. in the last downward impulse.
There has been consistent buying for the past 3 weeks but just below 20Volume MA.
Price has closed above 38.2% FIBO.
RSI on WEEKLY is at 40
Keep a SL of 6220 the Previous week low, set a Target 1 of 7100 (Gap Close) and Target 2 of 7750 for a (20% gain) the previous Swing High.
support at 5900-6100 lvl
Can add quantity as per risk appetite above the 61.8% pullback FIBO of 6914.

NEULAND LABS potential breakout High tight FLAG formation.
Trading in a narrow range.
Low risk entry point.
Strong prior buying force.
Volume contraction.

TRADE IDEA IN NEULANDLABHere we can see a Swing Trade-in NSE:NEULANDLAB
Buy NSE:NEULANDLAB
CMP 7529
TP 8668
SL 6676
Neuland Laboratories Ltd. engages in the manufacture and export of bulk pharmaceutical ingredients and intermediates for the generics industry. It also offers custom manufacturing solutions and synthetic peptides. The company was founded by Rama Mohan Rao Davuluri on January 7, 1984 and is headquartered in Hyderabad, India

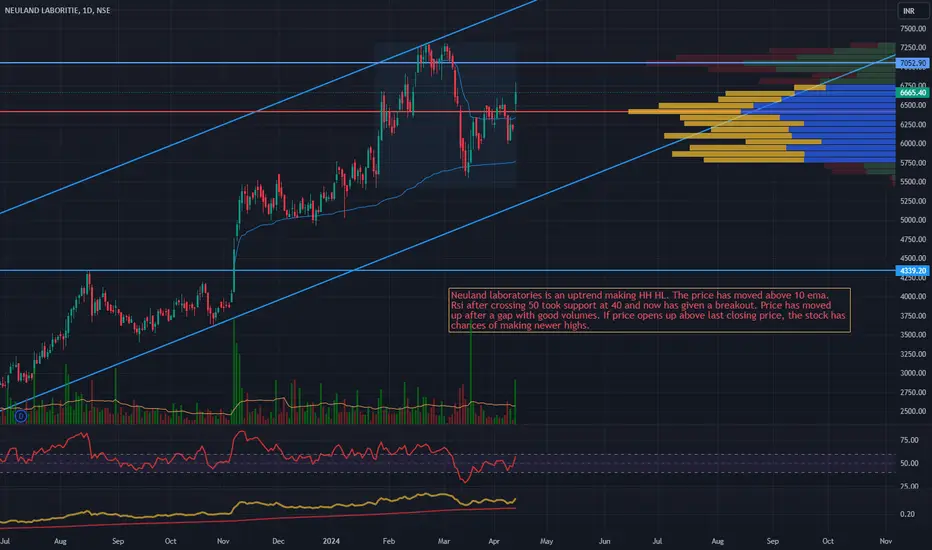
NEULAND LABORATORIESPrice making HH HL
Price moving above 10ema with volumes
Rsi taking support at 40 and giving a breakout.
Neuland laboratoriesPrice taking support between 23.6% and 38.2%. presence of rsi hidden bullish divergence. Avwap squueze brekout with volumes. The uptrend trend of stock is likely to continue.

VCP Pattern Formation VCP Pattern Formation
✅UPTREND:- Above 200MA
✅Near 52week high
✅Volume Contracting
Another contraction of about 5-8% Expected before the stock again makes new high
(Not a buying or selling recommendations)

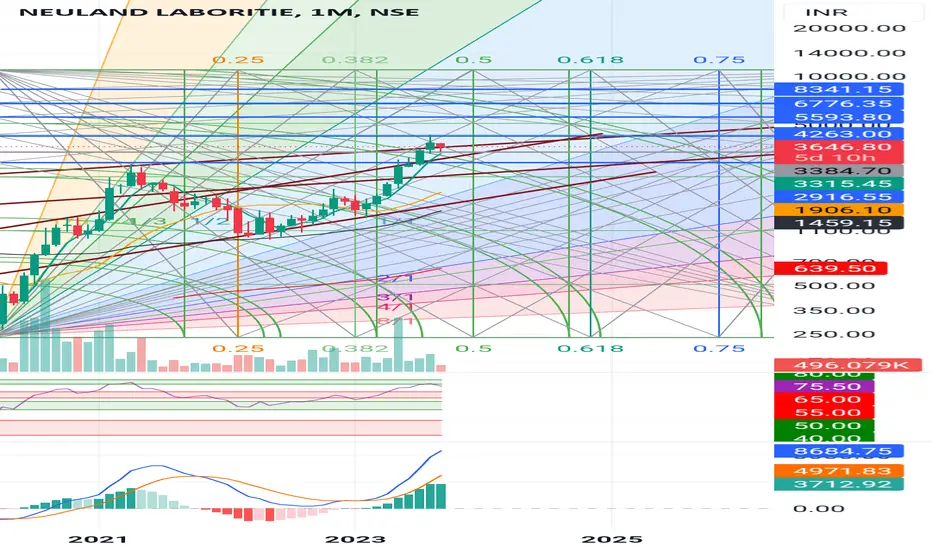
Neuland LaboratoriesThis pharmaceutical stock exhibits strong fundamentals and is also displaying promising technical indicators. Lower time frames show signs of a potential reversal, and the most recent monthly candle has rejected lower levels, aiming for key Gann levels at 4263. A safe entry point lies above this level, but for those with a higher risk tolerance, entry may be considered now with a stop-loss at 3385 levels.
#NEULANDLABS Stellar Run, book partial profits!Neuland Labs has given stellar returns since the beginning of the year. Its more than 3x since Jan 2023. It should likely cooldown for many months before the moving averages catch up and then resume its journey upwards!


NEWLAND rally done ! short 3250 sl 3450voodo lines indicate temp top , wort a risk , take some money off at 1:1 and trail 2 cost if lucky

Techno Funda Analysis = Neuland LabIn this video I have explained how to analyze a stock Technically & Fundamentally. Using simple & free Website of BSE India.
This video is only for Learning Purpose & not a Buy Call or tip! Viewers discretion is solicitated.

NEULAND LABS WEEKLY CHART Cup & Handle breakout in weekly chart
Rsi above 60 +
Adx above 25+
NSE:NEULANDLAB


Possible Swing Trade - Breakout of Resistance - NEULANDLABNEULANDLAB - Resistance has been broken, but it may have been a false breakout; thus, only intend to buy above 1550.

Support LevelsNeulandlab support levels....view is invalid below 960.
Disc: Not a recommendation and not holding.

INVESTMENT IDEANeuland Laboratories is engaged in manufacturing and selling of bulk drugs and caters to both domestic and international markets.
KEY POINTS
Business Segments
The company has three business segments namely Prime API, Niche-Specialty API & CMS.
It largely caters to small/mid-size venture backed biotech companies which are working on new products. It caters to a wide number of clients, both in India and overseas.
Prime APIs Segment (46% of revenues)
This segment includes mature APIs that have relatively higher competition.
It comprises over 15 APIs, where Ciprofloxacin and Levetiracetam are the key molecules.
In this segment, top 5 products/ APIs account for 72% of revenues and top 5 customers account for 48% of revenues.
Niche/ Specialty APIs (22% of revenues)
This group consists of the high-value, complex molecules which necessitate R&D expertise to manufacture consistent quality products.
This segment is the profitability driver within the API Business.
The Company has over 20 molecules in this segment. Some of the molecules in this segment continue to enjoy patent protection and the Company supplies these products for validation batches and regulatory filings.
In this segment, top 5 products/ APIs account for 62% of revenues and top 5 customers account for 35% of revenues.
CMS Segment (30% of revenues)
The CMS (Contract manufacturing services) vertical serves innovator pharma and biotech companies.
In this business, the Company develops and delivers APIs and intermediates in small scale clinical trial quantities and later commercial-scale requirements as a product moves through the clinical cycle.
Presently, it has 21 CMS projects under pre-clinical stage, 18 in development stage and only 15 in commercial stage. It has a total of 76 CMS projects as of yet.
The revenues from this segment has increased significantly from 11% of total revenues in FY16 to to 30% in FY21.
Geographical Revenue Breakup
Presently, Europe accounts for 42% of revenues, followed by North America (35%), APAC Region (7%), India (6%), Mena (4%), Japan (4%) and Latin America (3%).
R&D Capabilities
The company houses 15 development facilities inside its only R&D center in Hyderabad. It has 900+ DMFs filed, 300+ API processes developed & 200+ patents filed till date.
It spent ~21 crores (3% of revenues) towards R&D in FY20.
Manufacturing Facilities
Company owns 3 manufacturing facilities with a total capacity of 730 Kilo liters p.a. of APIs.
QIP
In FY19, the company raised ₹124 crores via QIP by issuing 1,675,000 equity shares at a price of ₹740 per share.
Scheme of Amalgamation
In 2016, the company was involved in a Scheme of Amalgamation wherein Neuland Health Sciences Pvt Ltd & Neuland Pharma Research Pvt Ltd was merged with the company.
As per the scheme, the company allotted ~2,270,000 equity shares to the promoters of the entities.


