NIFTY50.....Miss a final sell-off!Hello Traders,
the NIFTY50 is moving within a sideways-range. It ranges from a possible wave ((iii)), with a green high @ 25116 and a low of 24508, the end of a wave z (pink) of a wave (w)/(a) of ((iv)) green!
What can we expect for the coming days?
I think, the final low is not in the cards yet! I
About Nifty 50 Index
NIFTY 50 is the main index for the National Stock Exchange of India (NSE). It tracks the performance of the top 50 stocks by market capitalization from 13 sectors of the Indian economy. With such a relatively small number of companies within the index it still represents over 60% of the free float market capitalization of the stocks listed on NSE, and serves as a benchmark for fund portfolios and index funds. The list of the NIFTY 50 Index constituents is rescheduled every 6 month.
Related indices

#nifty directions and levels for July 24Good morning, friends! 🌞
Here are the market directions and levels for July 24th:
The global market is showing a moderately bullish sentiment.
Meanwhile, the local market is also exhibiting a moderately bullish tone.
Today, Gift Nifty indicates a gap-up opening of around 60 points.
What can we ex

Todays nifty market analysis.if nifty sustains above 25150 expecting a target of 25225.
you can expect a bearish momentum below 25118. Target will be 25050.


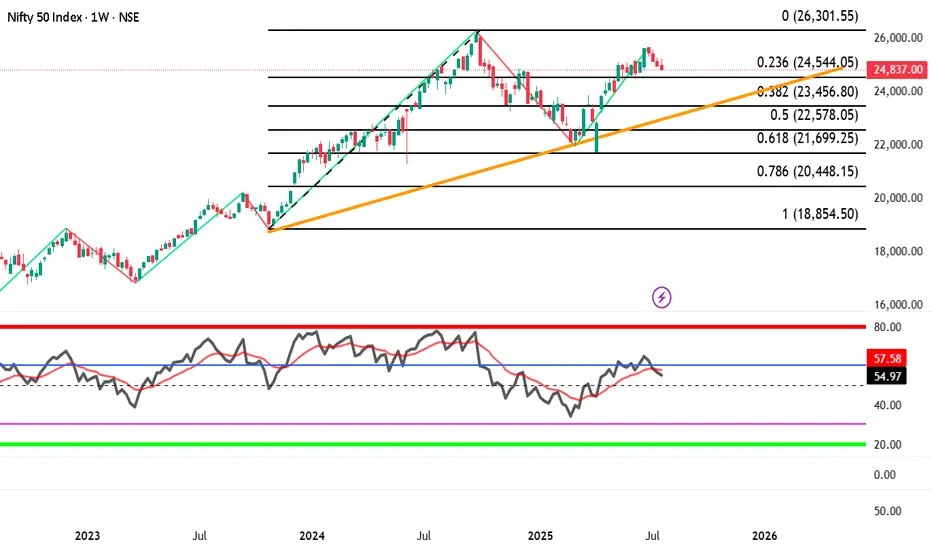
Nifty index showing downtrend with negative divergence BEARISH VIEW Nifty index --showing downtrend with negative divergence , watch out important trendline breakdown and fib. levels on nifty index.
if it happens than there might be BLOOD BATH IN MIDCAP AND SMALL CAP INDEX ALSO
Nifty index may fall big time if breaks 24544 than 23460, 22580, 21
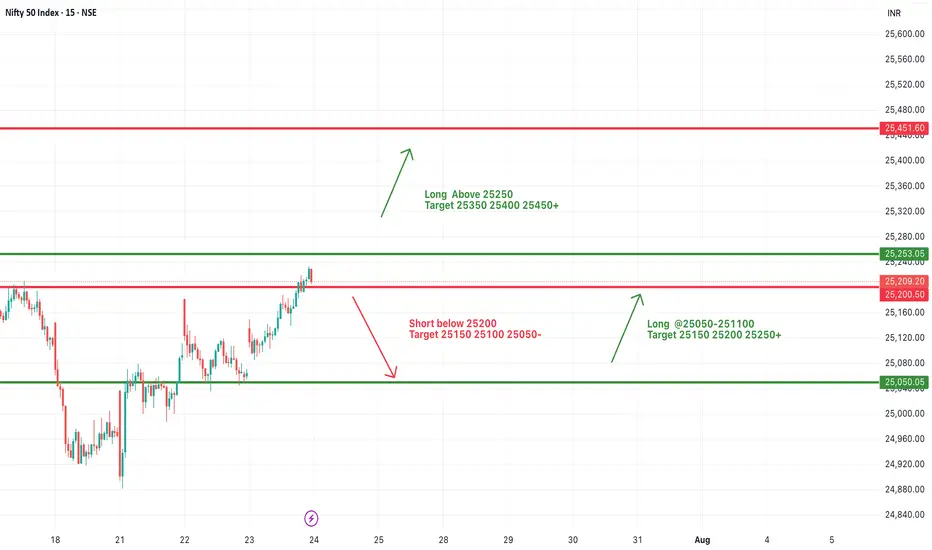
#NIFTY Intraday Support and Resistance Levels - 24/07/2025Nifty is expected to open with a bullish gap-up today, breaching the 25,250 resistance zone. This level has been acting as a consolidation ceiling in recent sessions, and today’s opening above it indicates strong buying momentum in the market.
If Nifty sustains above 25,250, we may witness a fresh
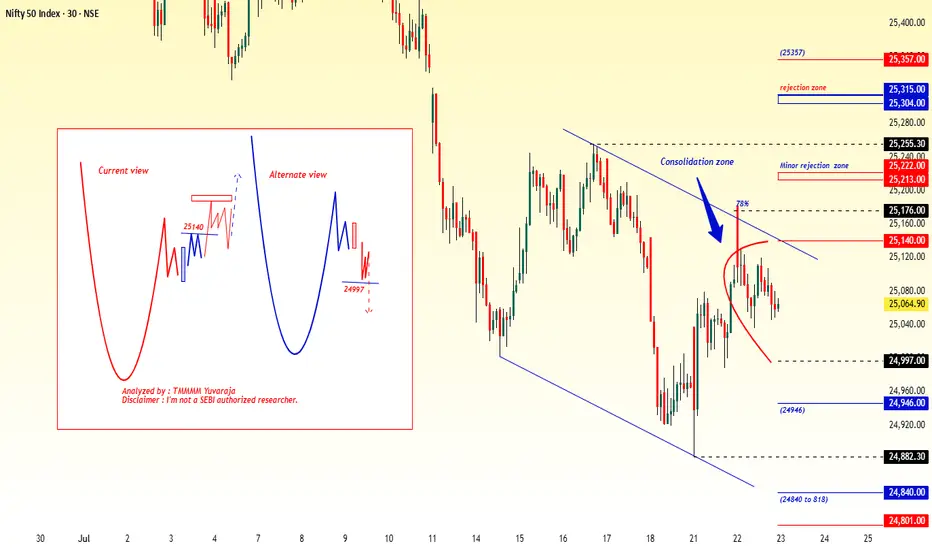
Nifty has broken Hoz support, Trendline & Rising Triangle.Nifty has broken Hoz support, Trendline & Rising Triangle. It may fall to liquidity support level of 24400, before resuming its upward trajectory.

#Nifty directions and levels for July 22nd:Good morning, friends! 🌞
Here are the market directions and levels for July 22nd:
The global market shows no major changes and continues to maintain a moderately bearish sentiment.
Meanwhile, the local market is exhibiting a moderately bullish tone. Today, Gift Nifty indicates a gap-up opening of

#Nifty directions and levels for July 23rd:Good morning, friends! 🌞
Here are the market directions and levels for July 23rd:
The global market shows no major changes and continues to maintain a moderately bearish sentiment.
Meanwhile, the local market is exhibiting a moderately bullish tone. Today, Gift Nifty indicates a gap-up opening of
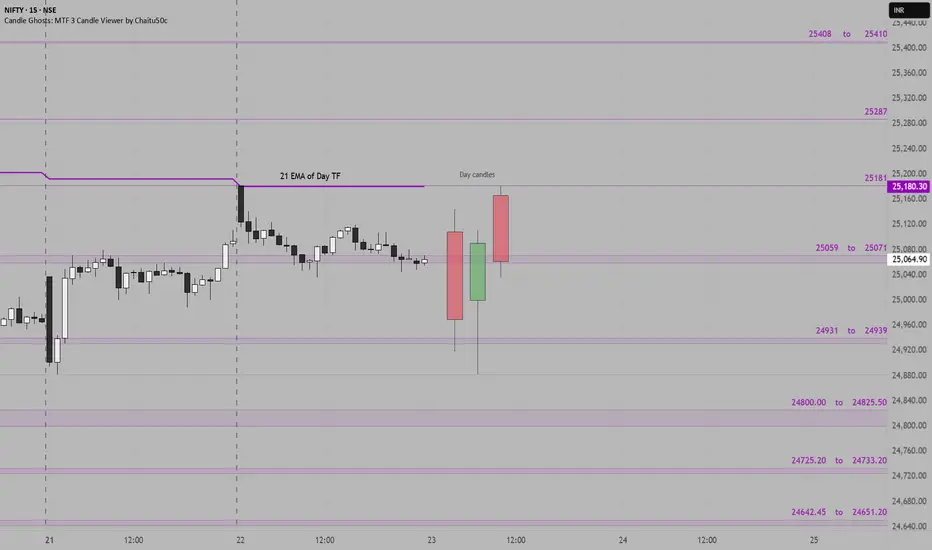
Nifty Support & Resistance Zones for 23rd July 2025The following support and resistance zones have been identified for Nifty based on recent price structure, candle reactions, and high-activity price clusters:
Resistance Zones:
25408 – 25410
25287
25181
25059 – 25071
Support Zones:
24931 – 24939
24800 – 24825.50
24725.20 – 24733.20
24
See all ideas
Summarizing what the indicators are suggesting.
Oscillators
Neutral
SellBuy
Strong sellStrong buy
Strong sellSellNeutralBuyStrong buy
Oscillators
Neutral
SellBuy
Strong sellStrong buy
Strong sellSellNeutralBuyStrong buy
Summary
Neutral
SellBuy
Strong sellStrong buy
Strong sellSellNeutralBuyStrong buy
Summary
Neutral
SellBuy
Strong sellStrong buy
Strong sellSellNeutralBuyStrong buy
Summary
Neutral
SellBuy
Strong sellStrong buy
Strong sellSellNeutralBuyStrong buy
Moving Averages
Neutral
SellBuy
Strong sellStrong buy
Strong sellSellNeutralBuyStrong buy
Moving Averages
Neutral
SellBuy
Strong sellStrong buy
Strong sellSellNeutralBuyStrong buy
Displays a symbol's price movements over previous years to identify recurring trends.
Frequently Asked Questions
The current value of Nifty 50 Index is 24,680.90 INR — it has fallen by −0.63% in the past 24 hours. Track the index more closely on the Nifty 50 Index chart.
Nifty 50 Index reached its highest quote on Sep 27, 2024 — 26,277.35 INR. See more data on the Nifty 50 Index chart.
The lowest ever quote of Nifty 50 Index is 279.00 INR. It was reached on Jul 3, 1990. See more data on the Nifty 50 Index chart.
Nifty 50 Index value has decreased by −1.27% in the past week, since last month it has shown a −3.50% decrease, and over the year it's increased by 1.05%. Keep track of all changes on the Nifty 50 Index chart.
The top companies of Nifty 50 Index are NSE:RELIANCE, NSE:HDFCBANK, and NSE:TCS — they can boast market cap of 217.66 B INR, 177.59 B INR, and 131.03 B INR accordingly.
The highest-priced instruments on Nifty 50 Index are NSE:MARUTI, NSE:ULTRACEMCO, and NSE:BAJAJ_AUTO — they'll cost you 12,340.00 INR, 12,240.00 INR, and 8,089.50 INR accordingly.
The champion of Nifty 50 Index is NSE:ETERNAL — it's gained 40.32% over the year.
The weakest component of Nifty 50 Index is NSE:INDUSINDBK — it's lost −41.24% over the year.
Nifty 50 Index is just a number that lets you track performance of the instruments comprising the index, so you can't invest in it directly. But you can buy Nifty 50 Index futures or funds or invest in its components.
The Nifty 50 Index is comprised of 50 instruments including NSE:RELIANCE, NSE:HDFCBANK, NSE:TCS and others. See the full list of Nifty 50 Index components to find more opportunities.