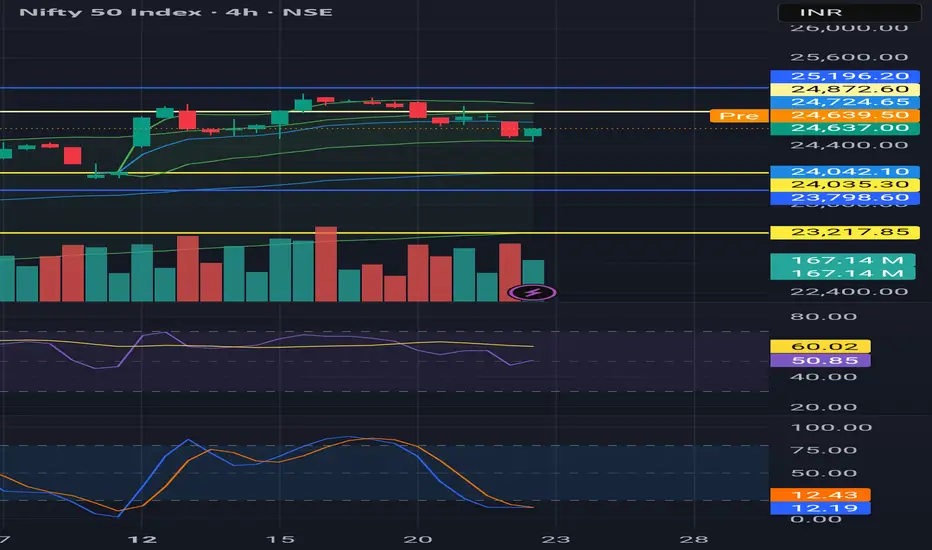
Nifty 50 AnalysisNifty 50 showing signs of short-term exhaustion after a strong dip. RSI hovering near 50 and Stochastic in oversold zone hint at a possible relief bounce. Crucial support zone: 24,600–24,500. If broken, 24,035 and 23,798 levels are next. Stay cautious—trend is still weak until a clear reversal forms. #NiftyAnalysis #StockMarketIndia
NIFTY trade ideas
#NIFTY Intraday Support and Resistance Levels - 23/05/2025Today, a flat opening is expected in Nifty. If after opening Nifty starts trading and sustains below the 24700–24650 zone, a short trade can be considered with downside targets of 24600, 24550, and 24500.
Further weakness may be seen if Nifty breaks below the 24450 level, opening the way for extended downside targets at 24350, 24300, and 24250.
On the upside, if Nifty sustains above 24750, a long position can be initiated. This may lead to bullish movement toward 24850, 24900, and 24950+ levels. However, 24950 will act as a key resistance, and reversal is possible near this zone.

23 May Nifty50 trading zone #Nifty50 #option trading
99% working trading plan
👉Gap up open 24683 above & 15m hold after positive trade target 24860, 24980
👉Gap up open 24683 below 15 m not break upside after nigetive trade target 24480, 24330
👉Gap down open 24480 above 15m hold after positive trade target 24683, 24860
👉Gap down open 24480 below 15 m not break upside after nigetive trade target 24330, 24170
Trade plan for education purpose I'm not responsible your trade
More education follow & support me

NIFTY 50 KEY LEVELS FOR 23/05/2025// The core idea behind this indicator was sparked by a simple but powerful clue:
// 👉 "If you get one level, you get all levels."
// From that point onward, everything—the logic, calculation method, and application—has been developed independently through my own analysis and experience.
// I am not a seller, and no one taught me this system. This method is a result of my own effort and refinement.
///////////////////// Explanation /////////////////////
// This trading system is designed to eliminate blind trades by offering confirmation-based entry and exit points.
///////////////////// Entry/Exit Strategy /////////////////////
// - Use the BLACK line for long trades, and the RED line for short trades, in line with confirmation from your trading plan.
// - Stop Loss:
// - For long trades: below the RED line.
// - For short trades: above the BLACK line.
// - Take Profit:
// - For long trades: target the next RED line above.
// - For short trades: target the next BLACK line below.
///////////////////// Recommended Timeframe /////////////////////
// Use on a 5-minute chart for best results.
///////////////////// Disclaimer /////////////////////
// This setup is shared purely for educational purposes.
// I am not responsible for any gains or losses that may result from its use.
// Always use your own judgment and risk management.

Nifty Analysis EOD – May 22, 2025 – Thursday🟢 Nifty Analysis EOD – May 22, 2025 – Thursday 🔴
Nifty weekly expiry, shocking climax...!
📉 Nifty Summary:
A 66-point gap-down set the stage, followed by a quick 196-point slide within the first 20 minutes, bottoming out at 24,541.60. From here, the index attempted a bounce but faced stiff resistance at the 24,625 ~ 24,640 zone—not once, but twice. This zone flipped polarity and began acting as resistance instead of support.
The third breakdown at 12:45 PM finally breached the day’s low, taking Nifty to a new bottom of 24,509.10, and then further to 24,462.40 by 2:35 PM. But just when it looked like the bulls were done for, the market made a shocking expiry bounce, recovering sharply to close at 24,637, back inside the crucial 24,625 ~ 24,640 zone.
🛡 5 Min Chart with levels
🔄 The day’s character was mostly range-bound post the initial fall, with a 90-point band until the IB Low was broken. The fall lacked strong conviction—signs of both bulls and bears trying to dominate but failing to sustain.
The final hour’s rebound was the real drama—profit booking, fresh buying, and expiry short covering all collided to cause a spike that caught many off-guard. A classic expiry move—some traders hurt, some became heroes.
📌 Yesterday’s Note Reference:
"Below 24640–24625, weakness may extend down towards: → 24500 → 24460."
✅ Market played by the script, touched 24500, and 24460 got hit too.
📉 Is the retracement run finished?
Technically, YES.
A bold call, but unless global headwinds reappear, today’s low must sustain.
If it doesn’t, watch for the 24,330 ~ 24,365 zone as the last guard. Breach that? Gap-fillers may run wild down to 24,160 ~ 24,008.
Not a trade plan—just technical facts. Let's see what the tape reveals next.
🛡 5 Min Intraday Chart
🥷 Gladiator Strategy Update
Strategy Parameters
ATR: 327.22
IB Range: 195.90 → Medium IB
Market Structure: Imbalanced
Trade Highlights
✅ 1st Long Trigger: 12:45 PM – Target Achieved (R:R = 1:1)
💼 Total Trades: 1
🕯 Daily Time Frame Chart
📊 Support & Resistance Levels
🔺 Resistance Zones:
• 24,768 ~ 24,820
• 24,660
• 24,640 ~ 24,625
• 24,882
• 24,920
• 24,980 ~ 25,000
• 25,062 ~ 25,070
🔻 Support Zones:
• 24,590
• 24,530 ~ 24,480
• 24,460
🧠 Final Thoughts
"Markets don’t trap you; your lack of preparation does."
Today was a pure example of expiry surprise—respect the zones, follow the structure, and keep adapting.
✏️ Disclaimer ✏️
This is just my personal viewpoint. Always consult your financial advisor before taking any action.

NIFTY 50 NIFTY 50 Analysis Today | Key Levels, Trend OutlookCurrent NIFTY 50 trend direction BULISH
Important breakout & breakdown levels 25,100 LEVEL IS STRONG RESISTANCE
Market sentiment overview BULISH NOW MARKET consolidation ZONE WITH 2 TO 3 WEEK SMALL CORRECTION FOR MARET DOWN SIDE MOVE NIFTY 50

Nifty 50 Technical Analysis: Key Levels to Watch This Week!📈 Timeframe: Daily Chart
📍 Instrument: NSE:NIFTY
🔍 Chart Overview:
Nifty 50 has been trading in a consolidation range between and . We are now approaching a critical breakout zone that could define the next short-term trend.
🔑 Key Levels:
Immediate Resistance: 25071
Immediate Support: 24488
Breakout Above: 25071
Breakdown Below: 24488
🔔 Trading Plan:
🔼 Bullish Scenario: Wait for a breakout above 25071 with volume confirmation.
🔽 Bearish Scenario: Breakdown below 24488 may invite selling pressure.
💡 Risk Management: Use proper stop-loss below support/resistance
📌 Disclaimer:
This is for educational purposes only. Do your own research before taking any trade.
📢 Hashtags:
#Nifty50 #TradingView #ChartAnalysis #TechnicalAnalysis #NSEIndia #NiftyBreakout #PriceAction #StockMarketIndia #SwingTrade #NiftyToday


NIFTY S/R for 23/5/25Support and Resistance Levels:
Support Levels: These are price points (green line/shade) where a downward trend may be halted due to a concentration of buying interest. Imagine them as a safety net where buyers step in, preventing further decline.
Resistance Levels: Conversely, resistance levels (red line/shade) are where upward trends might stall due to increased selling interest. They act like a ceiling where sellers come in to push prices down.
Breakouts:
Bullish Breakout: When the price moves above resistance, it often indicates strong buying interest and the potential for a continued uptrend. Traders may view this as a signal to buy or hold.
Bearish Breakout: When the price falls below support, it can signal strong selling interest and the potential for a continued downtrend. Traders might see this as a cue to sell or avoid buying.
MA Ribbon (EMA 20, EMA 50, EMA 100, EMA 200) :
Above EMA: If the stock price is above the EMA, it suggests a potential uptrend or bullish momentum.
Below EMA: If the stock price is below the EMA, it indicates a potential downtrend or bearish momentum.
Trendline: A trendline is a straight line drawn on a chart to represent the general direction of a data point set.
Uptrend Line: Drawn by connecting the lows in an upward trend. Indicates that the price is moving higher over time. Acts as a support level, where prices tend to bounce upward.
Downtrend Line: Drawn by connecting the highs in a downward trend. Indicates that the price is moving lower over time. It acts as a resistance level, where prices tend to drop.
Disclaimer:
I am not a SEBI registered. The information provided here is for learning purposes only and should not be interpreted as financial advice. Consider the broader market context and consult with a qualified financial advisor before making investment decisions.

Nifty levels - May 23, 2025Nifty support and resistance levels are valuable tools for making informed trading decisions, specifically when combined with the analysis of 5-minute timeframe candlesticks and VWAP. By closely monitoring these levels and observing the price movements within this timeframe, traders can enhance the accuracy of their entry and exit points. It is important to bear in mind that support and resistance levels are not fixed, and they can change over time as market conditions evolve.
The dashed lines on the chart indicate the reaction levels, serving as additional points of significance to consider. Furthermore, take note of the response at the levels of the High, Low, and Close values from the day prior.
We hope you find this information beneficial in your trading endeavors.
* If you found the idea appealing, kindly tap the Boost icon located below the chart. We encourage you to share your thoughts and comments regarding it.
Wishing you success in your trading activities!

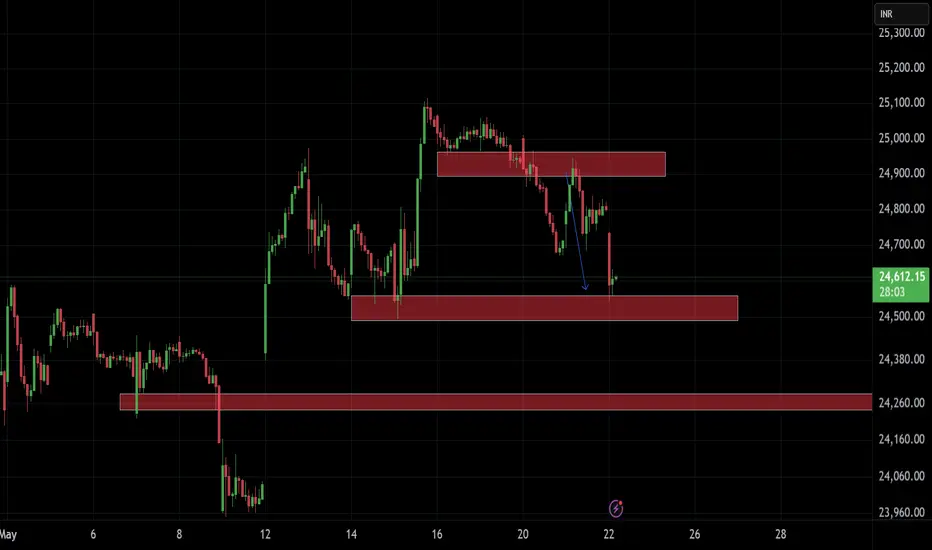
Nifty Index Breaks Out of Wedge PatternNifty index has broken out of the wedge pattern
and is now in free fall towards the identified targets.

NIFTYI see these levels on Nifty. Forgot to paste the good shorting trade opportunity yesterday, however shared 2 charts with analysis of gift nifty which hinted short for market from past 2 days. Don't go into patterns and take early trades trade only when levels break or sustain.
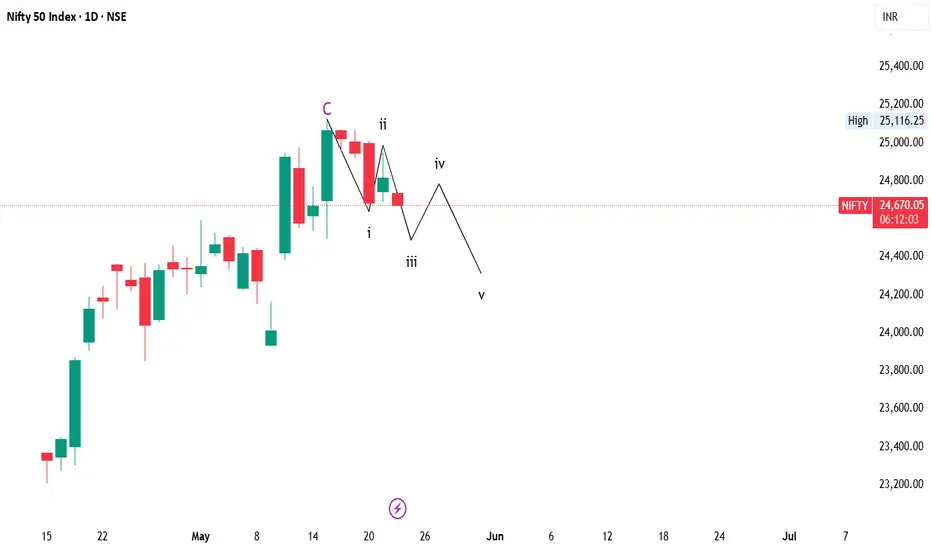
#Nifty Action
As expected, Nifty Wave 2 reached its 61.8% upward target yesterday.
Nifty will move towards its own wave3 goal. Between in 24280 to 24200
#NIFTY Intraday Support and Resistance Levels - 22/05/2025Today a flat opening is expected in Nifty. After opening, if Nifty sustains above the 24750–24800 level, an upside movement is likely towards 24850, 24900, and possibly up to 24950+, which will act as a strong resistance zone for today’s session. Any rally reaching this level may witness a reversal.
On the downside, if Nifty starts trading below 24700, a major downside movement is expected towards 24600, 24550, and potentially 24500– levels in today’s session.

Nifty Analysis EOD – May 21, 2025 – Wednesday 🟢 Nifty Analysis EOD – May 21, 2025 – Wednesday 🔴
🌀 The Dead Cat Bounces Effect After Yesterday's Quick Fall 🌀
Nifty opened with a 45-point gap-up and, within the first 10 minutes, that gap was filled—marking a low of 24692.65. From there, a sudden burst of buying pressure launched the index above the 24768–24800 resistance zone in just 25 minutes. This sharp move triggered a round of short covering, propelling Nifty to the day’s high of 24946.20.
As shared live on TradingView, the Fib resistance zone of 24930–24940 (0.764–0.786 levels) was a key level to watch. True to expectation, Nifty faced strong rejection from this zone, leading to a V-shaped reversal—wiping out all gains in the next hour and marking a new low of 24685.35.
🌀 Screenshot from Tradingview - 1
🌀 Screenshot from Tradingview - 2
It was a rollercoaster ride in the first half. Post this, Nifty traded mostly within the CPR’s Top Central (TC) and Bottom Central (BC) range—though this range itself was 104 points, keeping the session active and far from boring.
Nifty’s close at 24813, around the VWAP and Central CPR, suggests a temporary equilibrium between buyers and sellers. The good part? We closed above the critical 24768–24800 support-turned-resistance. But there's a catch—the close is below yesterday’s Fib 0.5 retracement, signaling potential caution.
⚠️ Cautionary Note:In the short-term, today’s session fits the textbook example of a Dead Cat Bounce. With weekly expiry tomorrow, it's wise to stay alert and not get trapped in noise. Discipline and patience will be key.
🛡 25 Min Time Frame Chart
🔄 What’s Next? / Bias Direction
Wide trading range remains intact. But here’s the game plan:
📈 Long Setup:Above 24850, watch for strength with targets:→ 24920→ 24980→ 25075
📌 Above 25075, sharp short covering can drive price towards 25222 (Yes, it’s far—but good traders plan ahead, always).
📉 Short Setup:Below 24640–24625, weakness may extend down towards:→ 24500→ 24460
Let price action confirm.
🛡 5 Min Intraday Chart
🥷 Gladiator Strategy Update
Strategy Parameters
ATR: 324.57
IB Range: 151.65 → Medium IB
Market Structure: Balanced
Trade Highlights
✅ 1st Long Trigger: 10:05 AM – Target Achieved (R:R = 1:1.5)
💼 Total Trades: 1
🕯 Daily Time Frame Chart
🔍 Support & Resistance Levels
🔺 Resistance Zones:
24,882
24,920
24,980 ~ 25,000
25,062 ~ 25,070
🔻 Support Zones:
24,768 ~ 24,800
24,660
24,640 ~ 24,625
24,590
24,530 ~ 24,480
24,460
✍️ Final Thoughts
"Volatility doesn’t trap the prepared, it challenges them."
Tomorrow being expiry, let the levels speak. Stay objective, stay adaptive.
✏️ Disclaimer
This is just my personal viewpoint. Always consult your financial advisor before taking any action.

NIFTY analysis for 22nd and 23rd May, 2025H1 And M15 trends are bullish.
M15 corrective move going to finish.
After inducement (X) taking, M15 corrective trend must mitigate the extreme OB (order block). After M15 OB mitigation wait for lower time frame (i.e. M3 or M1) CHoCH or flip then plan for long entry, that will be M15 and H1 impulsive move or intraday bias.

Educational Video: Nifty Outlook-How Technical analysis is done.We have tried to draw a parallel channel on Nifty hourly chart. The chart indicates that we are just below the mid channel line. The mid channel line will act as a resistance if the price is below the same and will act as a support if the price is above it. Right now it is acting as a resistance. Top of the channel always acts as a resistance and bottom of the channel always acts as a support. Additionally there are historic resistances and supports which indicate the other levels which may act as support or resistance. There are also Mother and Father lines (50 and 200 EMA)(EMA = Exponential Moving Average).
To understand in detail how parallel channel works or how supports and resistance are derived or what is Mother, Father and Small Child theory. I would recommend you my book The Happy Candles Way to Wealth creation. By reading this book you can understand all these concepts with ease. You can additionally understand what is fundamental and technical analysis and how to do it. You will also get to understand the dos and the don'ts of investment in equity by reading various chapters on Behavioural Finance. Overall it is a value for money book available on Amazon in Paperback and Kindle version. The book is also available on Google play book and other E-book stores. You can also contact us for getting the copy of it. The Happy Candles way is one of the highest rated books in the category and you can go through the reviews of the book on Amazon before purchasing it.
Based on Parallel Channel, Supports and Resistances, Mother Father and Small child theory resistances and supports of Nifty remain at.
Nifty Resistances Remain at: 24815, 24909, 24977, 25045 and 25116. The channel top resistance for the current parallel channel is around 25372.
Nifty Supports Remain at: 24780 (Mother Line Support), 24679 and 24537. The Channel Bottom support is currently around 24396. 24247 is the most important Father line support.
Shadow of the candles currently is neutral. Indicating Nifty can still go in any direction. A pennant like structure (Triangle is also formed). This indicates that Breakout or Breakdown of this triangle or pennant can take Nifty a long way on either side. Nifty is currently squeezing in the pennant with limited space. Usually when the space is limited a Breakout can happen in either direction.
Disclaimer: The above information is provided for educational purpose, analysis and paper trading only. Please don't treat this as a buy or sell recommendation for the stock or index. The Techno-Funda analysis is based on data that is more than 3 months old. Supports and Resistances are determined by historic past peaks and Valley in the chart. Many other indicators and patterns like EMA, RSI, MACD, Volumes, Fibonacci, parallel channel etc. use historic data which is 3 months or older cyclical points. There is no guarantee they will work in future as markets are highly volatile and swings in prices are also due to macro and micro factors based on actions taken by the company as well as region and global events. Equity investment is subject to risks. I or my clients or family members might have positions in the stocks that we mention in our educational posts. We will not be responsible for any Profit or loss that may occur due to any financial decision taken based on any data provided in this message. Do consult your investment advisor before taking any financial decisions. Stop losses should be an important part of any investment in equity.

Parallel Channel and other Technicals Explained on a Nifty ChartWe have tried to draw a parallel channel on Nifty hourly chart. The chart indicates that we are just below the mid channel line. The mid channel line will act as a resistance if the price is below the same and will act as a support if the price is above it. Right now it is acting as a resistance. Top of the channel always acts as a resistance and bottom of the channel always acts as a support. Additionally there are historic resistances and supports which indicate the other levels which may act as support or resistance. There are also Mother and Father lines (50 and 200 EMA)(EMA = Exponential Moving Average).
To understand in detail how parallel channel works or how supports and resistance are derived or what is Mother, Father and Small Child theory. I would recommend you my book The Happy Candles Way to Wealth creation. By reading this book you can understand all these concepts with ease. You can additionally understand what is fundamental and technical analysis and how to do it. You will also get to understand the dos and the don'ts of investment in equity by reading various chapters on Behavioural Finance. Overall it is a value for money book available on Amazon in Paperback and Kindle version. The book is also available on Google play book and other E-book stores. You can also contact us for getting the copy of it. The Happy Candles way is one of the highest rated books in the category and you can go through the reviews of the book on Amazon before purchasing it.
Based on Parallel Channel, Supports and Resistances, Mother Father and Small child theory resistances and supports of Nifty remain at.
Nifty Resistances Remain at: 24815, 24909, 24977, 25045 and 25116. The channel top resistance for the current parallel channel is around 25372.
Nifty Supports Remain at: 24780 (Mother Line Support), 24679 and 24537. The Channel Bottom support is currently around 24396. 24247 is the most important Father line support.
Shadow of the candles currently is neutral. Indicating Nifty can still go in any direction. A pennant like structure (Triangle is also formed). This indicates that Breakout or Breakdown of this triangle or pennant can take Nifty a long way on either side. Nifty is currently squeezing in the pennant with limited space. Usually when the space is limited a Breakout can happen in either direction.
Disclaimer: The above information is provided for educational purpose, analysis and paper trading only. Please don't treat this as a buy or sell recommendation for the stock or index. The Techno-Funda analysis is based on data that is more than 3 months old. Supports and Resistances are determined by historic past peaks and Valley in the chart. Many other indicators and patterns like EMA, RSI, MACD, Volumes, Fibonacci, parallel channel etc. use historic data which is 3 months or older cyclical points. There is no guarantee they will work in future as markets are highly volatile and swings in prices are also due to macro and micro factors based on actions taken by the company as well as region and global events. Equity investment is subject to risks. I or my clients or family members might have positions in the stocks that we mention in our educational posts. We will not be responsible for any Profit or loss that may occur due to any financial decision taken based on any data provided in this message. Do consult your investment advisor before taking any financial decisions. Stop losses should be an important part of any investment in equity.

Nifty levels - May 22, 2025Nifty support and resistance levels are valuable tools for making informed trading decisions, specifically when combined with the analysis of 5-minute timeframe candlesticks and VWAP. By closely monitoring these levels and observing the price movements within this timeframe, traders can enhance the accuracy of their entry and exit points. It is important to bear in mind that support and resistance levels are not fixed, and they can change over time as market conditions evolve.
The dashed lines on the chart indicate the reaction levels, serving as additional points of significance to consider. Furthermore, take note of the response at the levels of the High, Low, and Close values from the day prior.
We hope you find this information beneficial in your trading endeavors.
* If you found the idea appealing, kindly tap the Boost icon located below the chart. We encourage you to share your thoughts and comments regarding it.
Wishing you success in your trading activities!

Nifty 22 May StrangleSELL 25100 CE @ 38 and 24500 PE @ 30
Combined premium 68, SL 98 combined premium
playing on theda decay, should be able to book at opening bell.
Naked strangle - headge buy each side leg at 60% of sell price


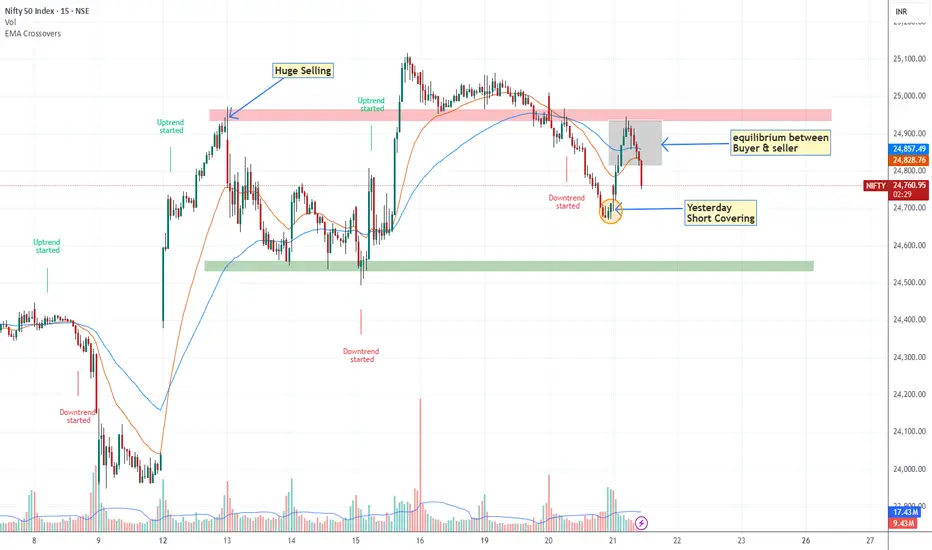
Nifty Might Range-Bound until it doesn't break 24950 levelToday 21/05/2025 around 11 O clock Nifty Tested 24950 the push was not above average volume driven that's why market was going to pullback although something absence of sellers comparatively had seen on 13 may u can see on chart but still it required to break 24950 level with good volume for being upward journey, until we expect market may range between 24500-25000.
strong Resistance- 24950-25000
Strong Support -24500
Nifty trend directionNifty 24907 has volume negetive diverged. 24858 will decide the trend. Nifty currently holding above this with V bottom recovery. Need to see if this could sustain
