Nifty Analysis EOD – May 20, 2025 – Tuesday🟢 Nifty Analysis EOD – May 20, 2025 – Tuesday 🔴
Breakout Denied. Breakdown Delivered.
📈 Nifty SummaryAfter two sessions of tight-range traps, the long-awaited move finally played out today—and it was all about the bears.
Despite a 50-point gap-up start at 24,996 (just shy of the psychological 25,000 level), Nifty quickly reversed. The open was inside the resistance zone (24,980–25,000), and ignoring a minor 15-point wick, it resembled a classic Open = High (OH) trap.
By 35 minutes into the session, the index had already broken PDL and S1, hitting a low of 24,863, only to bounce 100+ points back toward 24,967—again rejected from just below 25K. This rejection triggered a sharp vertical fall, with a steep 35° downward slope, showing no pause, no VWAP reversion—just pure directional intent.
The downside breach hit multiple key levels:✅ 24,920✅ PDL✅ 24,882✅ 24,800–24,768 zone✅ and finally marked a low of 24,669, right at our 24,660 support level from yesterday’s map.
In yesterday’s report, we noted:
“A move below 24,882 could accelerate downside momentum. All eyes on 24,800 next.”✅ Targets 24,800 and 24,732 both achieved today.
🕯 Daily Time Frame Chart
🕯 Daily Candle Breakdown
Candle Type: Strong Bearish (near Marubozu)
Intraday Range: 340 points
Upper Wick: ~15 pts (negligible)
Lower Wick: ~44 pts (also insignificant vs range)
Candle Interpretation: Textbook bearish Marubozu-type (near full-body)
📉 Closing Concerns:
🔻 Below 24,732, the 0.618 Fib of May 15th candle
🔻 Below May 15 Open
❌ No retracement or end-of-day bounce
These signals point to a structurally weak close and increase the probability of further downside extension.
📊 Bias Going ForwardAs of today, there are no signs of buyers stepping in. If 24,670 (today's low) breaks, it could open the gates to test:
🧨 24,640–24,625 zone (watch closely during IB)
🧨 Below that → 24,535 / 24,500 / 24,480
On the upside, any pullback will face hurdles at:
🛑 24,768–24,800 (strong resistance zone)
🛑 24,882 / 24,920
Let the first half of tomorrow's session guide the tone. Any sustained hold above 24,800 might stall the fall. Else, the drift may continue.
🛡 25 Min Time Frame Chart
🛡 5 Min Intraday Chart
🛡 Gladiator Strategy Update
Strategy Parameters
ATR: 331.49
IB Range: 146.95 → 🟡 Medium IB
Market Structure: ⚖️ Balanced
Trade Highlights
🔻 1st Short Trigger: 11:55 – Trapped, Loss Booked
✅ 2nd Short Trigger: 12:45 – Target Achieved (Risk:Reward 1:3.5)
📊 Total Trades: 2
📍 Support & Resistance Levels
🟩 Resistance Zones:
24,768 ~ 24,800
24,882
24,920
24,980 ~ 25,000
25,062 ~ 25,070
🟥 Support Zones:
24,660
24,640 ~ 24,625
24,590
24,530 ~ 24,480
24,460
🔮 What’s Next?The market has broken key fib and candle support zones from the May 15th rally. If there's no defence early tomorrow, the fall may intensify.
Keep an eye on 24,640–24,625 during IB. Holding above could invite some short covering. But failure here can extend toward 24,500 and below.
🧠 Final ThoughtsThe market gave us what it hinted at yesterday—a fast break once 24,882 gave way. But with no bounce, no defence, and a full-body bear candle—the pressure is still on.
“Markets don't always roar before falling. Sometimes, they whisper, then collapse.”
✏️ DisclaimerThis is just my personal viewpoint. Always consult your financial advisor before taking any action.
NIFTY trade ideas

NIFTY 50 21.05 • The market is expected to open on a flat to mildly positive note, reflecting a subdued start in Asian markets. However, concerns remain due to significant FIIs outflows, with over ₹10,000 crore sold yesterday—one of the largest sell-offs since February 28, 2025—amid expectations of MSCI index rebalancing.
• Geo-political tensions in the Gulf region have driven crude oil prices above $66 per barrel, while uncertainty around an India–US trade agreement and a decline in US markets add to investor caution.
• The US market fell 0.4% yesterday, marking a pause after a six-day rally due to profit booking.
• European stocks rose for a fourth consecutive day, helped by renewable-energy stocks after US President Donald Trump lifted an order that halted construction on Equinor ASA’s $5 billion project off the coast of New York.
• UK, Germany and France Index gained up to 0.7%.
• Gift Nifty is trading marginally up.
• Results Today : ONGC, PFC, Mankind Pharma, RVNL, Colgate Palmolive, Oil India, Astral, National Aluminium, Ircon International.
Fundamental Pick: (Duration 1 Year)
Dixon Technology : Buy
(CMP 16566 TP 20500)
Technical View:
• NIFTY (Bearish - CMP: 24683) : Nifty immediate support is at 24550 then 24444 zones while resistance at 24850 then 25000 zones. Now till it holds below 24850 zones, profit booking could be seen towards 24550 then 24444 zones while hurdles can be seen at 24850 then 25000 zones.
• BANK NIFTY (Volatile - CMP : 54877) : Bank Nifty support is at 54500 then 54250 zones while resistance at 55250 then 55555 zones. Now it has to cross and hold 55000 zones for a bounce towards 55250 then 55555 zones while a hold below the same could see a further decline towards 54500 then 54250 levels.
Technical Idea:
GAIL : Buy
(CMP 191 SL 186 TGT 201)
Derivative View:
• Option Buying : Buy weekly Nifty 24650 Put till it holds below 24850 zones. Need to watch Bank Nifty 55000 zones for directional Option buying.
• Option Strategy : Nifty weekly Bear Put Spread (Buy 24700 PE and Sell 24500 PE) at net premium cost of 60-65 points. Bank Nifty Bull Call Spread (Buy 55200 CE and Sell 55700 CE) at net premium cost of 180-200 points.
• Option Writing : Sell weekly 24200 PE and 25300 CE with strict double SL. Sell Bank Nifty 53200 PE and 56800 CE with strict double SL.

#NIFTY Intraday Support and Resistance Levels - 21/05/2025Today will be flat opening expected in nifty. After opening if nifty sustain above 24750 level then expected upside movement upto 24950 level. This level will act as a strong resistance for today's session. Any upside rally can reversal from this level. Major downside expected if nifty starts trading below 24700 level. Downside 24500+ level expected in today's session.

NIFTYTommorow opening of nifty is very important. if open flat- Today's low (24916) is very important if any 5 mins candle closses below this level. First support will be near 24800.
if open gap up see a strong 5 min candle above 25000 will be pure buy point for near high.

Nifty : Riding Bullish Channel or Falling into Correction Zone?📊 Nifty 50 Daily Chart Analysis
**Chart Summary (as of May 13, 2025):**
1. **Index Price:**
Nifty 50 is trading around **24,683.90**, showing a significant drop of **-346.35 points (-1.39%)**.
2. **Trendlines:**
* A **long-term downtrend line** has been broken recently, indicating a **bullish breakout**.
* Post-breakout, the price formed an **ascending channel**, respecting higher highs and higher lows.
3. **Support & Resistance:**
* Strong support levels are observed at **22,792**, **21,880**, **20,262**, and **19,994**.
* Immediate resistance zone near **25,200–25,500**, where price is currently consolidating near the top channel line.
4. **Volume:**
* Volume shows increasing interest on bullish days and profit-booking near resistance.
* Recent red bars indicate **selling pressure**.
5. **Moving Average:**
* The **200-day SMA** is at **24,046**, and the price is well above it — a **bullish signal**.
6. **MACD (Momentum):**
* MACD is showing signs of **bullish crossover fade**, indicating that upward momentum may be cooling.
* Histogram bars are shrinking, suggesting a possible **reversal or consolidation**.
---

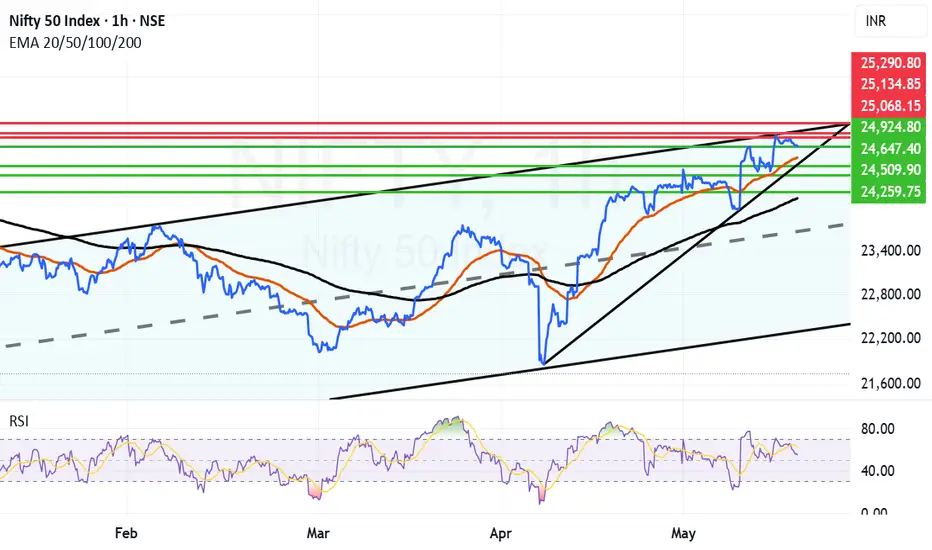
Multiple Resistances and Profit bookingMultiple resistances, trend line resistances are acting on Nifty and hampering it's progress. Also there is Profit booking seen across the board in all sectors. Additionally there is a new COVID scare that is spreading in China, Singapore and Hong Kong. These are the factors currently facing Nifty and not allowing it to fly above 25K levels and forcing it in downward spiral.
The resistances for Nifty remain now at: 25234, 25064, 24937, 24780, However we are entering into support zone now.
The supports for Nifty remain at: 24664, 24509, 24259, 23900 (Strong Mother line support of daily chart) and 23576 (Strong Father line support of daily chart).
To know more about importance of Father and Mother line supports and resistances read my book the Happy Candles Way to Wealth Creation. The book is available on Amazon in Paperback and Kindle Version. You can learn about Fundamental and Technical analysis from the book. The book also gives you knowledge about the art of Profit booking and novel ways of stock data analysis. Lot of reviewers consider it a hand book to investing in stock market. Everything is explained in simple jargon free language with examples of Cricket and day to day life which makes understanding of difficult investing concepts very easy. You will not regret buying the book that we can assure you.
As the multiple resistances were very strong this fall / correction / consolidation was bound to happen. As of now this should be seen as a regular market phenomenon only. Bear will become more active only if Father line support is broken. Bulls will become more active only when we get a closing above 25064. Above 25234 is a pure bull territory. Below 23576 is pure bear territory. Right now we are in no man's land.
Disclaimer: The above information is provided for educational purpose, analysis and paper trading only. Please don't treat this as a buy or sell recommendation for the stock or index. The Techno-Funda analysis is based on data that is more than 3 months old. Supports and Resistances are determined by historic past peaks and Valley in the chart. Many other indicators and patterns like EMA, RSI, MACD, Volumes, Fibonacci, parallel channel etc. use historic data which is 3 months or older cyclical points. There is no guarantee they will work in future as markets are highly volatile and swings in prices are also due to macro and micro factors based on actions taken by the company as well as region and global events. Equity investment is subject to risks. I or my clients or family members might have positions in the stocks that we mention in our educational posts. We will not be responsible for any Profit or loss that may occur due to any financial decision taken based on any data provided in this message. Do consult your investment advisor before taking any financial decisions. Stop losses should be an important part of any investment in equity.

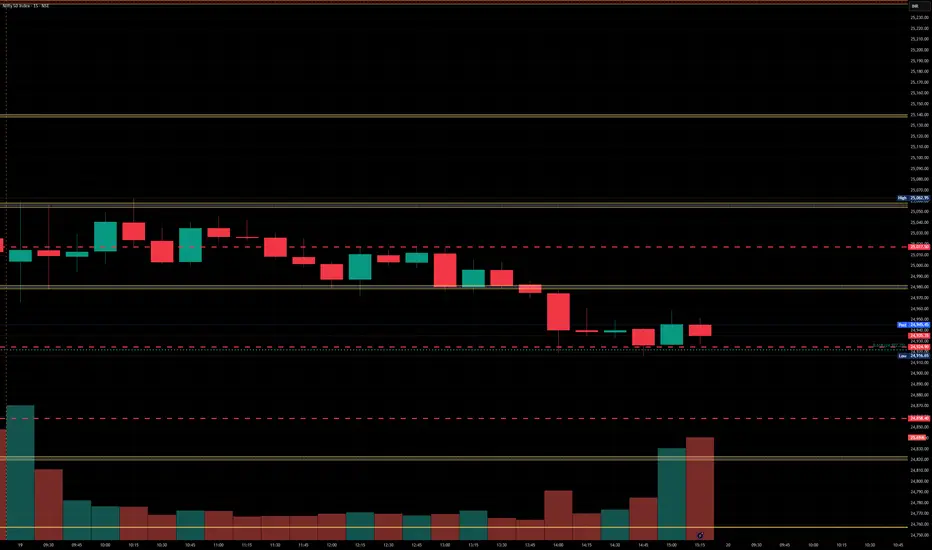
Nifty levels - May 21, 2025Nifty support and resistance levels are valuable tools for making informed trading decisions, specifically when combined with the analysis of 5-minute timeframe candlesticks and VWAP. By closely monitoring these levels and observing the price movements within this timeframe, traders can enhance the accuracy of their entry and exit points. It is important to bear in mind that support and resistance levels are not fixed, and they can change over time as market conditions evolve.
The dashed lines on the chart indicate the reaction levels, serving as additional points of significance to consider. Furthermore, take note of the response at the levels of the High, Low, and Close values from the day prior.
We hope you find this information beneficial in your trading endeavors.
* If you found the idea appealing, kindly tap the Boost icon located below the chart. We encourage you to share your thoughts and comments regarding it.
Wishing you success in your trading activities!

#NIFTY Intraday Support and Resistance Levels - 20/05/2025Flat opening expected in nifty in consolidation zone of 24950-25050 level. No major changes in yesterday's levels. Any strong rally only expected after breakout or breakdown of this zone. Upside bullish rally expected if nifty starts trading and sustain above 25050 level this upside rally can goes upto 25250+ level in today's session. Any major downside rally possible below 24950. Downside 24750 level will act as a strong support for today's session.

Nifty trend directionNifty 23935 has diverged volume Calls oi increased with puts decreases with falling price.fiis have sold 18000 contracts. Though all look bearishnes we suspect could be a trap for call sellers. 23958 will decide if today's drop a trap..

20 may Nifty50 important levels trading zone Nifty50 trading zone
#Nifty50 #option trading
99% working trading plan
👉Gap up open 25060 above & 15m hold after positive trade target 25170, 25333
👉Gap up open 25060 below 15 m not break upside after nigetive trade target 24880, 24663
👉Gap down open 24880 above 15m hold after positive trade target 25060, 25170
👉Gap down open 24880 below 15 m not break upside after nigetive trade target 24670,
Trade plan for education purpose I'm not responsible your trade
More education follow & support me

Nifty Still near the top of Parallel Channel. Nifty is consolidating near the top of the parallel channel and searching for momentum for getting a clear breakout. Till it regains the momentum and Mojo the upside looks limited. The current resistances it is facing is near 25068. Once we get a closing above the same there is possibility of some upside. In case we get a closing above 25068 the next resistances will be near 25134 and 25290. 25290 is the point above which we have a clear channel top Breakout. We will wait for that to happen for giving further resistances. The supports for Nifty are currently near 24924, 24761 (Mother Line Support of Hourly chart). If we get a closing below 24761 the bears will come back into the game and can drag the Nifty further towards the levels of 24647, 24509, 24259 or even 24162. 24162 is a Father line support of hourly chart. A closing below this levels can bring Bears in a total action mode. We will comment about further supports if by chance we get a closing below this level.
Disclaimer: The above information is provided for educational purpose, analysis and paper trading only. Please don't treat this as a buy or sell recommendation for the stock or index. The Techno-Funda analysis is based on data that is more than 3 months old. Supports and Resistances are determined by historic past peaks and Valley in the chart. Many other indicators and patterns like EMA, RSI, MACD, Volumes, Fibonacci, parallel channel etc. use historic data which is 3 months or older cyclical points. There is no guarantee they will work in future as markets are highly volatile and swings in prices are also due to macro and micro factors based on actions taken by the company as well as region and global events. Equity investment is subject to risks. I or my clients or family members might have positions in the stocks that we mention in our educational posts. We will not be responsible for any Profit or loss that may occur due to any financial decision taken based on any data provided in this message. Do consult your investment advisor before taking any financial decisions. Stop losses should be an important part of any investment in equity.
# nifty intraday As we can see a clear picture of bull flag pattan we can enter at its bottom or it's brakeout of bull flag

Nifty Analysis EOD – May 19, 2025 – Monday🟢 Nifty Analysis EOD – May 19, 2025 – Monday 🔴
Silence Before the Storm? A “Double Distribution” Kind of Day
📈 Nifty Summary
Another quiet yet deceptive start to the week as Nifty opened flat-to-negative (-14 points) but quickly formed a 92-point wide 5-minute candle at the open. That set the tone for the entire day—a tight, trapped market trading within this early range until post-2 PM.
Things got interesting later, as Nifty breached its IB Low, Previous Day Low (PDL), and closed decisively below key support zones, finally taking support near 24,920 (day’s low: 24,916.65).
The structure fits the classic textbook term—a “Double Distribution Day”, where the index transitions into a new value area in the second half. Option writers erased premiums on both sides, frustrating breakout traders and intraday scalpers alike.
25Min Time Frame Chart:
Daily Time Frame Chart:
🕯 Daily Candle Breakdown
Candle Type: Bearish with late-session breakdown
Day Type: 📘 Double Distribution Day
Key Breakdown Levels: IB Low, CDL, PDL
Support Held: 24,920 zone
🕵️♂️ Observation of the Day
Is this just a pause… or the calm before a storm?
Though there's no strong reversal signal yet, subtle clues emerge:
🔎 On the 25-minute chart, the 13:25 candle was the first to close below the 24,980–25,000 support zone.
📉 Post-PDL breakdown, the retracement attempt was shallow, and price remained under S1 and PDL levels, which hints at weak buying interest.
📊 Bias Going Forward
No reversal yet. Trend watchers should stay patient.
But given price action and weak retracements, the bias tilts toward a deeper retracement, possibly toward the 24,800 zone in the next session. Until strong bullish follow-through is seen, expect continued corrective movement.
5 Min Time Frame Chart:
🛡 Gladiator Strategy Update
Strategy Parameters
ATR: 330.48
IB Range: 92.9 → 🟠 Small IB
Market Structure: ⚖️ Balanced
Trade Highlights
⏰ 1st Short Trigger: 14:00
❌ Trade Timed Out → Loss Booked
📊 Total Trades: 1
📍 Support & Resistance Levels
🟩 Resistance Zones:
24,980 ~ 25,000
25,062 ~ 25,070
25,116 ~ 25,128
25,180 ~ 25,212
25,285
25,399
25,485 ~ 25,511
🟥 Support Zones:
24,920
24,882
24,800 ~ 24,768
24,660
24,590
24,530 ~ 24,480
🔮 What’s Next?
No storm yet, but the structure is weakening quietly. Until the bulls reclaim 25,000 decisively, the short-term path of least resistance appears lower.
A move below 24,882 could accelerate downside momentum. All eyes on 24,800 next.
🧠 Final Thoughts
Markets aren’t always noisy when they turn. Watch the subtle signs. For now, retracement bias stays—but don’t front-run reversals.
“Strong trends may pause quietly. It’s the silence that often precedes the sharpest moves.”
✏️ Disclaimer
This is just my personal viewpoint. Always consult your financial advisor before taking any action.

Nfty levels - May 20, 2025Nifty support and resistance levels are valuable tools for making informed trading decisions, specifically when combined with the analysis of 5-minute timeframe candlesticks and VWAP. By closely monitoring these levels and observing the price movements within this timeframe, traders can enhance the accuracy of their entry and exit points. It is important to bear in mind that support and resistance levels are not fixed, and they can change over time as market conditions evolve.
The dashed lines on the chart indicate the reaction levels, serving as additional points of significance to consider. Furthermore, take note of the response at the levels of the High, Low, and Close values from the day prior.
We hope you find this information beneficial in your trading endeavors.
* If you found the idea appealing, kindly tap the Boost icon located below the chart. We encourage you to share your thoughts and comments regarding it.
Wishing you success in your trading activities!
NIFTY Shorting OpprtunityNIFTY seems to be setting up for a short reversal trade.
Lower High has been established.
RELIANCE seems to be the main contributor to this.
A potential target of 24,750 is likely in the next couple of days.
P.S. Not a recommendation. Pls do your own due diligence.

#NIFTY Intraday Support and Resistance Levels - 19/05/2025Flat opening expected in nifty in consolidation zone of 24950-25050 level. Any strong rally only expected after breakout or breakdown of this zone. Upside bullish rally expected if nifty starts trading and sustain above 25050 level this upside rally can goes upto 25250+ level in today's session. Any major downside rally possible below 24950. Downside 24750 level will act as a strong support for today's session.

"Nifty 50 Near Resistance: Wedge Signals Reversal or Breakout"1. Trend Channel: The index is moving within a well-defined **upward sloping channel**, marked by two parallel purple trendlines.
* Price is currently hovering near the **upper boundary** of the broader ascending channel — a potential area for either breakout or rejection.
2. Short-Term Rising Wedge: A narrow rising wedge is visible (formed with tighter converging trendlines in the last few candles).
* Rising wedges are generally considered bearish reversal patterns, especially near resistance zones, suggesting potential for a pullback.
3. Resistance Levels: 25,031.30 : Immediate resistance (recent high & wedge upper boundary). A breakout above this could lead to a strong bullish continuation.
Upper channel trendline: Around 25,050–25,100 zone — further confluence resistance.
4. Support Levels: 24,982.55 Near-term support (bottom of the wedge structure). A breakdown below this level confirms wedge breakdown.
24,767.50 : Strong horizontal support from prior consolidation zone.
24,561.90, 24,407.75, and 24,272.20 : Sequential key support levels for downside targets if a breakdown accelerates.
**Volume Analysis:**
1. Volume Spike seen during the recent bullish candles, indicating strong buying interest. However, during the formation of the wedge, volume has declined, signaling weakening momentum— a typical precursor to a breakout or breakdown.
Possible Scenarios:
Bullish Scenario:
Break above 25,031.30 with volume could initiate a **fresh leg of uptrend**, possibly targeting the upper end of the channel (\~25,100+).
Bearish Scenario:
Breakdown below 24,982.55 from the wedge pattern could trigger a **short-term correction**, with immediate targets at 24,767.50 and 24,561.90.
The bearish divergence between price action and declining volume further supports this view.

#nifty fo intraday We can see a clear picture of bull flag pattan wate for brake out of upwards and we can have a long side posing for target 1 and target 2

18.5.25 NIFTY Bullish18.5.25
NIFTY
CMP: 25019.80
BUY Above: 25120
Sl: 24494
Tgt: 25116 / 26275
I am not SEBI registered analyst. Views expressed here are for educational purposes only. Please consult your professional financial advisor before investing. We are not responsible for your profits / gains if any.

NIFTY50.....New target-area ahead!Hello Traders,
the NIFTY50 has advanced to 25116.25 on Friday! This was week's high. So, my expectation was wrong! Instead, the index rallied to the new multi week's high.
Chart analysis:
The level of 24973.80 was wave one (red) ( of v (blue), the correction after wave 2 of v, same degree. The coming move probably should start wave 3 (red) of 5 (blue). One possible target, if so to come, it's around the 27853 range, ± some points.
Any corrective setbacks that still end above 23847 makes the count not invalid!
But, as before! Once a trend has been established, the focus is to the upside in this case.
So the new level for a wave ((iii) of v (blue) is around 27853 area.
Have a great Sunday.....
Ruebennase
Please ask or comment as appropriate.
Trade on this analysis at your own risk.

19thMay nifty important levels trading zone #Nifty50 #option trading
🚀 If you like my trading plan and levels, don't forget to boost the post
99% working trading plan
👉Gap up open 25170 above & 15m hold after positive trade target 25383, 25712
👉Gap up open 25170 below 15m not break upside after nigetive trade target 24670 , 24390
👉Gap down open 24916 above 15m hold after positive trade target 25170, 25383
👉Gap down open 24916 below 15m not break upside after nigetive trade target 24670, 24390
📌 Trade plan for education purpose I'm not responsible your trade
More education follow social media and boost my idea
📌 koi bhi trade leval se 20 point ke sl ke bhina karan nahi hi
📌 koi trade app activate tabhi karana hota hi level pe 2 candle uper ya niche closing aati hai to
📌 leval par Ane pe turant trade plan na kare ...
📌 Full risk apaki hi hi meri nahi

Weekly Market Wrap: Nifty Surges Past 25,000 – What's Next? The Nifty 50 index closed the week at 25,019, posting an impressive 1,000-point rally from the previous week’s close. The index made a high of 25,116 and a low of 24,378. The rally was driven by short covering and a surprise truce between India and Pakistan, which injected a wave of optimism into the market.
More importantly, Nifty broke out of the consolidation range of 23,200–24,600, closing strong above the psychologically significant 25,000 mark – a clear sign of bullish sentiment.
What to Expect Next Week (Outlook May 20–24)
Expected Range: 24,450 – 25,600
A breakout above 25,600 could open the doors for a retest of the all-time high (ATH) at 26,277.
As long as Nifty trades above 23,800, the broader trend remains intact.
Monthly Chart Patterns to Watch
A bullish "W" pattern could be forming, which ideally would require a pullback from current levels before resuming upward.
On the flip side, a bearish "M" pattern may emerge if the index tests ATH and faces rejection, which could trigger a sharp correction of 2,500–2,600 points.
For now, I remain cautious until the monthly time frame confirms a clear bullish breakout.
Global Markets Check: S&P 500 Eyes Key Resistance
The S&P 500 closed at 5,958, gaining 300 points week-on-week. As anticipated, a breakout above 5,770 propelled the index to meet all short-term targets of 5,821 / 5,850 / 5,900.
Key Level to Watch: 6,013
This is a major Fibonacci resistance — the same level where the market started correcting back on March 3, 2025.
A weekly close above 6,013 would be bullish, potentially triggering rallies toward 6,091 / 6,142 / 6,225.
However, a breakdown below this week’s low of 5,786 would confirm a failed breakout, with downside targets at 5,637 / 5,551 / 5,458.
Momentum traders, get ready – sharp moves are coming either way!

Nifty analysis as of 18/05/2025Nifty analysis as of 18/05/2025
nifty analysis banknifty analysis levels etc etc
dji nasdaq stocks
