Nifty levels for 19/05/2025📊 Key Levels:
Support Levels (Blue Lines):
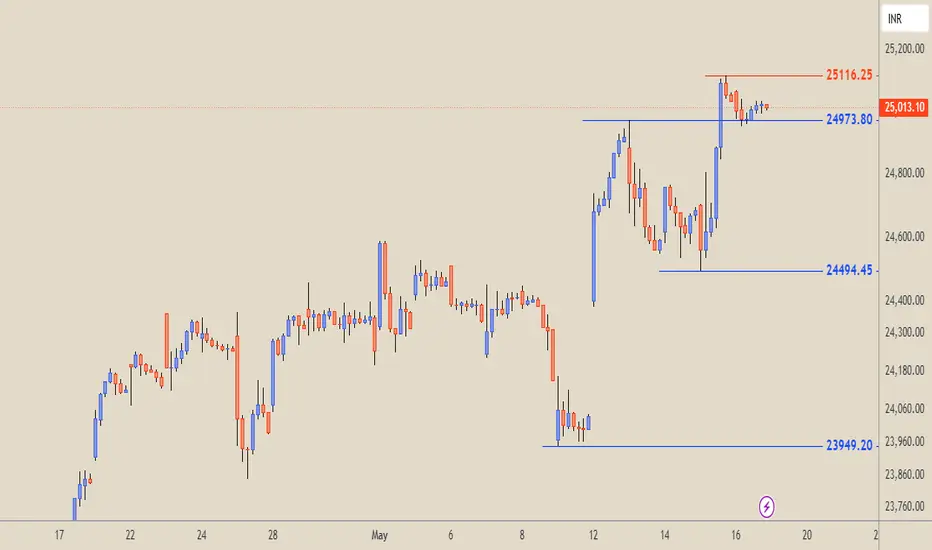
₹24,973.80 → Nearest immediate support
₹24,494.45 → Intermediate support
₹23,949.20 → Strong lower support / Demand zone
Resistance Levels (Red Lines):
₹25,116.25 → Immediate resistance (near consolidation zone)
₹26,277.35 → Major resistance (previous swing high)
🔄 Trend & Price Action:
Recent Trend: Strong bullish rally from the low near ₹23,949.20 to above ₹25,000.
Current Phase: Price is consolidating right below the ₹25,116.25 resistance after a strong bullish impulse (potential bullish flag or continuation pattern).
📌 Technical Insights:
✅ Bullish Signals:
Price made a higher low at ₹23,949.20, followed by a higher high.
Clear impulsive structure from May 13–16.
Consolidation just below resistance hints at potential breakout continuation.
Support level at ₹24,973.80 is holding price above.
⚠️ Bearish Risks:
Failure to break above ₹25,116.25 may lead to a retest of ₹24,494.45.
If price drops below ₹24,494.45, it may test the demand zone near ₹23,949.20.
Overhead resistance at ₹26,277.35 and long-term barrier at ₹25,791.70 can cap upside if breakout occurs.
🔔 Trading Implications:
Bullish Bias: On breakout above ₹25,116.25 with target towards ₹25,791.70 and ₹26,277.35.
Bearish Scenario: Breakdown below ₹24,973.80 can target ₹24,494.45 and ₹23,949.20.
NIFTY trade ideas
nifty Wave5 in progressin the weekly chart Nifty is clearly showing wave5 in progress...if this view holds,it is likely to surpass its previous high 0f 26000 plus ...

Upward momentum of Nifty may pause and consolidate in this rangeUpward momentum of Nifty may pause and consolidate in this range

Nifty Analysis EOD – May 16, 2025 – Friday🟢 Nifty Analysis EOD – May 16, 2025 – Friday 🔴
Nifty Took a Breather After a Big Bullish Day
📈 Nifty Summary
As anticipated, after Thursday’s strong breakout and euphoric rally, Nifty paused for breath today. Despite Gift Nifty indicating a 75+ point gap-up, the actual open was flat, hinting that global cues couldn't ignite further momentum.
From the start, the tone was set for a retracement-style session—every intraday rise met with selling, while dips around 24,980 continued attracting buyers, keeping the structure range-bound but supported.
The most notable observation: today’s low aligned with the 23.8% Fibonacci retracement of yesterday’s candle, which shows bulls are still in control and defending key levels. However, the recovery from the day’s low couldn’t break past the 50% retracement of the same range—signalling hesitation and exhaustion in the short term.
📊 Intraday Walk
🟢 Flat open despite positive Gift Nifty cues
⚖️ Mean-reverting price action throughout
🧲 Buying seen repeatedly near 24,980
❗Rejection seen around 50% retracement of the previous day’s candle
🔚 Closed mildly negative; a pause, not panic
🕯 Daily Candle Breakdown
Candle Type: Small-bodied candle (Doji-ish) indicating indecision
Range: Tight and narrow (117 Points) session
Key Observation: Low held above 23.8% retracement of May 15 candle
What it Implies: Bulls still holding ground, but upside conviction lacking
🎯 Gladiator Strategy Update
Strategy Parameters
ATR: 350.94
IB Range: 94.2 → ✂️ Small IB
Market Structure: ⚖️ Balanced
Trade Highlights
⚠️ 1st Short Trigger: 11:05 → No Entry Initiated
💼 Total Trades: 0
📍 Support & Resistance Levels
🟩 Resistance Zones:
25,116 ~ 25,128
25,180 ~ 25,212
25,285
25,399
25,485 ~ 25,511
🟥 Support Zones:
25,000 ~ 24,980
24,882
24,800 ~ 24,768
24,730
24,660
24,590
24,530 ~ 24,480
🔮 What’s Next?
Today was a classic breather candle after a strong impulse. If Monday opens bullish and crosses above 25,070, we could see a continuation of the uptrend. But a close below 24,950 may be the first red flag for bulls.
🧠 Final Thoughts
Markets don't rise in a straight line. Today was a healthy pause—a base-building day. As long as 24,980 holds, the bulls have the upper hand.
“A pause in trend isn’t weakness—it’s preparation.”
✏️ Disclaimer
This is just my personal viewpoint. Always consult your financial advisor before taking any action.

Nifty levels - May 19, 2025Nifty support and resistance levels are valuable tools for making informed trading decisions, specifically when combined with the analysis of 5-minute timeframe candlesticks and VWAP. By closely monitoring these levels and observing the price movements within this timeframe, traders can enhance the accuracy of their entry and exit points. It is important to bear in mind that support and resistance levels are not fixed, and they can change over time as market conditions evolve.
The dashed lines on the chart indicate the reaction levels, serving as additional points of significance to consider. Furthermore, take note of the response at the levels of the High, Low, and Close values from the day prior.
We hope you find this information beneficial in your trading endeavors.
* If you found the idea appealing, kindly tap the Boost icon located below the chart. We encourage you to share your thoughts and comments regarding it.
Wishing you success in your trading activities!

Nifty breakout from falling wedge patternNifty 25006 has breakout from falling wedge pattern. Volume supports the breakout. Expeting 25090 target

A huge profit booking at 25000 leveltoday 5/16/2025 market Open above 2500 and see sharp falling with More Then 7 times average volume come in just 5 Minutes clearly sign of profit Booking or smart Money Offload their position we expect to come at 24800 in just few days.

#NIFTY Intraday Support and Resistance Levels - 16/05/2025Gap up opening expected in nifty near 25200 level. After opening if nifty starts trading above 25300 level then expected strong further upside rally towards the 25500+ level. Any reversal only expected from 25250 level. Downside 25050 level will act as a strong support for today's session.

"Nifty 50 - 1st Level 24487.28 hit posted on 26th April" The levels mentioned in the previous chart is still intact-26th April.
Here are the inter-mediate levels for the next week or so. Will India-Pakistan war a spoilsport for the upside levels or will the markets surprise you? can we expect 1000 pts or 2000 pts swing? can be any direction.
Let's watch out for these levels:
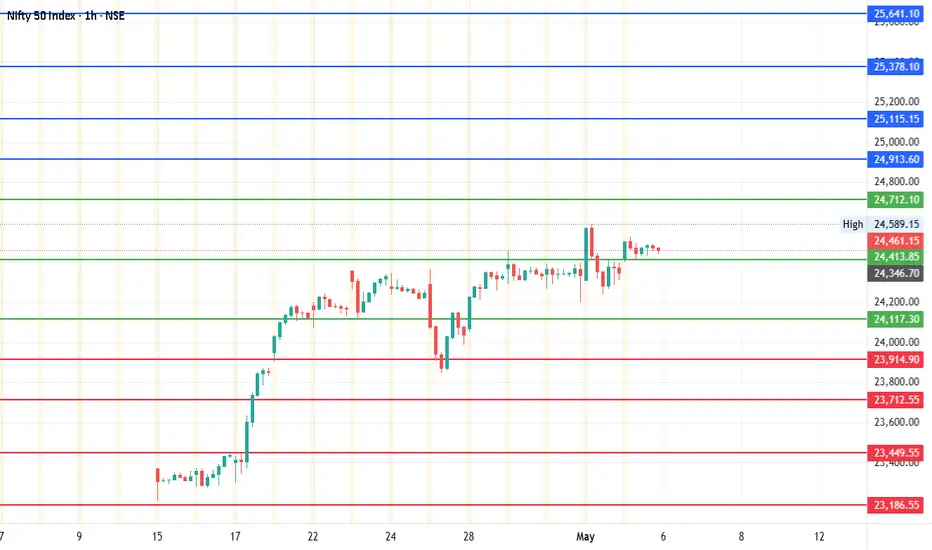
Current Price: 24,461.15
Mid-point: 24413.83
Upside: 24913.61, 25115.13, 25378.11 and 25641.10
Downside: 23914.92, 23712.53, 23449.54 and 23186.55
Resistance: 24712.10
Stop loss: 24117.31
Nifty trend directionNifty 25062 has hit the channel resistance and cooled off.
24980 would decide if nifty could move higher
If break down, we expect it will move to its support zone 24560-24480

NIFTY Resumes Its Bullish TrendHello traders! Today we will talk about an Indian stock market exchange NIFTY 50, as we see nice and clean pattern from technical and Elliott wave perspective.
As you can see, NIFTY is in an impulsive bullish rise on the weekly basis, which looks like a higher degree wave 3 of an ongoing five-wave bullish impulse by Elliott wave theory.
After recent corrective slowdown in subwave (4), which perfectly tested channel support line and 38,2% Fibonacci retracement, we can now see it extending even higher, ideally for subwave (5) of a higher degree wave 3 that can push the price even up to 28k-30k area this year, just watch out on short-term pullbacks.

Major Breakout For Nifty But a Lot of Resistances Await.We saw a major Breakout for Nifty today but there are a few resistances ahead of us. Three things could happen now:
1) Nifty Rampages ahead towards 26K If the Bull Rally has real substance.
2) We might see some consolidation in this range and and after consolidating, Nifty retesting some important support the rally begins again.
3) Bears That are trapped throw a counter punch.
Scenario 1) Nifty has some resistance ahead near 25116 and 25221. We already hit 25116 and then closed at 25062. But if these 2 resistances are cleared and we get a closing above them Nifty can move swiftly towards 25352, 25453, 25662, 25882 and then regain 26K+ levels.
Scenario 2) As the Nifty has been rampaging ahead post ceasefire news there is practically need of a consolidation here. If Nifty chooses Consolidation then it may come down to test the bottom and the supports from where it can launch again remain at 24864, 24525, 24369 and then Mother and Father Line supports at 23775 and 23536 respectively.
Scenario 3) Bears who are trapped badly with the shorts can also throw a counter punch. This punch however will be effective only if we get a closing below 23536. In such a scenario Bears can pull back the Nifty towards 23942, 23401, 22805 or even 22K levels. (This however looking at the momentum looks less likely but you can never say never in stock market.)
Disclaimer: The above information is provided for educational purpose, analysis and paper trading only. Please don't treat this as a buy or sell recommendation for the stock or index. The Techno-Funda analysis is based on data that is more than 3 months old. Supports and Resistances are determined by historic past peaks and Valley in the chart. Many other indicators and patterns like EMA, RSI, MACD, Volumes, Fibonacci, parallel channel etc. use historic data which is 3 months or older cyclical points. There is no guarantee they will work in future as markets are highly volatile and swings in prices are also due to macro and micro factors based on actions taken by the company as well as region and global events. Equity investment is subject to risks. I or my clients or family members might have positions in the stocks that we mention in our educational posts. We will not be responsible for any Profit or loss that may occur due to any financial decision taken based on any data provided in this message. Do consult your investment advisor before taking any financial decisions. Stop losses should be an important part of any investment in equity.

Nifty Analysis EOD - May 15, 2025 - Thursday🟢 Nifty Analysis EOD - May 15, 2025 - Thursday 🔴
Heart-Throbbing Wild Weekly Expiry by Nifty
📈 Nifty Summary
What a day! In yesterday’s report, we highlighted the potential for breakout on both sides—and Nifty said, “Why choose one? Have both!”
Opening with a modest gap-up of 28 points at 24,694, the index wasted no time and took a sharp dive, breaching the Previous Day Low (PDL) and hitting 24,494. This test of the 24,483–24,528 support zone sparked an immediate V-shaped recovery.
By 10:30 AM, Nifty had reclaimed its mean level, and breaching 24,600 triggered short-covering that pushed it sharply toward PDH, which was taken out in just 10 minutes. A rumored update from Trump on a USA–India tariff deal (unverified but possible catalyst) might have played a role—though, as always, price is the final news.
However, within the next 30 minutes, Nifty wiped out all the gains, only to enter a consolidation phase until 1 PM. Then came the real action—another breakout above PDH with strong short-covering and fresh buying. The rally took Nifty to a fresh weekly high of 25,116, closing near the highs at 25,035.
This wasn’t a regular expiry. This was a thriller.
📊 Intraday Walk
📉 Breach of PDL to form 24,494 low
🧲 V-shaped recovery from 24,500 zone
🚀 24,600 breakout triggers short-covering to PDH
⚡ Spike to PDH wiped out → range-bound for 2 hours
🟢 1 PM breakout → new weekly high 25,116
🔚 Closed at 25,035, a solid 341-point day
🕯 Daily Candle Breakdown
Candle Type: Bullish Marubozu-like Engulfing
Range: ~622 points
Key Observation: Engulfed previous two candles and broke 12th May’s high & close
What it Implies: Strong bullish momentum, signs of sustained short-covering
🎯 Gladiator Strategy Update
Strategy Parameters
ATR: 376.94
IB Range: 212.3 → 📏 Medium IB
Market Structure: ⚖️ Balanced
Trade Highlights
✅ 1st Long Trigger: 13:05
🎯 Target Achieved: 1:4 Risk-Reward
💼 Total Trades: 1
📍 Support & Resistance Levels
🟩 Resistance Zones:
25,116 ~ 25,128
25,180 ~ 25,212
25,285
25,399
25,485 ~ 25,511
🟥 Support Zones:
25,000 ~ 24,980
24,882
24,800 ~ 24,768
24,730
24,660
24,590
24,530 ~ 24,480
🧠 Final Thoughts
The Nested Inside Bar setup we spoke of yesterday? It delivered. Clean breakdown of PDL without triggering trade saved us from a trap, while the PDH breakout delivered a 1:4 reward—textbook price action setup. With a strong bullish engulfing on the daily, expect continued strength with dips being bought.
“When the market offers clarity, act. When it offers confusion, observe.” — Stay nimble.
✏️ Disclaimer
This is just my personal viewpoint. Always consult your financial advisor before taking any action.

Nifty : Flying high after a disappearance of a Red band resistan
Nifty : Flying high after a disappearance of a Red band resistance.
Still in a Buy trajectory,
( Not a Buy / Sell Recommendation
Do your own due diligence ,Market is subject to risks, This is my own view and for learning only .)

NIFTY 50 - Elliott Wave 5 Completion (Gap Confirmation Awaited )📝 Analysis:
The Nifty 50 index has shown classic Elliott Wave behavior, with clear 5-wave structure completion observed on multiple timeframes.
🟢 90-minute Chart (Left Panel):
A full 5-wave Elliott structure is marked.
Price has completed wave 5, indicating potential exhaustion.
Oscillator shows momentum weakening with a potential bearish divergence developing.
Immediate downside correction zone is highlighted near ₹23,800.
🟠 15-minute Chart (Right Panel):
Expanding wave 4-5 move is observed.
Within the larger 4-5 wave, a smaller degree internal 5-wave uptrend has completed.
Negative divergence confirmed on histogram indicator, suggesting potential reversal or exhaustion.
The last leg (5th wave within 5) indicates aggressive short covering, often preceding exhaustion gaps.
📊 Key Trigger for Next Move:
Next day Gap Up (Exhaustion Gap) or Gap Down (Breakaway Gap) will be crucial.
Gap Up without follow-through indicates up-move halt → potential reversal.
Gap Down will confirm halt of up-move → initiate corrective decline towards ₹23,800.
Watch for candlestick confirmation post-gap.
🎯 Targets & Levels to Watch:
Immediate support: ₹23,800
Breakdown below this level could trigger deeper retracement.
Upside is limited unless fresh breakout sustains above current highs with volume.
⚠️ Risk Management:
Ideal to wait for GAP confirmation (opening tick next day).
Strict stop-loss if shorting should be placed above wave 5 high.
Avoid pre-emptive shorts without confirmation.
🟡 Disclaimer:
This analysis is for educational purposes only and should not be construed as financial advice. Please consult your financial advisor before taking any investment or trading decision. Markets are subject to high risks.

Nifty levels - May 16, 2025Nifty support and resistance levels are valuable tools for making informed trading decisions, specifically when combined with the analysis of 5-minute timeframe candlesticks and VWAP. By closely monitoring these levels and observing the price movements within this timeframe, traders can enhance the accuracy of their entry and exit points. It is important to bear in mind that support and resistance levels are not fixed, and they can change over time as market conditions evolve.
The dashed lines on the chart indicate the reaction levels, serving as additional points of significance to consider. Furthermore, take note of the response at the levels of the High, Low, and Close values from the day prior.
We hope you find this information beneficial in your trading endeavors.
* If you found the idea appealing, kindly tap the Boost icon located below the chart. We encourage you to share your thoughts and comments regarding it.
Wishing you success in your trading activities!

Nifty Breakout Real or FakeToday 15/05/2025 Nifty completed it trend reversal triple bottom and gave breakout 24800 level with volume today if it sustain & close above 24800 then no doubt it will continues to upward journey if not and come below then it will again come to Range between 24500-24800, in fact, if breakout is real so it must be respect this new support area 24700-24800 you can see on chart.

NIFTY ON SALE SALE SALENifty is in the making of inverse head n shoulder pattern on daily charts.
Risk:Reward = 1:20
Could bought here with closing basis stoploss below 21775 & target is almost 2000 points from here.
Not to b missed level.

Nifty50 Breaks Out of Inverse Head & Shoulders — Bullish Nifty50 has confirmed a breakout above the Neckline of a well-formed Inverse Head & Shoulders pattern, which typically signals a bullish trend reversal. The breakout has occurred near 24,600–24,700, with strong green candles and increasing momentum.
• Left Shoulder: Around 22,250
• Head: Bottomed near 21,000
• Right Shoulder: Around 22,500
• Neckline Breakout Zone: ~24,100 to 24,300 (broken)
• Live Price: ~24,644 (as of now)
Disclaimer:
यह विश्लेषण केवल शैक्षणिक उद्देश्य के लिए है। यह किसी भी प्रकार की निवेश सलाह नहीं है। निवेश करने से पहले अपने वित्तीय सलाहकार से परामर्श अवश्य करें। स्टॉप लॉस का पालन अनिवार्य है। मार्केट में पूंजी जोखिम हमेशा होता है।

#NIFTY Intraday Support and Resistance Levels - 15/05/2025Gap up opening expected in nifty near 24750 level. After opening if nifty starts trading and sustain above this level then expected upside movement upto 24950 level. Below 24700 level there will be downside expected upto 24550. 24550 level will act as a strong and important support for nifty. Any major downside only expected below this support level.

Nifty 50Current Price: 24039.35
Mid-Point: 24106.65
Upside: 24487.28 & 25141.85 & 25918.25
Downside: 23728.61 & 23071.45 & 22295.05

Nifty Analysis EOD - May 14, 2025 - Wednesday🟢 Nifty Analysis EOD - May 14, 2025 - Wednesday 🔴
Day Ends with Directional Uncertainty from Nifty
🔍 Nifty Summary
Nifty opened with a 35-point gap-up, displaying early strength by slowly climbing toward 24,747, which aligned with the critical resistance zone of 24,768–24,800 and the CPR top. But that’s where the rally halted.
From the day’s high, it reversed lower, testing both the Previous Day Low (PDL) and Previous Week High (PWH). Interestingly, the index took support there and managed to close right at the CPR, underlining indecision.
The day was marked by broad consolidation within a 232-point range, with no strong directional follow-through. Price stayed majorly around the CPR zone, signaling a range-bound session with underlying uncertainty.
🕵️ Intraday Walk
☀️ Opened with 35-point gap-up; gradually climbed to 24,747.
🚫 Hit resistance at 24,768–24,800 and reversed.
🔽 Fell to test PDL and PWH zone (24535 area).
🛑 Found support and bounced back to close at CPR.
🔄 A day filled with range-bound movement and no clear trend.
📏 Inside Bar Pattern Watch (Daily Chart)
A 3-day Inside Bar Structure is forming:
📅 May 12: Mother Candle
📅 May 13: Baby candle (ignore 29-point upper wick)
📅 May 14 (Today): Another baby candle within May 13 (ignore 12-point lower wick)
This nested inside bar scenario could trigger a directional breakout soon.
🔼 Upside Levels:
If today’s high (24,767) breaks:Target Zones: 24,800 → 24,882 → 24,940
🔽 Downside Levels:
If today’s low (24,535) breaks:Target Zones: 24,480 → 24,400 → 24,365 → 24,330
🔎 Key Fib Observations
📏 Today’s high (24,747) = ~50% retracement of May 13’s candle → signals rise-on-sell tone
📉 Today’s close (24,640) = ~50% retracement of today’s candle → neutral-to-positive bias
These confluences reflect a tug-of-war between bulls and bears, waiting for a breakout.
🕯 Daily Candle Breakdown
Candle Type: Small-bodied candle inside previous day’s range
Today’s OHLC:▫️ Open: 24,613.80▫️ High: 24,767.55▫️ Low: 24,535.55▫️ Close: 24,666.90 (▲+88.55 / +0.36%)
🔍 Key Observations:
⚠️ No directional expansion, despite higher high & low
✅ Inside bar formation continues
✅ Close at candle midpoint → Neutral, with slight positive bias
📊 Sign of energy build-up for a potential breakout
🛡 Gladiator Strategy Update
Strategy Parameters
ATR: 349.73
IB Range: 169.70 → 📏 Medium IB
Market Structure: ⚖️ Balanced
Trade Highlights
⚠️ No trade triggered
💼 Total Trades: 0
🔢 Support & Resistance Levels
🟩 Resistance Zones:
24,730
24,768 ~ 24,800
24,882
24,980 ~ 25,000
25,100 ~ 25,128
25,180 ~ 25,212
🟥 Support Zones:
24,882
24,800 ~ 24,768
24,730
24,660
24,590
24,530 ~ 24,480
24,461
24,420 ~ 24,400
24,365 ~ 24,330
24,245 ~ 24,240
🔮 What’s Next?
A 3-day Inside Bar Formation generally signals a volatility contraction phase. The tighter the coil, the stronger the potential breakout.
If 24,767 breaks, bulls might regain momentum.If 24,535 fails, we may retest deeper supports from 24,480 downward.
📌 Patience over prediction — let the range resolve.
💬 Final Thoughts
“Inside bars are calm before the storm. Stay alert — breakout decides the next play.”
✏️ DisclaimerThis is just my personal viewpoint. Always consult your financial advisor before taking any action.

Nifty back to bull controllhi Traders,
Weekly the swing had a correction of 38%.
The daily time frame's Inverted H&S pattern is a confirmation of the trend change(from correction to impulse wave)
Nifty 50 will make a move from 500 to 1500 points till the previous high of the weekly swing.
The targets are mentioned in the chat.
As we have 14days to expiry, there is enough time to hit target 1. Interested traders buy ATM CALL option or FUTURES
sbull.co
