Brahmos Candle took off today. The situation was delicate on Friday but weekend brought a news that was favorable for the market. The news related to Ceasefire always helps the business and give a relief to the investors. We are yet to see how things shape up when the 'war of fog' disperses but things are coming back on track it seems as of now. Trade talks between US and China are also yielding some positive vibes. Thus the market today took off like a BRAHMOS Missile and had given one of the strongest candles which is very rare to see. Things are looking very bullish as of now if everything remains calm.
The Nifty supports right now seem to be near 24802, 24621 (Trend line Support) 24361, 23849, 23648 (Mother line on Daily chart) and 23498 (Father line on Daily chart).
The Nifty Resistances right now seem to be near 24944, 25062, 25245, 25505 and 25772. Once we close above 25772 if everything remain positive we can think of regaining even 26K levels and going deeper just like our missiles. But before we reach the Euphoria zone there are a lot of resistances to be crossed.
Shadow of the candle is Bullish however there can be chances of Profit booking as well where investors can tend to take their short / medium term profit.
Disclaimer: The above information is provided for educational purpose, analysis and paper trading only. Please don't treat this as a buy or sell recommendation for the stock or index. The Techno-Funda analysis is based on data that is more than 3 months old. Supports and Resistances are determined by historic past peaks and Valley in the chart. Many other indicators and patterns like EMA, RSI, MACD, Volumes, Fibonacci, parallel channel etc. use historic data which is 3 months or older cyclical points. There is no guarantee they will work in future as markets are highly volatile and swings in prices are also due to macro and micro factors based on actions taken by the company as well as region and global events. Equity investment is subject to risks. I or my clients or family members might have positions in the stocks that we mention in our educational posts. We will not be responsible for any Profit or loss that may occur due to any financial decision taken based on any data provided in this message. Do consult your investment advisor before taking any financial decisions. Stop losses should be an important part of any investment in equity.
NIFTY trade ideas

Nifty Analysis EOD - May 12, 2025 - Monday🟢 Nifty Analysis EOD - May 12, 2025 - Monday 🔴
🚀 Peace Talks & Policy Push – Bulls Break Chains, Nifty Soars to New Heights!
Opening Mood:
Relief from geopolitical tension and global trade optimism lit a fire under the bulls—marking one of the most powerful sessions in recent weeks.
🧭 Nifty Summary:
Following positive developments—ceasefire between India and Pakistan and trade policy easing between China and the US—Gift Nifty signaled a sharp gap-up.
Nifty opened at 24,420 (▲ 412 points | 1.72%), jumping above multiple resistance levels: 24,400~24,420 and 24,365~24,300. The first 5-minute candle alone posted a 184-point rally—and from there, bulls never looked back.
By breaching the 24,800 resistance and making a new swing high at 24,944.80, the day stamped bullish dominance. The close just 20 points below the high reflects strong buying interest and minimal profit booking.
🕯️ Daily Candle Breakdown:
Today’s Candle: Bullish Marubozu (full-bodied, tiny/no wicks) — high conviction buying
Close: 24,924.60 (Near day’s high)
Key Observations:
✅ Breakout above 24,800 resistance
✅ Closed above 22nd Oct 2024 candle high — a key Head & Shoulder confirmation level
✅ Strong volume and price confirmation
🔜 Watch for follow-through above 24,700–24,800 zone
What It Implies:
Clear strength from bulls with no hesitation. If follow-through sustains, we could be heading toward a fresh leg of upside—likely to test the psychological 25,000 mark and beyond.
⚔️ Gladiator Strategy Update
Strategy Parameters:
ATR: 355.76
IB Range: 358.95 → Extreme Large IB
Market Structure: ImBalanced
Trade Highlights:
Total Trades: 1
✅ Long Trigger @ 12:25 PM → Target 1:3.5 Achieved
📈 Intraday Walk (5-Min View):
Opened strong above multiple resistance zones
First candle: explosive 184-point rally
Smooth rally continued with no major retracement
A new swing high formed at 24,944.80
Day closed just shy of the high—strength intact
🔍 Support & Resistance Levels
🔼 Resistance Zones:
24,980 ~ 25,000
25,100 ~ 25,128
25,180 ~ 25,212
🔽 Support Zones:
24,882
24,800 ~ 24,768
24,730
24,660
24,590
24,530 ~ 24,480
📌 Final Thoughts:
"Markets love clarity. With news-driven fear subsiding, technicals are taking charge again. Follow momentum—but don't chase it blindly."
✏️ Disclaimer
This is just my personal viewpoint. Always consult your financial advisor before taking any action.

NIFTY 50 - Multi-Timeframe Elliott Wave Analysis🧠 Chart Summary & Multi-Timeframe Elliott Wave Analysis
🔹 Chart 1 (Left – Weekly View):
Nifty completed an A-B-C corrective structure, where wave B has peaked. We now expect a long-term impulsive C wave downward, targeting below wave A’s low (~22,000).
🔹 Chart 2 (Middle – Daily Zoomed View):
This zoom-in decodes wave B as its own internal A-B-C structure, now seemingly completed. This implies that the recent rally was corrective and has likely ended.
🔹 Chart 3 (Right – 1 Hour View):
Here, we see the microstructure of wave C, forming a clear 5-wave impulsive pattern. Currently, Nifty appears to be topping out at wave 5, with weakening momentum.
🚨 Bearish Outlook Ahead:
Top formation expected at current levels, possibly with a double top or rising wedge.
Breakdown of local trendline or support will confirm the start of macro C wave.
Projected Target Zone: Below 22,000 (end of Wave A from Weekly Chart).
Watch for reversal candles + divergence confirmation for early entry.
⚠️ What to Watch:
1. Reversal patterns at the current resistance.
2. Breakdown confirmation on lower timeframes.
3. Manage stop losses strictly above recent swing highs.
Disclaimer:
This is a technical analysis-based view meant for educational purposes only. Please consult your financial advisor before taking any trading decision. Risk management is crucial — trade responsibly.

Nifty levels - May 13, 2025Nifty support and resistance levels are valuable tools for making informed trading decisions, specifically when combined with the analysis of 5-minute timeframe candlesticks and VWAP. By closely monitoring these levels and observing the price movements within this timeframe, traders can enhance the accuracy of their entry and exit points. It is important to bear in mind that support and resistance levels are not fixed, and they can change over time as market conditions evolve.
The dashed lines on the chart indicate the reaction levels, serving as additional points of significance to consider. Furthermore, take note of the response at the levels of the High, Low, and Close values from the day prior.
We hope you find this information beneficial in your trading endeavors.
* If you found the idea appealing, kindly tap the Boost icon located below the chart. We encourage you to share your thoughts and comments regarding it.
Wishing you success in your trading activities!

NIFTY POST MARKET ANALYSISNifty and five major sectorial constituents of Nifty analysis based on pure price action.
Try to show one calendar trade but it was not visible in the screen. Sharing you numbers here.
Current Calendar Spread Structure:
Long: 24000 PE – 31 July 2025
Short: 24000 PE – 27 June 2025
Net Debit: ₹88 per lot
Rationale:
The surge in India VIX indicates heightened market volatility, making this an opportune moment to implement a calendar spread strategy. The position benefits from time decay (positive Theta) and an increase in implied volatility (positive Vega), especially if the NIFTY remains around the 24,000 level.
Risk Management: Monitor NIFTY's movement closely. If it declines rapidly below 23500, the short put may become in-the-money, increasing risk. Two adjustment options we do have...
Adjustment Flexibility: Be prepared to roll the short put further out in time or to a different strike if market conditions change.

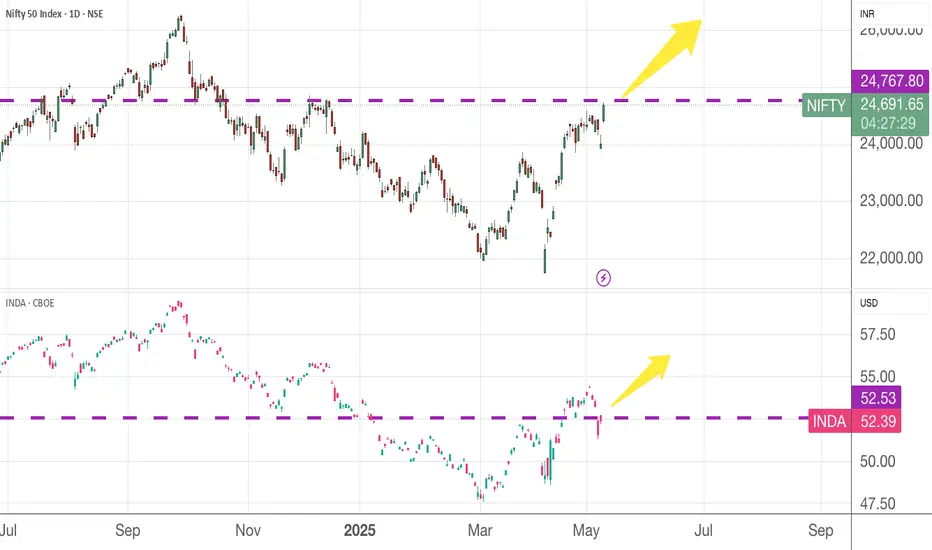
India is catching up, have this in your portfolioRead the latest news here
War is never good for the country except those who are selling military equipment to those countries. Look at Russia ETF.....
This ceasefire will benefit both countries but since I am vested in INDA ETF, this will be good news for me and time to accumulate more.
#NIFTY Intraday Support and Resistance Levels - 12/05/2025Gap up opening expected in nifty near 24500 level. After opening if nifty starts trading above 24550 level then expected this rally can extend upto 24750+ in today's session. Downside 24250 level will act as a strong support for today's session. Any downside movement can reversal from this level. Major downside only expected below 24200.

Nifty: Correction aheadNifty is likely to correct lower towards 23400-23000 zone before resuming up.

Will ceasefire result in another rally..?Following the agreements, we’ve agreed to ceasefire agreements which is both a win win situation for INDIA as it had both punished Pakistan and showed china levels of their air defence equipments hence we can expect NIFTY to strongly recover from here till the ceasefire is breached which could result in act of war and bloodshed of market so plan your trades accordingly.

Golden Rejection Candle Strategy–Catch Explosive Intraday Moves!Hello Trader!
Are you tired of buying options and watching premiums die slowly?
Or chasing breakouts that reverse the moment you enter?
Here’s your solution – the Golden Rejection Candle Strategy , designed especially for option buyers who want timed entries, fast momentum, and defined risk .
What is a Golden Rejection Candle?
A special candlestick that forms when price hits a strong level (like VWAP, trendline, or demand/supply zone) and gets instantly rejected.
It leaves behind a long wick (shadow), showing that buyers or sellers stepped in with force .
This candle often marks the start of a sharp intraday reversal .
It's not just a random wick — it’s a smart money footprint .
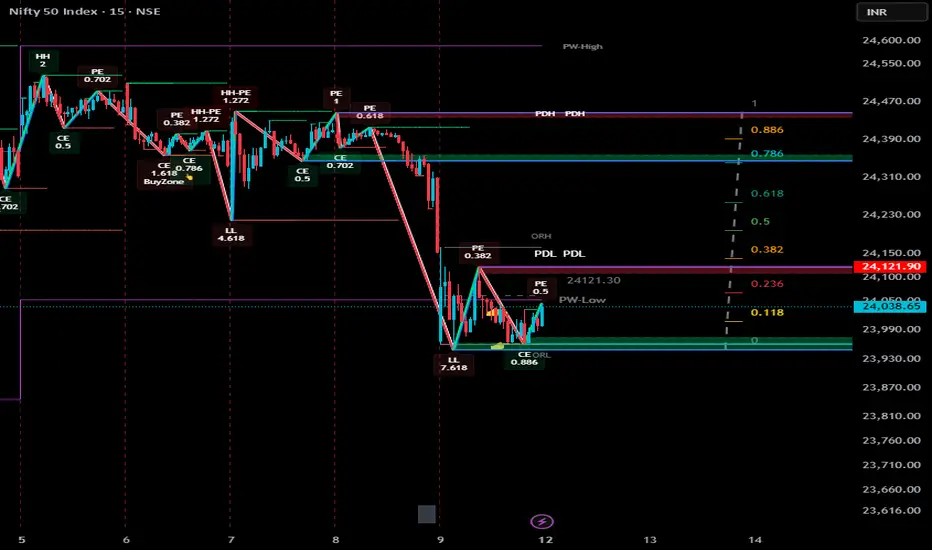
Live Chart Example – Nifty Spot vs Option Premium (23950 CE)
Date: 9th May 2025
Timeframe: 1 min (Spot), 1 min (Options)
Spot Chart Setup: Nifty approached a marked green support zone and created a strong wick rejection with a small body candle — classic sign of buyers defending the level.
Confirmation Candle: The next candle broke above the rejection candle’s high, confirming the reversal setup.
Premium Reaction: On the 1-min ATM Option chart (23950 CE), premiums jumped from 270 to 344 – a clean 26% gain within few minutes.
Risk-Reward Snapshot: Entry was at breakout, SL just below rejection wick, and target hit in a single momentum burst — the kind of move option buyers live for.
How to Trade It as an Option Buyer
Choose the Right Strike: Use ATM or slightly ITM options to get faster movement when price reverses.
Entry Strategy: Wait for the next candle to break the rejection candle’s high/low. No break = No trade.
SL Placement: Keep it just beyond the wick. Small loss if wrong, big reward if right.
Exit Plan: Aim for intraday resistance/support or spike-based exits — option premiums often give quick moves post-rejection.
What NOT to Do:
Don’t enter on the rejection candle itself — wait for confirmation.
Avoid trading this pattern in low volume or middle of the range.
Don’t hold blindly — if premium spikes, take the money and run!
Rahul’s Tip:
“Sudden reversals are where option buyers make money — not slow trends. The rejection candle shows intent. The breakout shows confirmation. Combine both.”
Conclusion:
The Golden Rejection Candle Strategy gives you an edge that most random trades lack — timing, context, and structure.
If you're an option buyer, this can be your go-to setup to avoid traps and enter only when smart money steps in.
No more guessing. No more fear.
Just clean, price-action-based entries that make sense.
👇 Have you ever used rejection-based setups? Drop your favorite trade below! Let’s learn together.
If you found this post valuable, don't forget to LIKE and FOLLOW!
I regularly share real-world trading setups, actionable strategies, and learning-focused content — all from real trading experience , not theory . Stay connected if you're serious about growing as a trader!

Ceasefire will pump Nifty till 24500As we all know, the market is highly sensitive and tends to react quickly to news events.
Currently, there is ongoing conflict between India and Pakistan, which has caused the markets to open with consistent gap-downs, followed by rangebound movement for the remainder of the trading session.
However, recent developments indicate that Pakistan has realized it cannot continue the conflict without risking severe consequences, including potential erasure from the global map. As a result, they are now showing readiness for a ceasefire.
Given the market's sensitive nature, we can expect a positive reaction to this news.
A strong gap-up opening is likely in the coming sessions.
Technically, the market has the potential to rally towards the 0.886 Fibonacci level, which corresponds to the 2400–2500 zone.
Traders should remain cautious but optimistic, and closely monitor key levels for confirmation of the trend.
#Nifty
12 may Nifty50 important levels trading zone #Nifty50 #option trading
🚀 If you like my trading plan and levels, don't forget to boost the post
99% working trading plan
👉Gap up open 24218 above & 15m hold after positive trade target 24323, 24522
👉Gap up open 24218 below 15m not break upside after nigetive trade target 23990, 23890
👉Gap down open 23990 above 15m hold after positive trade target 24218 , 23322
👉Gap down open 23990 below 15m not break upside after nigetive trade target 23890, 23790
📌 Trade plan for education purpose I'm not responsible your trade
More education follow social media and boost my idea
📌 koi bhi trade leval se 20 point ke sl ke bhina karan nahi hi
📌 koi trade app activate tabhi karana hota hi level pe 2 candle uper ya niche closing aati hai to
📌 leval par Ane pe turant trade plan na kare ...
📌 Full risk apaki hi hi meri na

NIFTYNIFTY
MTF Analysis Price Action Proximal TradeZone
NIFTYYearly Demand Rally Base Rally 18887 BUY
NIFTY 6 Month Demand Rally -Rally 21801 BUY
NIFTYQtrly Demand BUFL Rally Base Rally 22526 BUY
NIFTYMonthly Demand Rally Base Rally 23110 BUY
NIFTYWeekly Demand -DMIP DMIP 22180 BUY
NIFTYWeekly SOE SOE Engulfed 23049 BUY
ENTRY -1 Long 23,049
SL 22,720
RISK 329
Target as per Entry 29,834
Last High 26,277
Last Low 22,720
ENTRY -2 Long 22,180
SL 21,710
RISK 470
Target as per Entry 35,411
Last High 26,277
Last Low 21,710

Nifty May 2nd Week AnalysisNifty can remain very positive for the upcoming week post easing global and geopolitical tensions and ceasefire across the globe . On the upside, it will be important to see if Nifty is able to maintain its position at 24450 and 24850, as these are quite resistance levels. But if Nifty manages to cross these levels, then we can expect a strong short covering up to 25000+ .
****** ALL LEVELS ARE MARKED IN THE CHART POSTED ******

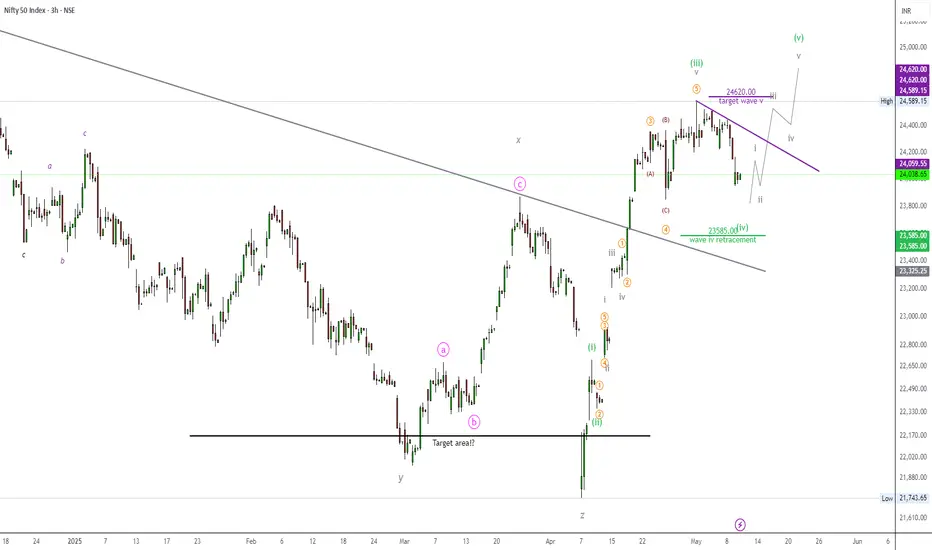
NIFTY50.....Not done to the downside!Hello Traders,
the NIFTY50 has failed to reache my stated target area @ 24620 points and declined to 24038 during Friday's session! This was not expected, but still happened! So, the open target is also available @ 23585 points at the downside within a wave 4.
Chart analysis.
The decline within a wave 4 is not over yet! One open target is valid around the 23585 area in the coming week.
If N50 will achieve this target range, the door is open to a new high above 24620 point as. Probably within a range of about 24875 to 24792 points. Here, a wave (v) should be ending.
Keep in mind, that a wave 4 of any degree, never touch the wave 1 high. So, a wave 4 would be eliminated @ 22697 points.
It is also possible, that the wave 4 should morph into a triangle. While this pattern is still the most unlikely pattern in a wave 4, we should not deal with that!
Anyway! I have visualized the coming wave 5 with my target areas.
One first sign for a wave 5 that started is when the purple trend line push above the 243xx range, depending on when and if it will be achieved!
So friends, that's it for today. We will see, how N50 will morph in the coming week.
An update will follow after new chart pattern develop.
Have a great Sunday.....
Ruebennase
Please ask or comment as appropriate.
Trade on this analysis at your own risk.
Nifty 50 Daily Chart Analysis – May 10, 2025Nifty showed strong resilience in the face of initial geopolitical tensions, with bulls managing to push the index higher despite macro uncertainties. This signaled underlying strength and suggested that the market wasn’t ready to roll over just yet.
However, looking at the current structure, the recent price action hints that bullish momentum might be losing steam. The index faced selling pressure after attempting new highs, and the price has started to retrace.
🚩 Key Level to Watch: March High
The March high now becomes a critical decision point. As long as Nifty sustains above this level, the broader bullish structure technically remains intact. But—and this is key—a decisive close below the March high followed by sustained price action beneath it could trigger a deeper correction.
📉 If that breakdown happens, we could see:
A gap fill play unfold
A possible move toward the demand zone near 23,000
And if sentiment worsens, a retest of the “election candle” low near 21,200 could be on the table
🎯 Conclusion: Bulls are clearly getting tired. Momentum is fading. March high = make-or-break level. Below that, the path of least resistance might shift downward, and the market could slip into a corrective phase—possibly until election-related clarity emerges.

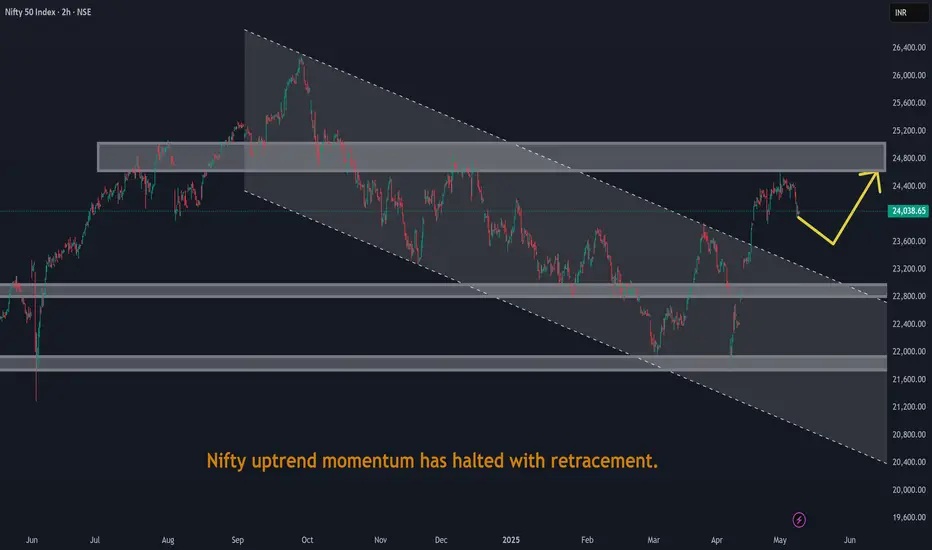
Nifty uptrend momentum has halted with retracement.Nifty uptrend momentum has halted with retracement due to recent market panic sentiments from war.
Weekly Market Wrap: Nifty Dips 340 Points Amid Global TensionsThis week, the Nifty 50 ended on a cautious note, closing at 24,008, down 340 points from the previous week's close. The index traded within a tight range, hitting a high of 24,526 and a low of 23,935—well within my anticipated levels of 24,900 to 23,800.
Silver Lining: Despite ongoing geopolitical tensions and negative news flow—including war-related developments—bulls managed to defend the critical psychological support of 24,000. That’s a sign of resilience in an otherwise shaky environment.
What’s Ahead?
For the upcoming week, expect high volatility. I see Nifty moving between 24,600 and 23,200. A weekly close below 23,800 could spell trouble for bulls, potentially opening the door for a drop toward major support zones at 23,200 and 23,000.
Technical Outlook:
Monthly & Daily Timeframes: Weak
Weekly Timeframe: Still bullish
So, while long-term charts show vulnerability, the weekly trend gives hope. I'm staying cautiously bullish—but will only turn aggressive once the monthly chart flips positive. Until then, it’s time to stay vigilant, not impulsive.
Global Cues: S&P 500 Holding Up Amid Uncertainty
The S&P 500 closed at 5,659, just 30 points down from the previous week, forming a doji candle—a clear sign of indecision. As long as the index holds above 5,532, there's no major cause for concern.
Bearish Trigger: Below 5,532, expect downside pressure toward 5,458 and 5,392, which could spill over into already fragile emerging markets like India.
Bullish Breakout: Above 5,770, bulls gain momentum, with potential upside targets of 5,821, 5,850, and 5,900. A rally here could bring relief to global equities, including Indian markets.

Nifty Trend directionNifty 24008 has support at 23846 while trend decider is 24113
If breakout and sustained could move to 24360
FII's have negative holding in future contracts and 1 Lac PUT OI skew compare to Calls OI.
Volatality is at 20
On the above facts We expect Nifty will be move down further .

Nifty Analysis EOD - May 9, 2025 - Thursday🟢 Nifty Analysis EOD - May 9, 2025 - Thursday 🔴
🧨 Gap Down, Rebound & a Triangle Trap – Bulls Show Spine Amid Chaos
Opening Mood:
Overnight panic from geopolitical tensions shook the market’s foundation—but the bulls weren’t ready to surrender just yet.
🧭 Nifty Summary:
Gift Nifty had plunged to 23,760 late last night on news of escalating conflict—marking a 445-point fall. However, as the night wore on without further developments, markets began to stabilize. At the open, Nifty registered a gap-down of 338 points at 23,935, but the first 5-minute candle showed strength, racing to fill the gap.
After a brief attempt to break the Previous Day’s Low (PDL), Nifty failed to hold below and slid back to its origin. The rest of the day was a tug-of-war with sharp two-sided moves, eventually forming a descending triangle pattern—a sign of compression and directional indecision.
🕯️ Daily Candle Breakdown:
Today’s Candle: Wide-range doji with upper wick—signs of volatility and hesitation
Close: 24,008 (▲ Positive)
Key Observations:
✅ Above 24,000 Psychological Mark
✅ Held Support Zone: 24,000 ~ 23,950
✅ Above Recent Swing Low: 23,847.85
❌ Slightly Below Previous Week’s Low: 24,054.05
❌ Below Previous Swing Close: 24,036
What It Implies:
Buyers are stepping in at key supports, but conviction is still lacking. The market remains reactive to global cues, especially Mission Sindoor ones.
⚔️ Gladiator Strategy Update
Strategy Parameters:
ATR: 291.20
IB Range: 204.00 (Large IB)
Market Structure: ImBalanced
Trade Highlights:
Total Trades: 1
✅ Long Trigger @ 10:10 AM → Target 1:1.5 Achieved
📈 Intraday Walk (5-Min View):
Strong gap-fill in the first candle signaled bullish intent
Failed breakdown below PDL trapped weak shorts
Descending triangle emerged as price compressed
Market closed near resistance but above key support—neutral to slightly bullish tone
🔮 What’s Next?
This market is walking a tightrope between sentiment and structure. On one hand, technical levels are being respected—but on the other, global uncertainty is keeping participants hesitant.
“This is a news-driven market. Delivery trades are best avoided. Stay nimble, trade the levels, and protect capital. Remember, sometimes staying out is a profitable strategy.”
🔍 Support & Resistance Levels
🔼 Resistance Zones:
24,036 ~ 24,044
24,150 ~ 24,165
24,188 ~ 24,240
24,290
24,330 ~ 24,365
24,400 ~ 24,420
🔽 Support Zones:
24,000 ~ 23,950
23,935
23,890 ~ 23,870
23,848
23,820
23,710 ~ 23,660
📌 Final Thoughts:
“Structure is key. When levels work, respect them. When they break, adapt.”
In a market full of noise, discipline and level-based action is your edge.
✏️ Disclaimer
This is just my personal viewpoint. Always consult your financial advisor before taking any action.


So finally Nifty recedes a bit due to Indo-Pak tensions.Finally Nifty today receded a bit due to Indo-Pak tensions and war like situation/war between Indo-Pak. The support levels for Nifty now remains at 23924, 23809 important (Father line support of hourly chart), 23676 important mid channel support if this support is broken bears can drag Nifty further down to 23462, 23279, 22771 and finally 22579 which is the channel bottom support. If this level is broken there can be further free fall. Resistances on the upper side remain at 24111, 24247 (Mother Line resistance on the hourly chart), 24443, 24634 and 24892 (Channel top resistance). Situation remains fluid due to the Geo-Political situation no support can be very strong support as a lot can happen during the week end and no resistance can be a solid resistance if few things move in the anticipated direction.
Disclaimer:The above information is provided for educational purpose, analysis and paper trading only. Please don't treat this as a buy or sell recommendation for the stock or index. The Techno-Funda analysis is based on data that is more than 3 months old. Supports and Resistances are determined by historic past peaks and Valley in the chart. Many other indicators and patterns like EMA, RSI, MACD, Volumes, Fibonacci, parallel channel etc. use historic data. There is no guarantee they will work in future as markets are highly volatile and swings in prices are also due to macro and micro factors based on actions taken by the company as well as region and global events. Equity investment is subject to risks. I or my clients or family members might have positions in the stocks that we mention in our educational posts. We will not be responsible for any Profit or loss that may occur due to any financial decision taken based on any data provided in this message. Do consult your investment advisor before taking any financial decisions. Stop losses should be an important part of any investment in equity.

Nifty levels - May 12, 2025Nifty support and resistance levels are valuable tools for making informed trading decisions, specifically when combined with the analysis of 5-minute timeframe candlesticks and VWAP. By closely monitoring these levels and observing the price movements within this timeframe, traders can enhance the accuracy of their entry and exit points. It is important to bear in mind that support and resistance levels are not fixed, and they can change over time as market conditions evolve.
The dashed lines on the chart indicate the reaction levels, serving as additional points of significance to consider. Furthermore, take note of the response at the levels of the High, Low, and Close values from the day prior.
We hope you find this information beneficial in your trading endeavors.
* If you found the idea appealing, kindly tap the Boost icon located below the chart. We encourage you to share your thoughts and comments regarding it.
Wishing you success in your trading activities!
