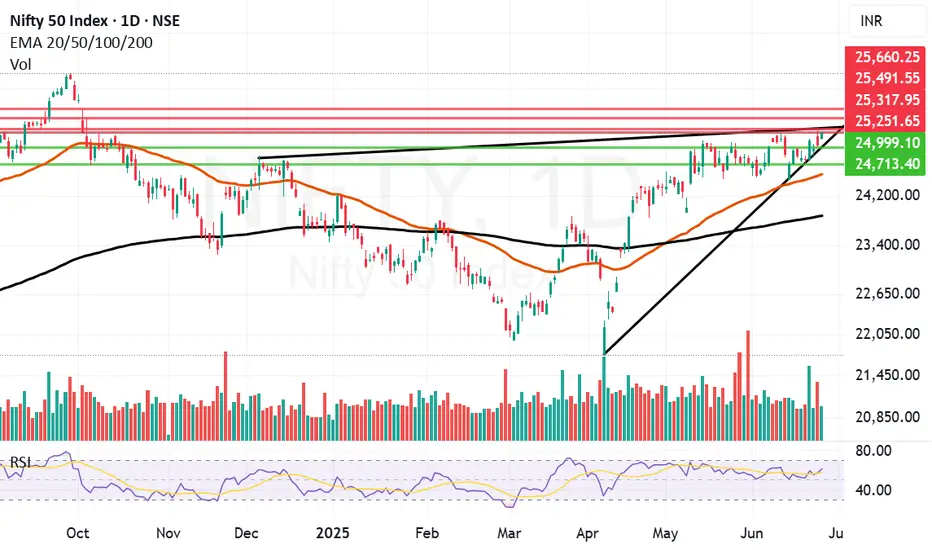
Final hurdle remains to be crossed before Nifty can fly further.One important final hurdle of 25251 remain just in front of Nifty before it can fly further. I can it a final hurdle because it is an important trendline resistance. Last 2 days Nifty has tried to climb above it but we did not get a closing above it yesterday and today as well. Today Nifty made a high of 24266 but closed at 25244. It could not hold on to the ground above 25251. The level is challenging but positive momentum built from today's display might allow it to close above the same. Only time will tell. Closing of this week will be very important.
Nifty resistances remain at: 25251, Closing above 25251 will empower Bulls to pull Nifty further upwards towards 25317, 25491 and 25660.
Nifty supports remain at: 24999, 24713, 24749 (Mother Line Support), 23875 (Father line support). (Closing below Father line support can bring Bears back into the game).
Disclaimer: The above information is provided for educational purpose, analysis and paper trading only. Please don't treat this as a buy or sell recommendation for the stock or index. The Techno-Funda analysis is based on data that is more than 3 months old. Supports and Resistances are determined by historic past peaks and Valley in the chart. Many other indicators and patterns like EMA, RSI, MACD, Volumes, Fibonacci, parallel channel etc. use historic data which is 3 months or older cyclical points. There is no guarantee they will work in future as markets are highly volatile and swings in prices are also due to macro and micro factors based on actions taken by the company as well as region and global events. Equity investment is subject to risks. I or my clients or family members might have positions in the stocks that we mention in our educational posts. We will not be responsible for any Profit or loss that may occur due to any financial decision taken based on any data provided in this message. Do consult your investment advisor before taking any financial decisions. Stop losses should be an important part of any investment in equity.
NIFTY trade ideas
Retest Success + Upside Move = Confirmed BreakoutMarket Sentiment is Bullish
Buyers have stepped in after retest.
Confidence is strong above 25,440.
Next Targets to Watch:
🎯 Target 1: 25,520
🎯 Target 2: 25,600+
These levels could act as minor resistances.
Support Now:
25,440 (was resistance, now support).
Price should ideally stay above this level for trend continuation.
🧠 Suggested Trading Plan (If You’re Active in the Market):
Action Level (Approx.)
Entry (Long) 25,450–25,470
Stop Loss Below 25,420
Target 1 25,520
Target 2 25,580–25,600
📊 Confirmation Tools (Optional for Extra Safety):
Look for strong bullish candles on 5-min/15-min chart.
Volume spike with upward movement confirms smart money involvement.

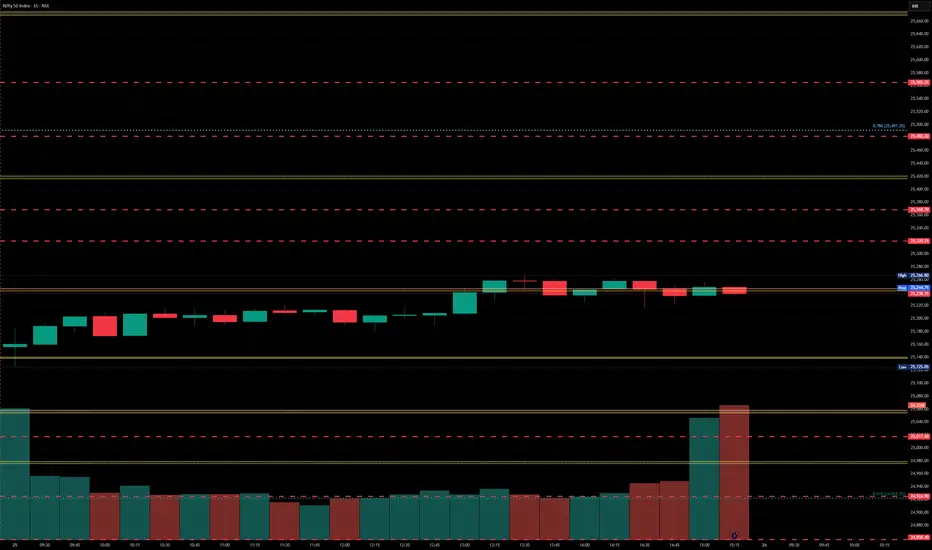
Nifty levels - Jun 27, 2025Nifty support and resistance levels are valuable tools for making informed trading decisions, specifically when combined with the analysis of 5-minute timeframe candlesticks and VWAP. By closely monitoring these levels and observing the price movements within this timeframe, traders can enhance the accuracy of their entry and exit points. It is important to bear in mind that support and resistance levels are not fixed, and they can change over time as market conditions evolve.
The dashed lines on the chart indicate the reaction levels, serving as additional points of significance to consider. Furthermore, take note of the response at the levels of the High, Low, and Close values from the day prior.
We hope you find this information beneficial in your trading endeavors.
* If you found the idea appealing, kindly tap the Boost icon located below the chart. We encourage you to share your thoughts and comments regarding it.
Wishing you success in your trading activities!

Nifty levels - Jun 26, 2025Nifty support and resistance levels are valuable tools for making informed trading decisions, specifically when combined with the analysis of 5-minute timeframe candlesticks and VWAP. By closely monitoring these levels and observing the price movements within this timeframe, traders can enhance the accuracy of their entry and exit points. It is important to bear in mind that support and resistance levels are not fixed, and they can change over time as market conditions evolve.
The dashed lines on the chart indicate the reaction levels, serving as additional points of significance to consider. Furthermore, take note of the response at the levels of the High, Low, and Close values from the day prior.
We hope you find this information beneficial in your trading endeavors.
* If you found the idea appealing, kindly tap the Boost icon located below the chart. We encourage you to share your thoughts and comments regarding it.
Wishing you success in your trading activities!
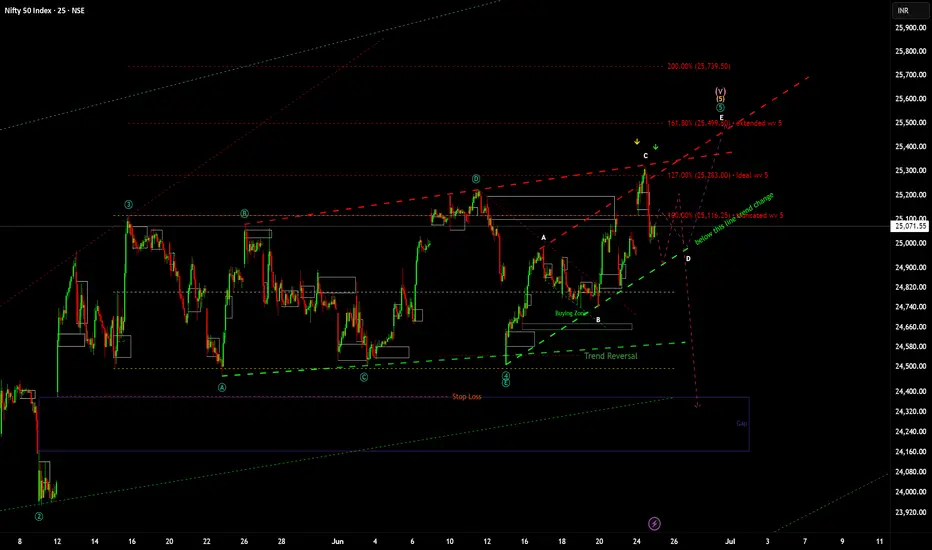
NIfty my view and not a sell or buy recommendation....nifty : My view for coming days. hope it takes the violet line.🤞🏻
technically it has completed Wv 5 which is 127% but the structure is not clear so can go into extension which may take it to 161%. green line if it is broken on daily Tf we are entering correction.🤞🏻.
nifty 50 intrady trading ideatoday we got 3 trade and showing you through chart.
how to took?
booked profit on support.

Nifty levels - Jul 01, 2025Nifty support and resistance levels are valuable tools for making informed trading decisions, specifically when combined with the analysis of 5-minute timeframe candlesticks and VWAP. By closely monitoring these levels and observing the price movements within this timeframe, traders can enhance the accuracy of their entry and exit points. It is important to bear in mind that support and resistance levels are not fixed, and they can change over time as market conditions evolve.
The dashed lines on the chart indicate the reaction levels, serving as additional points of significance to consider. Furthermore, take note of the response at the levels of the High, Low, and Close values from the day prior.
We hope you find this information beneficial in your trading endeavors.
* If you found the idea appealing, kindly tap the Boost icon located below the chart. We encourage you to share your thoughts and comments regarding it.
Wishing you success in your trading activities!

Nifty : Strong Breakout MomentumBreaking out from a 5‑week consolidation, The Nifty ended positively.
Fading geopolitical tensions & Rising FII long-short ratio and futures rollover suggest bullish sentiment.
With key time-based levels and technical thresholds in focus, we could see Nifty scale toward 26,000 📈
📌 There is also a Poll & Flag pattern breakout visible on higher time frame. Which indicates targets towards 27200 / 28000.
These upper range open once Nifty starts sustain above ATH oh Daily & Weekly time frame on medium term

Major Breakout in Nifty now holding the levels key. We saw a major Breakout in Nifty today. Finally Nifty closed above much coveted levels of 25251. Nifty made a high of 25565 and closed at 25549 which was a remarkable comeback. What we are seeing on chart is a cup formation happening in Nifty. For flying further Nifty needs to have a strong closing tomorrow and stronger monthly closing on Monday that is 30th June. These 2 closings will be very important. We need a Nifty closing above 25884. Even if that does not happen a monthly closing above 25251 will also be considered a strong closing. Nifty is strongly on the path of recovery for sure and supports and resistances for Nifty remain as under:
Nifty Supports Remain At: 25251, 24994, 24760 and 24588 (Mother line). If by chance under unlikely circumstances Mother line is broken then Bears will become more empowered and might try to pull Nifty towards 24209 or even 23892 (Father line support).
Nifty Resistances Remain At: 25565, 25740, 25884, 26066 and finally previous All time high resistance of 26277.
Disclaimer: The above information is provided for educational purpose, analysis and paper trading only. Please don't treat this as a buy or sell recommendation for the stock or index. The Techno-Funda analysis is based on data that is more than 3 months old. Supports and Resistances are determined by historic past peaks and Valley in the chart. Many other indicators and patterns like EMA, RSI, MACD, Volumes, Fibonacci, parallel channel etc. use historic data which is 3 months or older cyclical points. There is no guarantee they will work in future as markets are highly volatile and swings in prices are also due to macro and micro factors based on actions taken by the company as well as region and global events. Equity investment is subject to risks. I or my clients or family members might have positions in the stocks that we mention in our educational posts. We will not be responsible for any Profit or loss that may occur due to any financial decision taken based on any data provided in this message. Do consult your investment advisor before taking any financial decisions. Stop losses should be an important part of any investment in equity.


#NIFTY Intraday Support and Resistance Levels - 26/06/2025Nifty is set to open slightly gap up today near the 25,250 mark, signaling a continuation of the ongoing consolidation phase. The market has been hovering around this zone for the past couple of sessions, making it a key inflection point. A sustained move above 25,300 can trigger bullish momentum, leading to targets of 25,350, 25,400, and 25,450+. This level also coincides with previous intraday highs, making it a potential breakout zone for aggressive buyers.
On the flip side, if Nifty faces rejection from this resistance zone and slips below the 25,250–25,200 levels, a downside move could emerge. In that case, short positions can be considered with immediate support levels at 25,150, 25,100, and 25,050. The opening hour will be crucial—traders should monitor for either a breakout above 25,300 or a breakdown below 25,200 to determine intraday direction. Volatility may increase due to expiry, so a wait-and-watch approach with tight stop-losses is advisable.

One of the reason, Why I m saying 5th wave done?Here you can see the pitchfork tool applied, as u can see that Nifty has touched this pitchforks median line from below and taking a resistance from it. This is the final 5th wave resistance. For further more elaboration, here are two ways I applied this tool:
1. In this particular snapshot, I touched 3rd pivot of this tool on the 7th April 2nd lowest pivot on hourly TF.
2. And yesterday prediction was based on this same tool but the 3rd pivot of the tool was on 7 April lowest pivot means on 21742.
Thats why there is a slight difference between these two median lines from two different ways of applying.
As u can see nifty has taken support on this line multiple times and forming a wavy structure around it

5 th wave done today? If Nifty does not able to cross 25600 by Monday and goes down after hitting today's high of 25565 then it is the indication of completion of wave 5th and now it is the end of extended flat correction ABC started from March. Many price action tools are also indicating this pivot 25565 as high. So the conclusion is this that there are 50% chances of ending of correction and we will get further confirmation after Friday's price movement.
Nifty 50 Bullish SignalsThe Nifty 50 Index on the weekly chart has been consolidating within a defined range for the last 5 weeks, as highlighted in the green box. Here's a quick breakdown:
1. Next Week Ascending CPR (Central Pivot Range)
Implication: An ascending CPR suggests bullish sentiment. It indicates that price action is likely to trend upward, especially if the index stays above or bounces from the CPR.
CPR levels are moving higher week over week, showing positive price structure and strengthening momentum.
2. Weekly Golden Pivot Zone
The golden pivot zone (between Weekly CPR and S1) is considered a strong support zone.
In the chart, price bounced sharply from that zone, confirming its strength.
It now acts as a demand zone. As long as the price remains above this zone, bullish momentum is intact.
What the Monthly CPR Suggests:
✅ Bullish Bias for June-July:
Price above CPR + strong bounce from the buy reversal zone = continuation of uptrend is likely.
As long as price holds above 24,600 (CPR center) or 24,426 (L3 Buy Reversal), expect higher highs.
⚠️ Key Trigger Levels:
Bullish Breakout Trigger: Above 25,400 (M-H4)
Bearish Reversal Caution: Below 24,426 may indicate weakness, especially if it breaks 24,101 (L4).
Strategy Insights:
Buy on Dips: If Nifty pulls back near the CPR zone (~24,600–24,800), it offers a potential long entry.
Upside Targets: 25,276 → 25,400 → 25,781
Avoid Shorts unless price closes below 24,600 with strong volume.

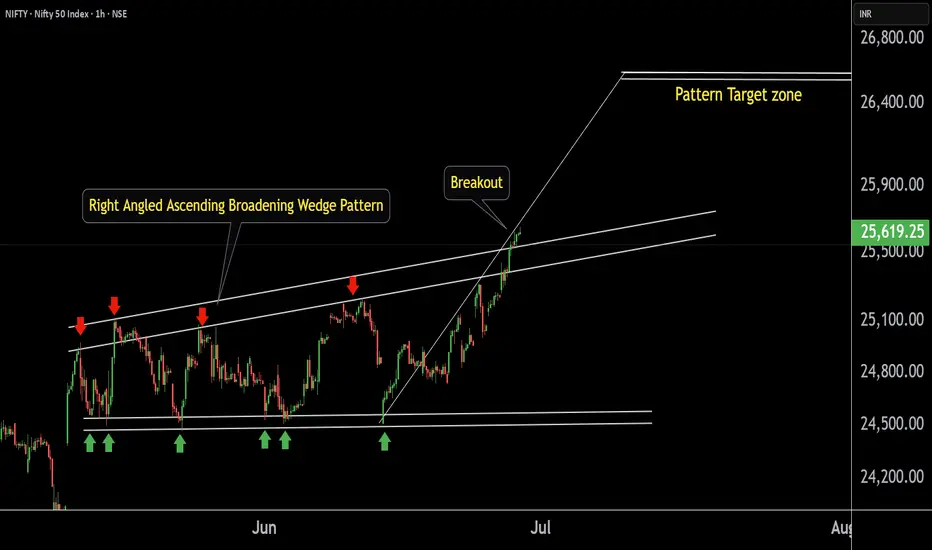
NIFTY 50 key level This is the 1 hour chart of NIFTY 50 .
NIFTY 50 has formed Right Angled Ascending Broadening Wedge Pattern.
Nifty 50 has given a breakout from its pattern.
If Nifty 50 sustains after a successful retest post-breakout, we may see higher prices in Nifty 50.
The target for this pattern is projected near the 26,600 level.
Thank You !!
Market Recap: Nifty Breaks Out After 5 Weeks of Consolidation!The Indian stock market saw a strong bullish move this week, with Nifty 50 closing at 25,637, marking a significant gain of 525 points from the previous week's close. The index made a high of 25,654 and a low of 24,824, finally breaking out of the key resistance zone of 25,000–25,100 after five weeks of sideways consolidation.
This breakout is a critical technical development, signaling renewed strength in the broader market. However, to sustain this momentum and target the all-time high zone of 26,134–26,277, Nifty may need to either:
Consolidate within the previous week's range of 25,650–24,800, or
Retest the breakout level near 25,200 for confirmation.
Failing to do so could make this breakout a false one.
Weekly Outlook for Nifty:
For the coming week, the expected trading range is between 25,200 and 26,150. Price action around these levels will be key to watch.
On a broader sectoral view, out of 14 NSE indices, only Nifty Financial Services is showing relative strength on the monthly chart—a potential red flag for sustained bullish sentiment. When just one sector leads while others lag, it's often a sign to remain cautious.
Strategy Suggestion:
Consider booking partial profits and trailing stop losses on the remaining positions. Until the monthly time frame turns decisively bullish, it's wise to stay alert and manage risk actively.
Global Markets: S&P 500 Breaks Out!
In the U.S., the S&P 500 surged to close at 6,173, successfully breaking above its key resistance level at 6,013. This breakout, if sustained above 6,150 next week, opens up the path toward higher targets: 6,225 / 6,376 / 6,454 / 6,500.
However, traders should remain flexible. If the breakout fails, we could see a pullback to support zones near 6,013 or even 5,899.
Pro Tip:
Be ready to switch trading positions quickly if the breakout doesn’t hold—volatility is still very much in play in both Indian and U.S. markets.

Nifty levels - Jun 30, 2025Nifty support and resistance levels are valuable tools for making informed trading decisions, specifically when combined with the analysis of 5-minute timeframe candlesticks and VWAP. By closely monitoring these levels and observing the price movements within this timeframe, traders can enhance the accuracy of their entry and exit points. It is important to bear in mind that support and resistance levels are not fixed, and they can change over time as market conditions evolve.
The dashed lines on the chart indicate the reaction levels, serving as additional points of significance to consider. Furthermore, take note of the response at the levels of the High, Low, and Close values from the day prior.
We hope you find this information beneficial in your trading endeavors.
* If you found the idea appealing, kindly tap the Boost icon located below the chart. We encourage you to share your thoughts and comments regarding it.
Wishing you success in your trading activities!

Wait For RetestChart Analysis (Upside Breakout):
✅ Breakout Confirmation:
The price broke above the resistance level around 25,440.
This is a strong sign of a bullish breakout.
🔼 What It Indicates:
Buyers are now in control of the market.
The next possible target or resistance could be around 25,520 or higher (as per the upper levels on the chart).
If the breakout is supported by good volume, it adds further strength to the move.
🧠 For Traders:
It may be a good opportunity to consider long (buy) positions, especially after a small pullback and confirmation.
Stop Loss: Can be placed near the breakout level (~25,440), which now acts as support.
Target: You can aim for the next resistance zones like 25,520, 25,600, etc.
📊 Volume Insight:
There is a noticeable increase in volume during the breakout, which confirms the validity and strength of the move.

Nifty 50 breaks free🚀 Nifty 50 breaks free! 📈
After weeks of sideways movement, the index has finally crossed above its month-old range with conviction.
Positive vibes are in the air! 🌟
If this momentum holds, next stop: 26,500? 🔮💥
Stay tuned and stay bullish! 🐂🔥

retest check1. Successful Retest (Bullish Confirmation):
If price touches the breakout level (~25,440) and bounces back up, it confirms strong support.
This is a buying opportunity for traders.
Entry: Near the support level (25,440).
Stop Loss: Just below the support (e.g., 25,400).
Target: Next resistance levels like 25,520 or higher.
❌ 2. Failed Retest (False Breakout):
If price breaks back below 25,440, it can be a false breakout.
Price might re-enter the sideways range or even go into a downtrend.
Traders should avoid long trades or may even consider short positions if it falls below 25,292 (support zone).
📊 What to Watch Now:
Price behavior near 25,440.
Volume: Low volume = weak retest; Strong bounce with volume = bullish.
Candle patterns: Bullish reversal candles (e.g., hammer, bullish engulfing) near 25,440 can confirm upside.

Nifty lost gains but it is a positive sign to close above 25KNifty in the Euphoria of ceasefire between Iran and Israel gained a lot of ground early in the day and made a high of 25317 but could not sustain the levels and lost massive 273 points due to profit booking to close the day at 25044. Although the loss was big but the silver lining is Nifty still ended the day 72 points in the green and closed above 25K levels. As there were news and claims related to ceasefire violations from both sides a lot of investors and participants were apprehensive of carrying long positions forward. If the things remain positive over night and if important resistance levels of 25116 and 25251 are crossed we might yet again see positive momentum building.
Nifty Resistances remain at: 25116, 25251, 25317. Closing above 25317 will lead to further upside towards the next resistance levels of 25491 and 25660.
Nifty Supports remain at: 25499 (Trend line support), 24713, 24521 (Mother Line Support) and 24463. closing below 24463 can had over the gains to the Bears who can drag index down towards Father line support of 23861.
Disclaimer: The above information is provided for educational purpose, analysis and paper trading only. Please don't treat this as a buy or sell recommendation for the stock or index. The Techno-Funda analysis is based on data that is more than 3 months old. Supports and Resistances are determined by historic past peaks and Valley in the chart. Many other indicators and patterns like EMA, RSI, MACD, Volumes, Fibonacci, parallel channel etc. use historic data which is 3 months or older cyclical points. There is no guarantee they will work in future as markets are highly volatile and swings in prices are also due to macro and micro factors based on actions taken by the company as well as region and global events. Equity investment is subject to risks. I or my clients or family members might have positions in the stocks that we mention in our educational posts. We will not be responsible for any Profit or loss that may occur due to any financial decision taken based on any data provided in this message. Do consult your investment advisor before taking any financial decisions. Stop losses should be an important part of any investment in equity.

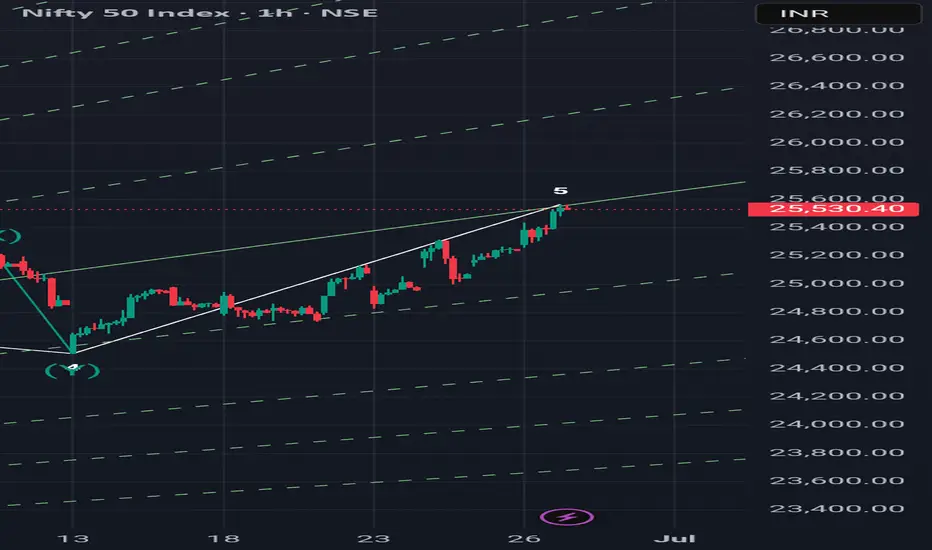
Nifty 50 Hourly Chart Update 📊 Nifty 50 Hourly Chart Update 📊
Nifty’s leap hits 25,600 🚀
But signs of a short-term pause are showing up… ⚠️
🔹 RSI at 75 🔼
🔹 ATR dropping 📉
🔹 Price at Pitchfork & Gann Square resistance 🎯
📉 A mild reversal may be on the cards before the next move.
⏳ A better entry opportunity might come in the next few days. Stay patient, stay sharp! ⚔️📅

Nifty July 1st Week Analysis Nifty is looking positive for the week ahead, and we can expect momentum to continue up to 26000-26148 levels.The Important level to watch for upside would be 25750-800, and if Nifty breaches downside support of 25550, then we can expect a small retracement up to 25200-300 on the downside.
All levels are marked in the chart posted.
