NIFTY Index View - May 02, 2025The index has been moving sideways since last few days this week but has moved upwards with fine volume as we had analyzed on Tuesday (April 29th).
The index still looks strong enough to continue the trend further upwards.
NIFTY trade ideas

Nifty 50 technical analysis of the day Chart Observation:
Price recently swept Buy-side Liquidity (BSL) near 24,320–24,350 zone.
After the liquidity grab, a sharp rejection confirms institutional sell-side activity.
Market structure is turning bearish as price breaks below minor support near 24,250.
Key SMC Levels:
BSL zone (Trap Zone): 24,320–24,350 (Liquidity grab completed)
Break of Structure (BoS): Below 24,250 confirms bearish bias.
Next Target - Sell-side Liquidity (SSL): 24,100 then 23,950–23,900 zone.
Fair Value Gap (FVG): 24,270–24,300 (can be retested as resistance)
---
Trade Setup:
Entry: On pullback to 24,270–24,300 (FVG / bearish OB zone)
Stop Loss: Above 24,360 (above liquidity sweep)
Target 1: 24,100 (nearest SSL)
Target 2: 23,950–23,900 (deeper SSL zone)
---
SMC Logic: After sweeping liquidity from buy-side traders, Smart Money is likely shifting to the sell-side to trap late buyers. The impulsive bearish candle confirms order flow shift.
Bias: Bearish
Strategy: Sell the pullback into premium zone

#NIFTY Intraday Support and Resistance Levels - 02/05/2025Gap up opening expected in nifty near 24450 level. Currently nifty consolidating in the range of 24250-24500 level. After opening if nifty gives breakout and start trading above 24500 level then possible strong upside rally towards the 24750+ level in today's session. 24250 level will act as a strong support for today's session. Any major downside only expected if nifty starts trading below 24200 level. Below 24200 level downside can goes upto 24000 level.

Inverted head and shoulders pattern! Yet to be broken! As we can see despite the gap it failed to break and sustain above the structure hence made it void but looking at NIFTY we can see the structure is still there which is yet to broken hence we can wait for candle to close above the given structure for a unidirectional rally so plan your trades accordingly and keep watching everyone.
Nifty Analysis 02.05.2025As of May 1, 2025, the Nifty 50 index has demonstrated a robust performance, closing April with a gain of 3.46%, building upon a 6.30% rise in March. This upward momentum is largely attributed to substantial foreign portfolio investments (FPIs), with approximately $4.11 billion injected over nine trading sessions, marking the longest buying spree since July 2023.
mint
The rally has been further supported by optimism surrounding a potential U.S.-India trade agreement, India's strong economic outlook compared to global peers, and attractive valuations among Indian large-cap stocks. Notably, heavyweights like Reliance Industries have contributed to investor enthusiasm with strong corporate earnings.
Despite geopolitical tensions, including a recent militant attack in Kashmir, the markets have remained resilient. However, such events have introduced volatility, as evidenced by the Nifty volatility index rising for the fifth time in six sessions.
Looking ahead, historical trends suggest that May often yields modest gains for the Nifty 50, with positive returns in six out of the past ten years, averaging 1.5%. Sectors like Auto and FMCG have historically performed well during this month.

Nifty : Market just waiting and going sideways Nifty : Market is just watching and waiting. Going sideways due to ongoing conflict
24500 is a resistance level #1 for Nifty at this moment .
Be patient
( Not a Buy / Sell Recommendation
Do your own due diligence ,Market is subject to risks, This is my own view and for learning only .)

Nifty Analysis EOD - April 30, 2025 - Wednesday🟢 Nifty Analysis EOD - April 30, 2025 - Wednesday 🔴
🗓️ One more expiry day ended in suspense, surprise and a last-minute spike!
📊 Nifty Summary
Nifty opened slightly green at 24,342, just 6 points above the previous close. A quick dip below the previous day’s low was swiftly recovered, triggering a rally towards 24,400. However, most of the session turned into a slow grind between a narrow 40-point range as both bulls and bears hesitated.
As is typical on expiry days, a sudden burst in the last 5 minutes added 198 points to the move — a nightmare for option sellers but a jackpot for Hero-Zero traders. The day’s true intraday close stood at 24,243, while settlement was at 24,334, reflecting a wide 90-point gap traders must factor in.
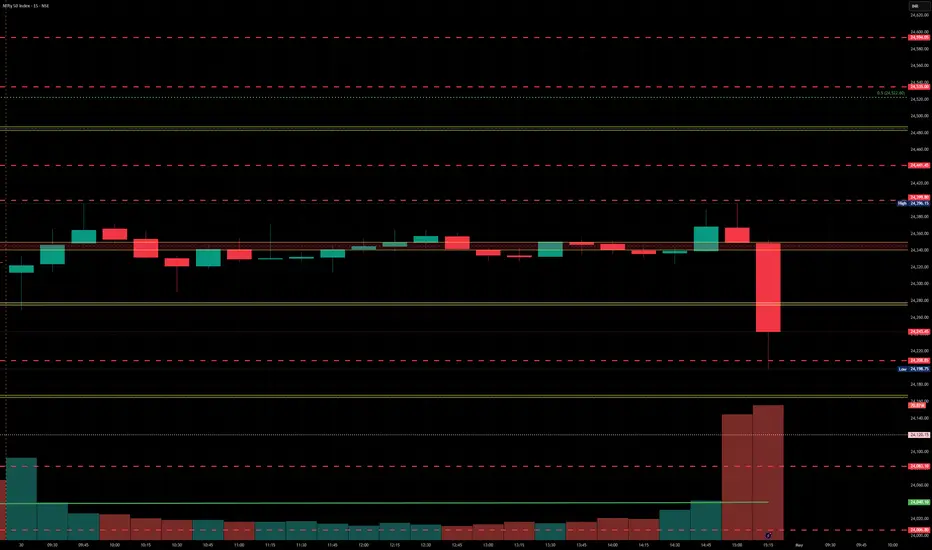
🕔 Intraday 5 Min Time Frame Chart
🔁 Intraday Walk
🔹 Opened at 24,342 with a quick drop below PDL, then rebounded.
🔹 Rallied to 24,400 within the first 30 minutes.
🔹 Ranged for hours between 24,330–24,370 with no clear breakout.
🔹 A 198-point spike in the final 30 minutes caught most off-guard.
🔹 True intraday close = 24,243 vs. settlement = 24,334 → Huge difference!
⏱ Intraday 75 Min Time Frame Chart
📐 75-Min Chart Analysis / Zone Commentary
The last 3 sessions showed repeated failed attempts to close above 24,365 (the previous week's high). A symmetrical triangle was clearly visible and delivered a classic trap: a false breakout, a liquidity grab, and an immediate pullback to meet the pattern’s target. Unfortunately, the real breakout happened around 2:35 PM — just after most had packed up for expiry!
📅 Daily Time Frame Chart
🕯️ Daily Candle Breakdown
Today’s Candle Type: Spinning Top (Bearish Tilt)
Today’s OHLC:
Open: 24,342.05
High: 24,396.15
Low: 24,198.75
Close: 24,334.20
Change: –1.75 (–0.01%)
Know How of Candle Type:A Spinning Top reflects indecision — a small body with long shadows shows a battle between buyers and sellers with no clear winner.
Key Observation:
Real Body = 7.85 points → Minimal net movement
Upper Wick = 54.10 pts
Lower Wick = 143.30 pts → Stronger buyer defense but weak follow-through
What It Implies:Buyers showed strength at lower levels but couldn't close strong. Despite the strong lower wick, the red close tilts sentiment mildly bearish. The breach of previous day’s low confirms weakness unless reversed tomorrow.
⚔️ Gladiator Strategy Update
Strategy Parameters:
ATR: 313.49
IB Range: 126.40
IB Category: Medium IB
Market Structure: Balanced
Trade Highlights:
📉 No Trade Triggered
Gladiator system remained silent today amidst the choppy expiry behavior.
🔮 What’s Next? / Bias Direction
Although the larger bias had been mildly bullish, the breach of the 24,290 low shifts the short-term view to slightly bearish. However, one more session confirmation is needed before taking any aggressive stance.
📌 Support & Resistance Levels
🔺 Resistance Zones:
24,290 (PDL)
24,330 ~ 24,360 (Immediate hurdle)
24,396 (CDH)
24,457 (PDH)
24,480 ~ 24,540 (Incl. 24,500 psych level)
24,800
🔻 Support Zones:
24,190 ~ 24,225
24,120
24,050
24,000 ~ 23,950
23,820
23,710 ~ 23,660
23,500
23,410 ~ 23,370
23,215
💬 Final Thoughts
“Expiry days are for the patient and the prepared. Today was a perfect example of how calm waters can suddenly become tidal waves.”The pattern, structure, and volatility continue to show that structure is key — respect it when it holds, and adapt when it breaks.
✏️ Disclaimer ✏️
This is just my personal viewpoint. Always consult your financial advisor before taking any action.

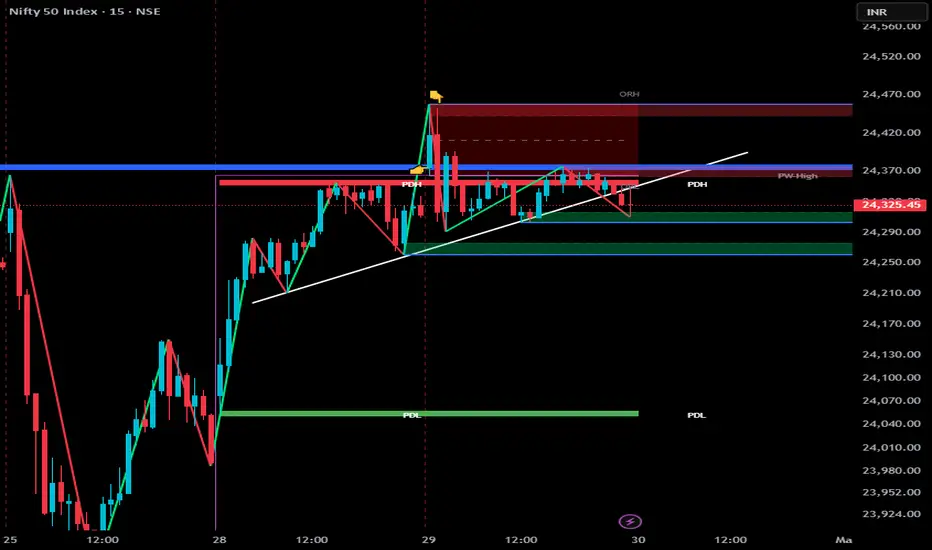
NEXT -- >> 23,990 – 23,870 zone.On 30th April, Nifty traded in a rangebound manner, as reflected in the charts. It took support around the 24,200 level, highlighted in green. Any adverse geopolitical development, such as an incident involving PoK or Pakistan, could trigger a sharp decline, potentially pushing Nifty down to the 23,990 – 23,870 zone.
A decisive move on the upside is expected only above the 24,470 level.
Nifty just one kick away from 23990 - 23870On 30th April, Nifty traded in a rangebound manner, as reflected in the charts. It took support around the 24,200 level, highlighted in green. Any adverse geopolitical development, such as an incident involving POK or Pakistan, could trigger a sharp decline, potentially pushing Nifty down to the 23,990 – 23,870 zone.
A decisive move on the upside is expected only above the 24,470 level.
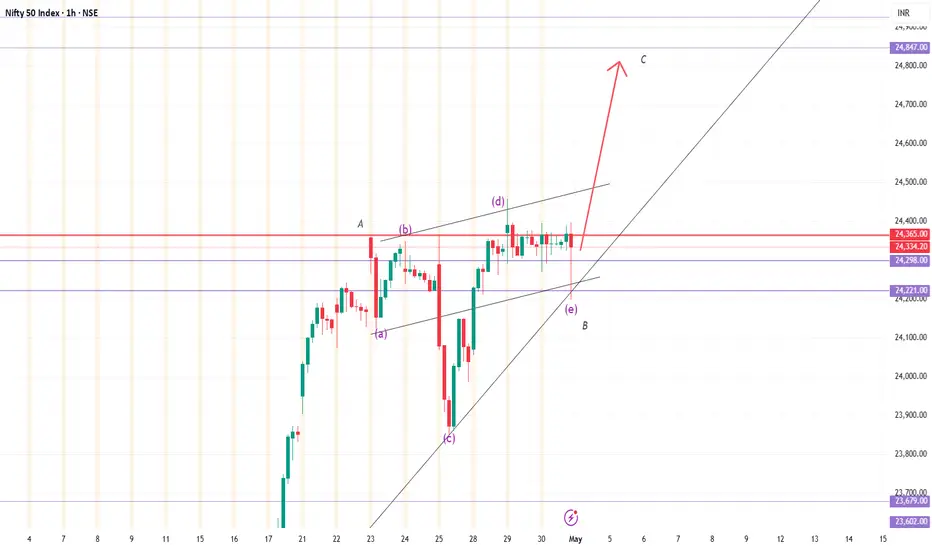
Neutral Triangle completion | Breakout AbvThe Neutral Triangle pattern.
- Either e-wave is still in making if down move continues.
- But Breakout upside looks imminent.. completing the neutral triangle pattern.
The upside breakout should retrace e-wave in lessor time.
Nifty .. That's all Bull folks..Well PlayedNifty 24334 - Has hit the trend resistance.
Though tried to pass many times it closed below the magic 24349.
24280 would be the gate for bear zone to 23300.
Well Played Bulls .. All the best Bears..

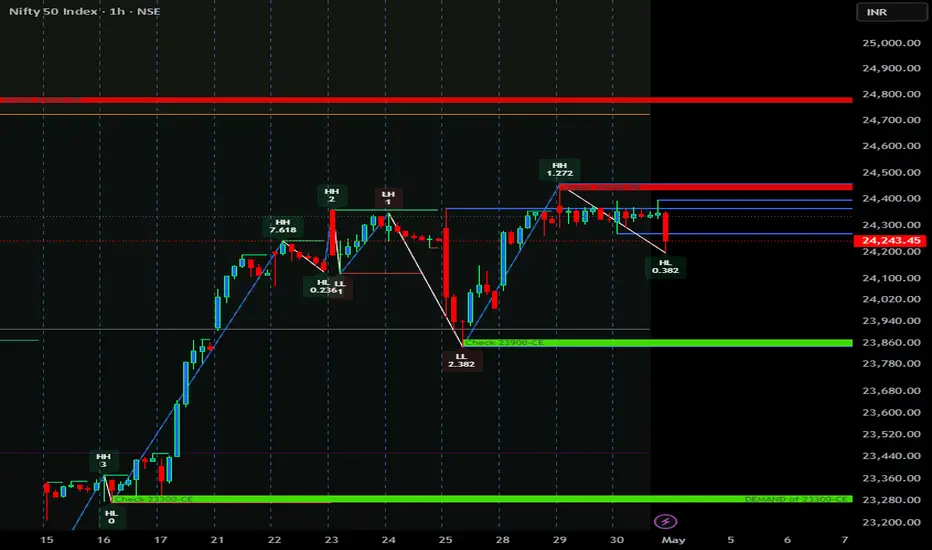
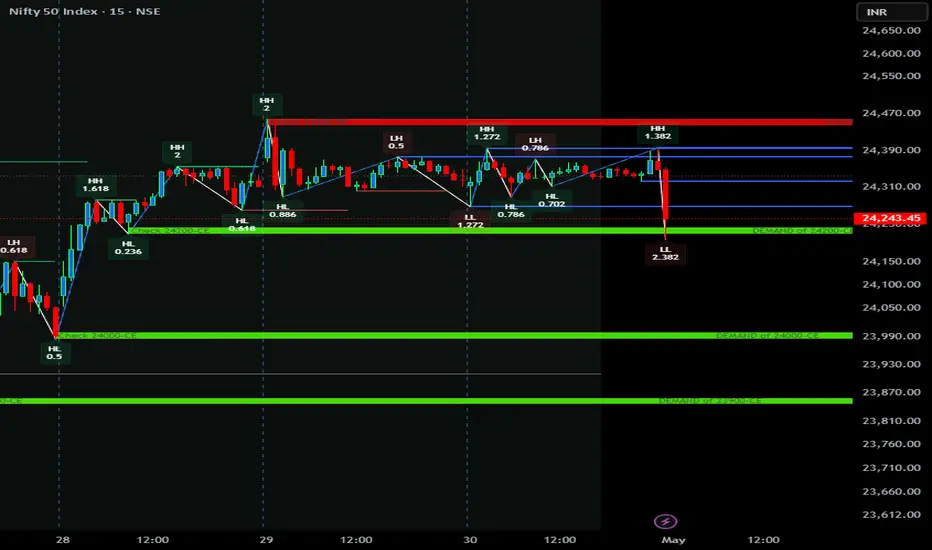
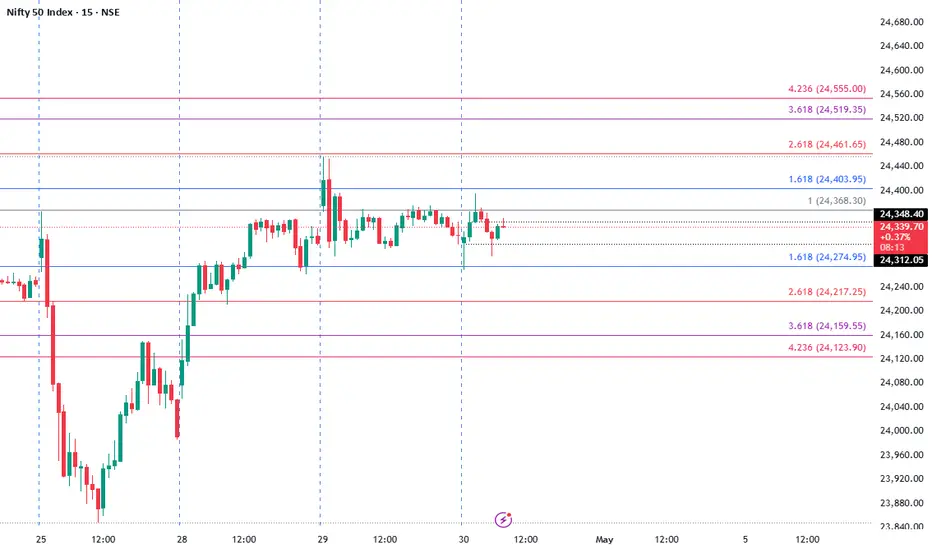
NIFTY Analysis for 2nd May, 2025In 15 mins timeframe market view is bullish. It did BOS (Break of Structure) as its breaks previous swing high and then took inducement (24260) in the same time frame. According to chart, high point is 24450 and low point is 23853 as per 15 mins swing. So, we will look for buying opportunity here. If market comes down till 23990 to 24050 area (demand zone) then that will be the best buying opportunity.
But if market makes CHoCH or flip in lower time frame (2min or 1 min) before the demand zone, in that case you can also make a entry for buying.
Most importantly, in these both cases there should be CHoCH or Flip in lower timeframe.

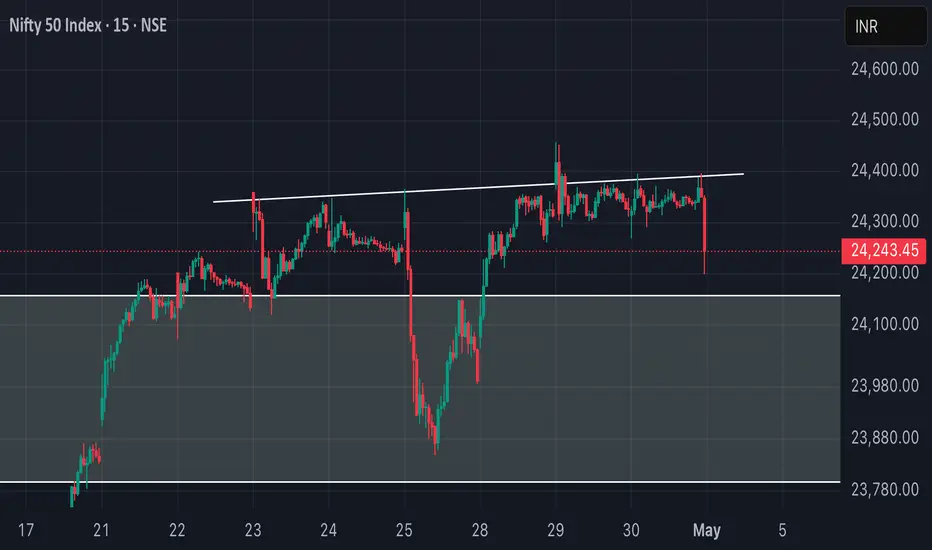
nifty 50 weak trend 24000nifty 50 weak trend 24000
The Nifty 50 index is currently showing signs of weakness, with analysts predicting a potential test of the 24,500 level if it breaks the falling trendline support. The index recently failed to sustain gains and closed below 24,300, forming a bearish candlestick pattern,

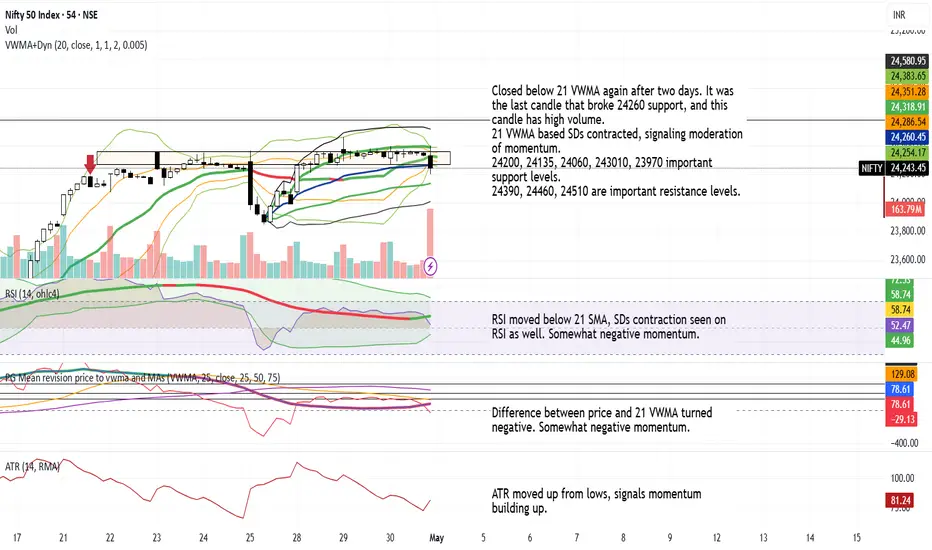
Nifty closing Near 24350, consolidation on daily n hourly chartsNifty has been closing near 24300-24360 for past few sessions. Today's closing is in consolidation zone, with big volume. A breakout may give a decisive move sometime soon.
54 mins. based chart is signals weakness but daily chart is neutral to somewhat strong. Back-to-back Dojis signal indecisiveness among participants.
Nifty trying to break trendline resistance. As depicted yesterday we are near the trendline resistance. These trendline resistance like Mother and Father resistances are not easy to break but once broken they become a massive support zone. Nifty as we saw today is trying to break this trendline resistance which is there near 24359. Once this resistance will be crossed and we get a closing above the same we can see Nifty move swiftly towards 24538 and 24816. After closing above 24816 Nifty can move towards capturing 25K level back. Supports for Nifty remain at 23980 and 23708. Below 23708 we have the Mother and Father line support near 23365 and 23424. To know more about Mother Father and Small Child theory. To learn it to master it. Read my book. The Happy Candles Way To Wealth Creation available on Amazon in Paperback and Kindle version.
Disclaimer: The above information is provided for educational purpose, analysis and paper trading only. Please don't treat this as a buy or sell recommendation for the stock or index. The Techno-Funda analysis is based on data that is more than 3 months old. Supports and Resistances are determined by historic past peaks and Valley in the chart. Many other indicators and patterns like EMA, RSI, MACD, Volumes, Fibonacci, parallel channel etc. use historic data which is 3 months or older cyclical points. There is no guarantee they will work in future as markets are highly volatile and swings in prices are also due to macro and micro factors based on actions taken by the company as well as region and global events. Equity investment is subject to risks. I or my clients or family members might have positions in the stocks that we mention in our educational posts. We will not be responsible for any Profit or loss that may occur due to any financial decision taken based on any data provided in this message. Do consult your investment advisor before taking any financial decisions. Stop losses should be an important part of any investment in equity.

Nifty levels - May 02, 2025Nifty support and resistance levels are valuable tools for making informed trading decisions, specifically when combined with the analysis of 5-minute timeframe candlesticks and VWAP. By closely monitoring these levels and observing the price movements within this timeframe, traders can enhance the accuracy of their entry and exit points. It is important to bear in mind that support and resistance levels are not fixed, and they can change over time as market conditions evolve.
The dashed lines on the chart indicate the reaction levels, serving as additional points of significance to consider. Furthermore, take note of the response at the levels of the High, Low, and Close values from the day prior.
We hope you find this information beneficial in your trading endeavors.
* If you found the idea appealing, kindly tap the Boost icon located below the chart. We encourage you to share your thoughts and comments regarding it.
Wishing you success in your trading activities!
Nifty Momentum may lead it to 44000 levelNifty monthly chart is showing a rapid growth since last 5 years, this momentum may lead it to these levels 28000, 36000 and 44000 levels.

#Nifty 30th April levels checkout is levels #Nifty 30th April levels checkout special my levels
100 percent working levels and giving weekly levels also
check and tell everyone
#NIFTY Intraday Support and Resistance Levels - 30/04/2025Gap up opening expected in nifty near 24450 level. Currently nifty consolidating in the range of 24250-24500 level. After opening if nifty starts trading and sustain above 24500 level then possible strong upside rally towards the 24750+ level in today's session. 24250 level will act as a strong support for today's session. Any major downside only expected if nifty starts trading below 24200 level. This downside can goes upto 24000 level.

Nifty Trend directtionNifty 24335 has DAY resistance at 24560 and Support at 24070.
Intraday Resistance at 23449.
As Nifty has closed below the resistance we expect Nifty to go down by 200 points

Gap up entry ruined the structure! What’s next!?As we can see the strong opening ruined the head and shoulders structure and couldn’t continue its uptrend and fell unidirectionally and later continuing sideways. Now we can expect NIFTY to again test the neckline before finally breaking out for unidirectional move so plan your trades accordingly and keep watching

$NIFTY50back to reality and as expected nifty has bounced nicely
was thinking we go take liquidity1 below vwap first then go for the equal highs
looks like it wants 24694 liquidity first
plan is to risk off around liquidty 2 level since have been 90% in equity so would ike to free up some cash/ammo
acceptance below blue line then we likely go for vwap below

Nifty --->> downside towards 24,250 and 24,000 levels ??Today, Nifty marked an intraday high of 24,570 during the morning session and did not retest or offer any significant retracement thereafter.
The index has breached the white support trendline, indicating the potential for further downside towards 24,250 and 24,000 levels. With the market closed on May 1st, Nifty may remain range-bound with a negative bias in the coming session.