NEXT STOP 23800..??As we can see NIFTY has broken and sustained itself above all our supply zones confirming the bullish bias but yet to close its weekly candle above the given supply zone. If it closes then every dip can be bought for new ATH in NIFTY so plan your trades accordingly and keep watching everyone.
NIFTY trade ideas

Trading Tutorial Video for 23-04-2025Trading update for today on Index Nifty and Bank Nifty How one could have traded Nifty and Bank Nifty by following the process If someone is interested in trading stocks, pl leave the name of the stock in Comments section I will cover it in the video

Nifty Analysis EOD - April 23, 2025🟢 Nifty Analysis EOD - April 23, 2025 🔴
"Hanging Man Candle on Bullish Trend—Pause or Plot Twist?"
📊 Market Recap:
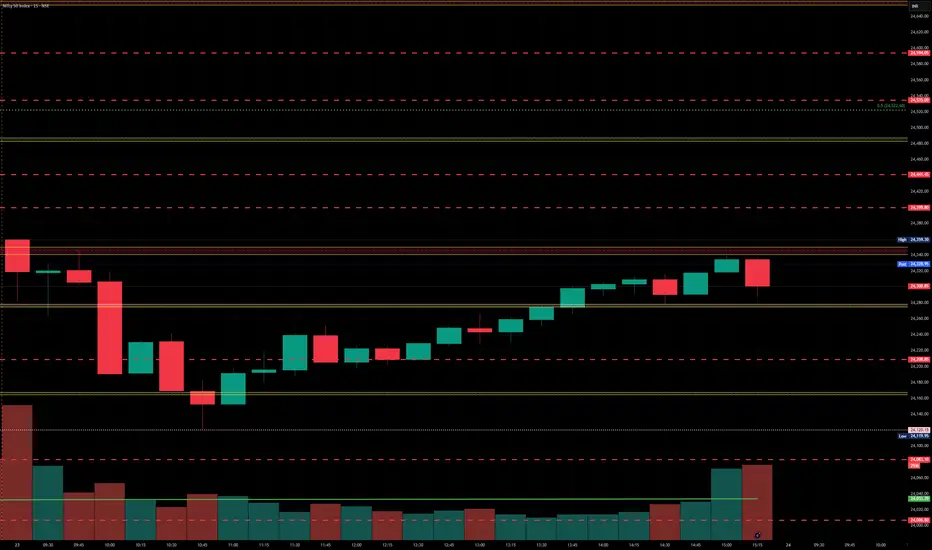
As anticipated from the ongoing bullish structure, Nifty opened with a strong Gap-Up at 24,357, adding +192 Points (+0.79%) to the charts. However, what looked like a continuation day quickly turned cautious. The initial candle marked the day’s high (Open = High scenario, nearly exact) and started a gap-filling move, pushing prices back to CPR.
The market respected CPR as a support, then moved back towards its mean (VWAP) where the PDH + R1 zone resisted price action effectively until 1 PM. Post that, Nifty finally broke out, sustained above the zone, and closed at 24,300—still holding gains despite a red candle, which visually seems bearish but technically closes above VWAP + PDH. Hence, a hidden bullish undertone remains.
🕯 Daily Candle Check: Is It a Hanging Man?
A textbook Hanging Man candle appears to have formed on the Daily Chart—a bearish reversal pattern that shows potential weakness at the top of a rally.
📌 Candle Stats:
Body: 28 points
Lower Shadow: 209 points
Upper Shadow: 2 points
Shadow-to-body ratio: 209 / 28 = 7.4x
✅ Trend Context: Yes, uptrend present
✅ Candle Structure: Meets all parameters
👉 Verdict: Confirmed Hanging Man Candle
This hints that selling pressure is gradually creeping in while buying strength might be exhausting. But a Hanging Man alone isn't a trade trigger—confirmation is key. So we watch tomorrow’s session to decide whether it’s just a pause or a trend shift.
📈 Intraday Insight: Head & Shoulders Pattern
During the session’s consolidation and bounceback phase, a Head & Shoulders pattern played out intraday with its target being 24,300—achieved successfully by EOD.
🔍 Pattern Recap:
This bullish reversal structure shows three dips, with the central one (head) being the deepest and two shallower ones (shoulders). A break above the “neckline” confirmed bullishness—supporting the rebound above VWAP.
📌 Gladiator Strategy Update
ATR: 350.19
IB Range: 94.75 (Small IB)
Market Structure: Imbalanced
🎯 Trade Highlights:
First Trade: Short – Triggered at 10:05 AM — ✅ 1:1.5 Target Achieved
Second Trade: Long – Triggered at 13:40 PM — ✅ 1:1.5 Target Achieved
Additional Trade (H&S Pattern): Long – Triggered at 11:40 AM — ✅ Pattern Target Achieved
🧠 Index Performance Snapshot:
Nifty 50: +161 Points (+0.67%)
Bank Nifty: -277 Points (-0.5%), but a new ATH at 56,098
Nifty 500: +152 Points (+0.69%)
Midcap: +644 Points (+1.18%)
Smallcap: +74 Points (+0.44%)
📌 Key Levels to Watch
📍 Resistance Zones:
24,330 ~ 24,360
24,480 ~ 24,540
24,800
📍 Support Zones:
24,190 ~ 24,225
23,950 ~ 24,000 (Immediate)
23,820
23,660 ~ 23,710
23,500
23,400 ~ 23,430
23,200 ~ 23,190
🧭 Final Thoughts:
"Reversal or Reset? Structure is key. When levels work, respect them. When they break, adapt."
✏️ Disclaimer ✏️
This is just my personal viewpoint. Always consult your financial advisor before taking any action.

Bearish Divergence in Nifty – 30-Min Chart Signals CautionNifty’s been grinding higher on the 30-minute chart, printing fresh highs—but RSI isn’t buying it.
🟢 Price: Higher highs
🟣 Oscillator: Lower highs
That’s a classic bearish divergence—a potential red flag for an upcoming correction.
Momentum is fading even as price climbs. This usually hints that the trend’s running on fumes. A short-term pullback or pause in the rally could be just around the corner.
💡 Traders: Watch for confirmation, consider tightening stops, and don’t get caught chasing highs blindly.

Nifty Analysis & Trade Plan for tomorrow, Thursday, 24th AprilNifty Analysis & Trade Plan for tomorrow, Thursday, 24th April

Nifty levels - Apr 24, 2025Nifty support and resistance levels are valuable tools for making informed trading decisions, specifically when combined with the analysis of 5-minute timeframe candlesticks and VWAP. By closely monitoring these levels and observing the price movements within this timeframe, traders can enhance the accuracy of their entry and exit points. It is important to bear in mind that support and resistance levels are not fixed, and they can change over time as market conditions evolve.
The dashed lines on the chart indicate the reaction levels, serving as additional points of significance to consider. Furthermore, take note of the response at the levels of the High, Low, and Close values from the day prior.
We hope you find this information beneficial in your trading endeavors.
* If you found the idea appealing, kindly tap the Boost icon located below the chart. We encourage you to share your thoughts and comments regarding it.
Wishing you success in your trading activities!
1/A wave done on the upside. 2/B down underway?Too early to say but NSE:NIFTY seem to have completed wave 1/A and has potentially started wave 2/B down which should hit 23400-23300 zone at the minimum, which happens to be 38.6% retracement of the rise 1/A.

23 Nifty new update level New support 24278 strong
New ragistanc 24460
2nd ragistanc 24670
3rd ragistanc 24960

#NIFTY Intraday Support and Resistance Levels - 23/04/2025Gap up opening expected in nifty. After opening if nifty sustain above 24250 level then upside rally upto 24500+ level expected in index. Upside 24500 level will act as a strong resistance for today's session. Any further strong rally only expected after breakout of this level. Any downside movement only expected if nifty starts trading below 24200 level.

A doji at the top in Nifty. Reversal? 22nd April nifty daily candle formed a Doji at the top of the rally. It's a sign to be cautious. We can see a retracement of nifty back to 24121 (Spot) which is a fibo level. Once it touches that we can see what will happen next. Even a gapup today don't be bullish and be watchful of price action. With bad news coming through we can see a retracement happening.

Nifty view 22 April 25Observing nifty50, seems like it has started changing the character and there is a turnaround possibility. Going to move up with a little pull back.

NIFTY facing rejection!?As we can see NIFTY is showing signs of rejection from our zone despite being strong forming a doji kinda candlestick. Now following the global cues, we can expect NIFTY to open stronger but hitting the even strong supply zone after filling the gap which can lead to further fall after strong opening so plan your trades accordingly and keep watching.

INDIA WAVE B OR 2 TOP EXIT NOW !!The Chart posted is the nifty 50 India market .I am now turning Bearish As we seem to be ending my alt Wave count for wave C up in the ABC rally . We are now at HIGH RISK if this turns Down . Best of Trades WAVETIMER

NIFTY 50 KEY LEVELS FOR 23/04/2025// All credit goes to Tony for the concept of this indicator. His Trading View link: tradingview.com/u/tony_fx_sm/
// Note: The calculation method in this indicator differs from Tony's, but the concept is derived from his work.
I want to make it clear that I am not a seller, and this method was not taught to me by anyone. The original creator only gave me one clue:
👉 "If you get one level, you get all levels."
Everything else—the way I nail it the method and applied it—is my own work. I respect the original idea, but my approach is independent.
Explanation:
This trading system helps you avoid blind trades by providing confirmation for better entries and exits.
Entry/Exit Points:
- Entry/Exit Lines: Use the BLACK line for long trades and the RED line for short trades, based on confirmation from your trading plan.
- Stop Loss: For long trades, set the stop loss at the RED line below. For short trades, set it at the BLACK line above.
- Take Profit: For long trades, target the next RED line above. For short trades, target the next BLACK line below.
Timeframe:
Use a 5 mins timeframe for trading.
Risk Disclaimer:
This setup is for educational purposes. I'm not responsible for your gains or losses. Check the chart for more details

Nifty 24167 Trend directionNifty 24167 has given possibly for an evening star pattern. Support is at 23628 and if tomorrow's trade was below 24164 it will confirm the evening star pattern and would open the bearish gate.
FII's have added Future contracts while winding up PUTS .
78 K Net contracts are yet to be closed by FII's
So we expect Nifty will be moved up to complete the further more PUTS windup

Nifty 50 Movement Update for 23/04/2025Support: The chart indicates a support level at ₹24250 for 23/04/25.
Resistance: The chart indicates a resistance level at ₹24500 for 23/04/25.
Gap Up: There is a gap up visible on the chart around the ₹24270 level for 23/04/25.
It's important to remember that these levels are based on the technical analysis presented in this specific chart. Market conditions can change, and these levels might be tested or broken on the actual trading day.

Nifty Analysis EOD - 22nd April 2025🟢 Nifty Analysis EOD - 22nd April 2025 🔴
🧠 Market Background:
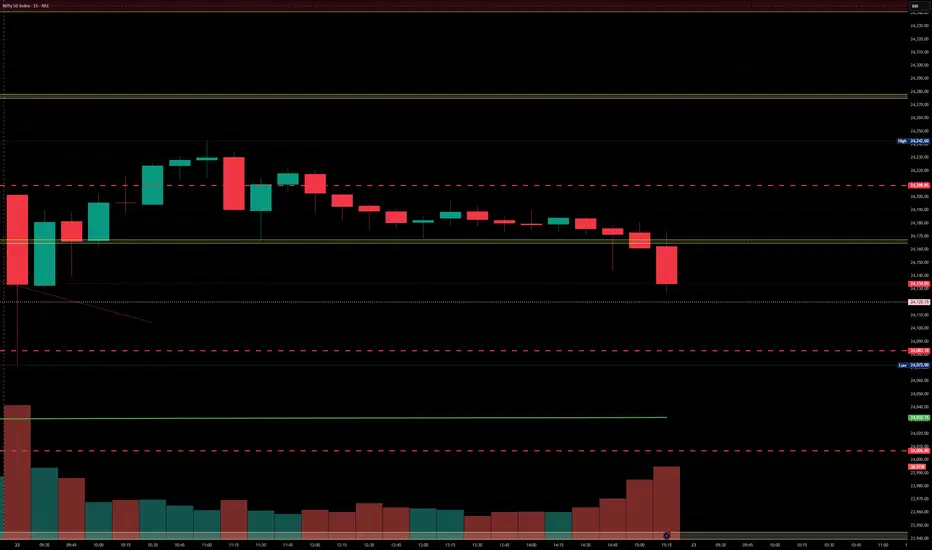
As highlighted in the previous session analysis, we were expecting a range-bound or narrow-range trading day — and that’s exactly what played out.
Nifty opened at 24,185, right below the resistance zone where yesterday’s session had consolidated heavily. Early in the session, price fell below the Previous Day Close (PDC) and took support exactly at the Central Pivot Range (CPR) before staging a sharp move up — breaking both Current Day High (CDH) and Previous Day High (PDH).
However, the 24,225 resistance zone acted as a speed breaker, pushing prices back down toward VWAP, which then provided a solid support base. Until around 2:45 PM, Nifty kept forming higher lows, giving hopes for continuation — but then broke the previous swing low, forming a new lower low into the close.
📊 Price Action Insight:
Day closed above the CPR zone, which still favors the bullish structure
However, on the daily timeframe, a near-perfect Doji candle has formed, with just a 9-point body, indicating indecision or a pause in the trend
The intraday range was 170 points, noticeably lower than Nifty’s average range, hinting at contraction
In such a case, trading the Doji becomes simple — wait for either high or low to break, but also consider nearby support/resistance confluence for better edge
🎯 Strategic Outlook:
A retracement towards 23,660–23,710 or even 23,200 can’t be ruled out — although it's early to confirm
Broader sentiment stays bullish, but this Doji suggests a pause or potential reversal — so caution near upper zones is advised
Keep tracking key global cues and sector rotation — especially with Midcaps and Smallcaps showing strong resilience
📌 Gladiator Strategy Update
ATR: 362.5
IB Range: 129.65 (Medium IB)
Market Structure: Balanced
Long Trade Triggered at 10:30 AM — ✅ 1:1.5 Target Achieved
Second Long Entry at 11:40 AM — ❌ SL Hit
📈 Index Performance
Nifty: +42 Points (+0.17%)
Bank Nifty: 🔼 New All-Time High at 55,961, closing at 55,647 (+342 pts / +0.6%)
Nifty 500: +79 Points (+0.36%)
Midcap: +422 Points (+0.78%)
Smallcap: +122 Points (+0.73%)
📌 Key Levels to Watch
🔺 Resistance Zones
• 24,190 ~ 24,225
• 24,330 ~ 24,360
• 24,480 ~ 24,540
🔻 Support Zones
• 23,950 ~ 24,000 (Immediate support)
• 23,820
• 23,660 ~ 23,710
• 23,500
• 23,400 ~ 23,430
• 23,200 ~ 23,190
🧘♂️ Final Thoughts
"Structure is key. When levels work, respect them. When they break, adapt."
Stay level-headed, stay prepared. Let the market show you the way.
✏️ Disclaimer ✏️
This is just my personal viewpoint. Always consult your financial advisor before taking any action.

Nfity levels - Apr 23, 2025Nifty support and resistance levels are valuable tools for making informed trading decisions, specifically when combined with the analysis of 5-minute timeframe candlesticks and VWAP. By closely monitoring these levels and observing the price movements within this timeframe, traders can enhance the accuracy of their entry and exit points. It is important to bear in mind that support and resistance levels are not fixed, and they can change over time as market conditions evolve.
The dashed lines on the chart indicate the reaction levels, serving as additional points of significance to consider. Furthermore, take note of the response at the levels of the High, Low, and Close values from the day prior.
We hope you find this information beneficial in your trading endeavors.
* If you found the idea appealing, kindly tap the Boost icon located below the chart. We encourage you to share your thoughts and comments regarding it.
Wishing you success in your trading activities!
Trading Tutorial for 22nd April 2025 Trading update for today on Index Nifty How one could have trades Nifty by following the process As a bonus, I have added and discussed banknifty also Enjoy the video

Nifty Analysis EOD – 21st April 2025 🟢 Nifty Analysis EOD – 21st April 2025 🔴
After the surprise expiry rally… comes the slowdown!
📌 Background
After the stunning 414-point move on the weekly expiry day, Friday’s holiday break created the perfect breather. The key question heading into Monday was:
“Will Nifty carry forward its momentum and breach 24,050? Or pause for breath?”
Turns out, the market chose both – initial enthusiasm, followed by exhaustion and consolidation.
📌 Today’s Price Action
Nifty opened at 23,949, right at the resistance zone of 23,950 ~ 24,000.
➤ The IB High was formed at 24,052, triggering a textbook IB Breakout just above the 200 SMA zone.➤ Price moved swiftly towards 24,188 – the Previous Highest Swing Close, and then... paused.
From there, a 50-minute tight consolidation followed – one of the narrowest ranges seen in recent sessions, signaling a temporary equilibrium between buyers and sellers.
Despite the bullish open and early breakout, Nifty closed at 24,133, just below the major resistance.
📊 Gladiator Strategy Parameters
ATR: 383.83
IB Range: 134.20
IB Type: Medium IB
IB Day: IB Breakout
Market Structure: Imbalanced
As per the Nifty Gladiator Strategy, the IB Breakout triggered around 10:45 AM, and the 1x IB target was achieved with clean follow-through.
📌 Technical Observations
📈 On the Daily Timeframe:
RSI stands at 65.53, now forming a potential RSI divergence.
Short RSI (3 of 3) is in the overbought zone.
Momentum remains intact, but the range is cooling off, cautioning intraday traders of potential traps ahead.
👉 A narrow range session or a false IB breakout is likely in the coming session.
📈 Index Performance
Nifty: +274 Points (+1.15%)
Bank Nifty: New All-Time High at 55,461, closing at 55,295 (+1.87% / +1,014 points)
Nifty 500: +324 Points (+1.5%)
Midcap: +1,316 Points (+2.5%)
Smallcap: +363 Points (+2.2%)
Broader market sentiment remained strong and outperformed Nifty.
📌 Important Levels to Watch
🔼 Resistance Zones
➤ 24,190 ~ 24,225➤ 24,330 ~ 24,360➤ 24,480 ~ 24,540
🔽 Support Zones
➤ 23,950 ~ 24,000 (now immediate support)➤ 23,820➤ 23,660 ~ 23,710➤ 23,500➤ 23,400 ~ 23,430➤ 23,200 ~ 23,190
🧠 What’s the Trade Setup Now?
Don’t be overly bullish at highs – wait for follow-through or failed breakout confirmation.
If price holds above 24,190, then 24,330/24,480 becomes achievable.
Failure to sustain above 24,050 could trap late bulls.
Let Tuesday’s opening structure guide your bias.
🧘 Final Thought"Structure is key. When levels work, respect them. When they break, adapt."
Stay alert as we approach higher resistance zones—momentum remains but risk of whipsaws rises.
✏️ DisclaimerThis is just my personal viewpoint. Always consult your financial advisor before taking any action 🙏

Nifty at key Resistance - Pullback or Breakout !!!
Nifty is currently trading around the important resistance zone of 24,250, which has acted as a supply level in the past. This zone is critical, and the market’s reaction here can guide the next leg of the move.
What to Watch:
Price is testing this resistance after a strong upmove.
If 24,250 holds, we may see a pullback or even a short-term reversal.
If the price breaks and sustains above 24,250, it would confirm bullish strength, and we can expect the next upside target near 24,750.
🔍 Key Levels:
Resistance: 24,250 (current test zone)
Support (pullback zone): 24,050 – 23,850
Next Bullish Target (if breakout holds): 24,750
What I'm Watching:
Price action and rejection patterns near 24,250
Volume confirmation on breakout
Candle structure for signs of exhaustion or momentum
Keep an eye on this level — the next few candles could give us important clues.
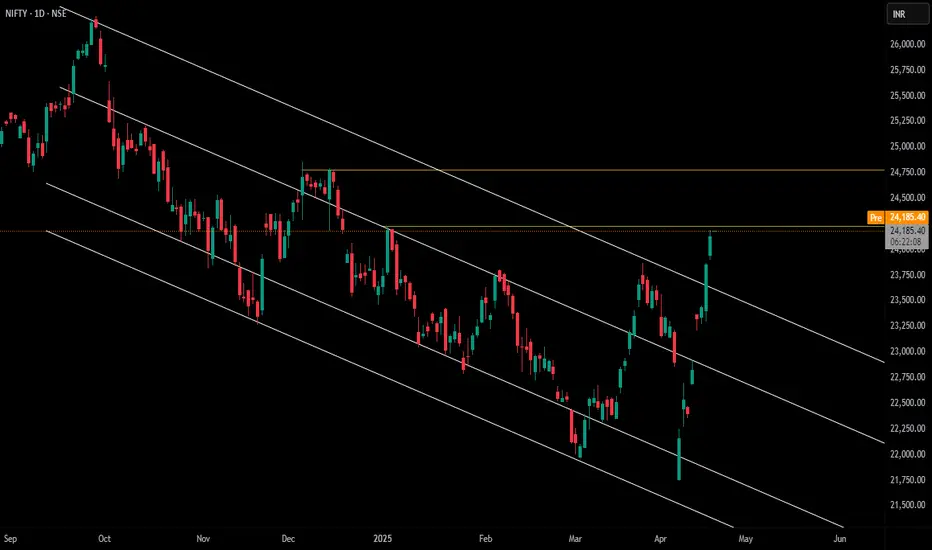
Nifty Probable Path for next 2 monthsNifty May spend some time till July August before beginning another 15% sell off.

#NIFTY Intraday Support and Resistance Levels - 22/04/2025Today slightly gap up opening expected in nifty. After opening if nifty starts trading above 24250 level then expected further bullish rally upto 24500+ level in today's session. 24000-24200 level will act as a consolidation zone for today's session. Any major downside only expected below 24000 level.
