$nifty50rsi cross and nice engulfing candle likel heading to test range high above then may just take liquiidty and deviate back either way planning on derisking some and keeping some ammo to buy lower with oompa lumpa surely going to give us opportunities .
either way still recon new highs Q3 onwards so BTFD and no fear
NIFTY trade ideas

Nifty 50 at a Turning Point? Key Levels & Market Outlook AheadThe Nifty 50 ended the week at 25,112.40 with a gain of 1.59%
If Nifty sustains below 25,033, selling pressure may increase. However, a move above 25,192 could restore bullish momentum.
Key Levels for the Upcoming Week
🔹 Price Action Pivot Zone:
The crucial range to watch for potential trend reversals or continuation is 25,033 -25,192.
🔹 Support & Resistance Levels:
Support:
S1: 24,797
S2: 24,482
S3: 24,093
Resistance:
R1: 25,431
R2: 25,750
R3: 26,144
Market Outlook
✅ Bullish Scenario: A sustained breakout above 25,192 could attract buying momentum, driving Nifty towards R1 (25,431) and beyond.
❌ Bearish Scenario: A drop below 25,033 may trigger selling pressure, pushing Nifty towards S1 (24,797) or lower.
Disclaimer: lnkd.in

Nifty Chart Analysis – Major Breakout or Breakdown Ahed
Assending Triangle Chart pattern in Nifty- Breakout Possible ?
As of June 21, 2025, the Nifty 50 index is showing a strong and potentially decisive Ascending Triangle Pattern on the 3-hour time frame.
This formation typically indicates a bullish breakout if confirmed with volume. Let’s dive deep into the technical outlook and key levels that traders and investors should watch.
Current Market Overview
Current Nifty Level: ~25,080
Pattern Identified: Ascending Triangle
Time Frame: 3H (Medium-Term to Long-Term Insight)
An Ascending Triangle is a bullish continuation pattern formed by a horizontal resistance line and a rising trendline of higher lows.
Key Levels to Watch
Resistance Zone:
Immediate Resistance: 26,280 (All-Time High)
Breakout Target 2: 27,280
Breakout Target 3: 28000 (Long-Term)
If Nifty breaks above the 26,280 level with strong volume confirmation, the next upward targets will be 27,280 and possibly 28000 , based on the measured move from the triangle height.
Support Levels:
Latest Support: 24,250
Post-Election Breakout Support: 22,800
Major Support (Election Result Day Low): 21,300
If any major negative trigger (geopolitical or macroeconomic) occurs, a sharp correction can’t be ruled out. The levels mentioned will act as key demand zones.
Potential Global Risks
While the technical setup is bullish, external risks could spoil the party:
Geopolitical Conflicts:
Iran vs. Israel
India vs. Pakistan
China vs. US tensions
Macro-Economic Triggers:
Spike in Inflation or Crude Oil Prices
US Fed Rate Hike Surprises
Global Recession Fears
In such cases, a steep fall toward 22,800 or even 21,300 may occur.
✅ Conclusion & Strategy
The current Nifty setup presents a classic high-reward-low-risk opportunity for long-term traders if a breakout is confirmed. However, caution is advised if global uncertainties increase. Investors should:
Wait for a decisive breakout above 26,280 with volume.
Maintain a stop-loss around 24,250 on long positions.
Consider booking partial profits near resistance levels and re-entering on pullbacks.
How Traders Can Prepare for the Next Move
Whether a breakout or breakdown happens, traders must:
Use proper stop-loss and risk management
Wait for volume confirmation
Watch for FII/DII activity
Combine price action with Data Analysis
Important Note:
This analysis is based on current chart patterns and known global events. Always use proper risk management and consult with a financial advisor before taking investment decisions.
💬 Like the chart if you found it useful
🗣 Comment your views or questions
👤 Follow us for regular breakout updates
🔁 Share this chart with your trading community and friends who follow Nifty!
✅ Let’s grow together with smart chart analysis and technical strategies.

18 june Nifty50 brekout and Breakdown leval
CALL (CE) – Bullish triggers
↑ 24,437 – 24,547 : Safe‑zone long entry
↑ 24,672: Hold CE while above this mark
↑ 24,780 : Opening‑S1 breakout, keep holding CE
↑ 24,930.00 : Turns bias positive; fresh CE can be added
↑ 25,083.00 : Entry level for aggressive longs
↑ 25,318.00 : Short‑cover zone; strong upside momentum possible
PUT (PE) – Bearish triggers
↓ 25,318.00 : If price closes back under, shift to PE (safe)
↓ 25,083 : PE in the “risky” reversal zone
↓ 24,930 : Bias flips negative; keep/add PE
↓ 24,780 : Opening‑R1 break; hold PE
↓ 24,672 : Continue PE below this level
↓ 24,535 : Unwinding zone – watch for fast drops
↓ 24,437 : Final downside support; trail PEs here

NIFTY MAY HIT 25800 in JUNE 2025I am posting this just to record my analysis. I am using some logics to analyze and forecast moves. You may find it interesting that yes with true logic and observation on data pattern and chart pattern, yes it possible to forecast at some extend.
May be I will be wrong but it's all about probability, it's in 28% probability of winning but with a high reward.
Don't take any trade or financial action based on this. It's just a post of idea and knowledge sharing.
Thanks for reading.
Bye.

#NIFTY Intraday Support and Resistance Levels - 23/06/2025A flat opening is expected in Nifty today. If Nifty sustains above the 25,050–25,100 zone after the open, we can expect an upside rally toward 25,150 → 25,200 → 25,250+ levels. This bullish momentum may continue if Nifty remains strong above 25,100.
However, any downside momentum may begin if Nifty starts trading below 24,950, which is a crucial support zone. In such a scenario, the index could slip toward 24,850 → 24,800 → 24,750- levels.
For intraday trades, focus on breakout or breakdown levels, and manage risk with trailing stop-losses in place.

#Nifty - Pivot Point is 24850.48 | 23597.30 or 26103.65?Date: 06-06-2025
#Nifty Current Price 25000
Pivot Point: 24850.48 Support: 24548.09 Resistance: 25154.65
Upside Targets:
Target 1: 25360.61
Target 2: 25566.58
Target 3: 25835.11
Target 4: 26103.65
Downside Targets:
Target 1: 24341.23
Target 2: 24134.375
Target 3: 23865.8375
Target 4: 23597.30

Nifty levels - Jun 24, 2025Nifty support and resistance levels are valuable tools for making informed trading decisions, specifically when combined with the analysis of 5-minute timeframe candlesticks and VWAP. By closely monitoring these levels and observing the price movements within this timeframe, traders can enhance the accuracy of their entry and exit points. It is important to bear in mind that support and resistance levels are not fixed, and they can change over time as market conditions evolve.
The dashed lines on the chart indicate the reaction levels, serving as additional points of significance to consider. Furthermore, take note of the response at the levels of the High, Low, and Close values from the day prior.
We hope you find this information beneficial in your trading endeavors.
* If you found the idea appealing, kindly tap the Boost icon located below the chart. We encourage you to share your thoughts and comments regarding it.
Wishing you success in your trading activities!
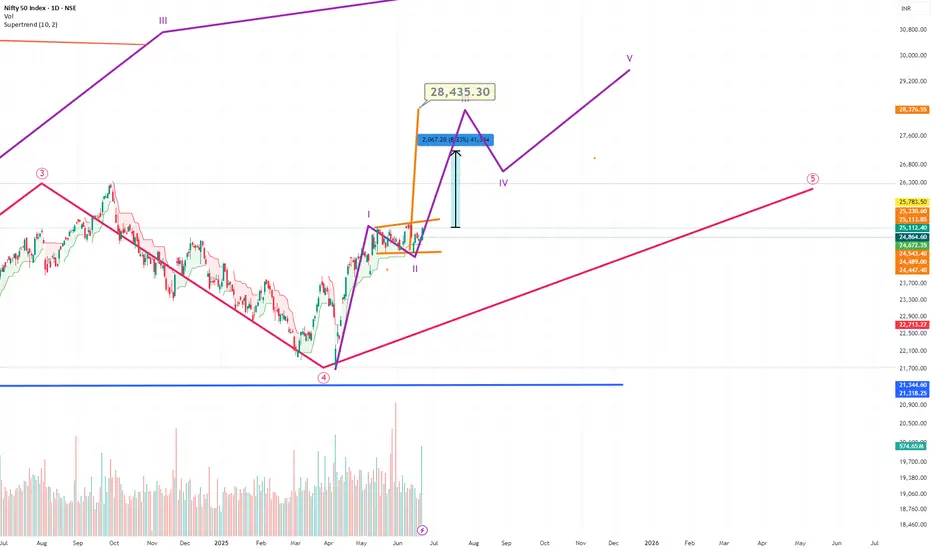
NIFTY Future path..Up to 28000Please note that Nifty is in a medium 5th wave..in which it is completed or completing its 2nd wave...that means we will have a 3rd wave up to 28000 Minimum...as per Neo waves..calculated by adding 1.l618 of the 1st wave...tgt is 28400 minimum....Remember mkts have climbed walls of worry....which is a sign of bullish markets...
#NIFTY Intraday Support and Resistance Levels - 20/06/2025A flat opening is expected in Nifty today. After the open, all eyes will be on the 24,700 level, which has acted as a key support zone recently.
🔽 If Nifty starts trading below 24,700, downside momentum may pick up, with potential targets at 24,650 → 24,600 → 24,550-. Sustained weakness below 24,700 could attract short positions.
🔼 On the upside, if Nifty reclaims 24,750–24,800 and sustains, a bullish move may trigger toward 24,850 → 24,900 → 24,950+. However, 24,950 remains a strong resistance area from the past sessions.
⚠️ Strategy Note:
Market remains in a range-bound zone; wait for a decisive breakout for positional trades.
Use strict stop-losses and manage risk actively.
Ideal approach: scalp the range with quick profit booking unless a directional move confirms.

Great recovery by Nifty to end the week. Nifty has shown a great recovery to end the week at 25112 despite persisting global uncertainties. This again shows imminent strength of Indian markets and confidence on the local factors by Bulls.
Nifty however is now entering a tough resistance zone which starts exactly from 25113 and extends till 25251. Once we get a closing above 25251 the Bulls will try to control the market with more strength. Till that happens it can still go in any direction. The supports for Nifty remain at 24869, 24713, 24480 (Mother line support), 24175 and finally 23838 (Father line support).
If any major further global escalation happens during the weekend and we get a closing below 23838 then Bears can become more powerful and they might have potential to push market further down towards 23047 or below.
Things hang in balance despite a strong closing on Friday as the shadow of the candle is still neutral.
Disclaimer: The above information is provided for educational purpose, analysis and paper trading only. Please don't treat this as a buy or sell recommendation for the stock or index. The Techno-Funda analysis is based on data that is more than 3 months old. Supports and Resistances are determined by historic past peaks and Valley in the chart. Many other indicators and patterns like EMA, RSI, MACD, Volumes, Fibonacci, parallel channel etc. use historic data which is 3 months or older cyclical points. There is no guarantee they will work in future as markets are highly volatile and swings in prices are also due to macro and micro factors based on actions taken by the company as well as region and global events. Equity investment is subject to risks. I or my clients or family members might have positions in the stocks that we mention in our educational posts. We will not be responsible for any Profit or loss that may occur due to any financial decision taken based on any data provided in this message. Do consult your investment advisor before taking any financial decisions. Stop losses should be an important part of any investment in equity.

Nifty 50 Trapped in a Tight Range – Breakout or Breakdown Ahead?📍 Market Overview:
For over a month now, the Nifty 50 Index has been moving sideways in a tight consolidation range, frustrating both bulls and bears. Since May 12, 2025, the index has fluctuated between 24,350 on the lower side and 25,250 on the upper side, forming a classic rectangular pattern often associated with accumulation or distribution phases.
This zone is now becoming a crucial battlefield that could define the index’s direction for the coming sessions.
🔲 The Consolidation Zone
Support Zone: 24,350 – 24,450
Resistance Zone: 25,150 – 25,250
Consolidation Duration: ~30+ days
Current Price: 24,793.25
This range has seen multiple rejections at the top and bottom, reflecting indecisiveness in broader market sentiment. Traders are waiting for a trigger — either fundamental or technical — that could push the index out of this range with strength.
📈 Bullish Scenario: Breakout Above 25,350
If Nifty 50 breaks and sustains above 25,350, especially with higher volume and a strong daily close, it could signal a bullish continuation pattern. This scenario would be supported by:
A potential breakout from the rectangle consolidation.
Positive sentiment from global markets or domestic catalysts (monsoon, earnings, policy announcements, etc.)
A shift in FII or DII buying behavior.
📌 Breakout Target:
👉 26,000 – 26,100 (Based on measured move projection)
📌 Next Resistance Zone:
👉 26,050 – 26,200
In this case, traders may look for long opportunities with trailing stop-losses under the breakout zone.
📉 Bearish Scenario: Breakdown Below 24,350
On the flip side, a decisive breakdown below the 24,350 mark, especially with increased selling pressure and bearish candles, may lead to a quick decline toward the next major support levels.
📌 Breakdown Target:
👉 23,550 – 23,400
📌 Next Support Zone:
👉 23,500 – 23,300
This could trigger panic selling or profit-booking in frontline stocks. Caution is advised in such scenarios, and shorting opportunities may arise for experienced traders.
🧠 Strategic Insights for Traders
Avoid trading within the range: Unless you're scalping, wait for breakout/breakdown.
Watch global cues and FII flows: They often align with large breakouts.
Stick to risk management: Whichever direction the index moves, always set a stop loss.
🚀 Final Thoughts
The market is clearly in a wait-and-watch phase, but such consolidation periods often precede large moves. Nifty’s current structure suggests a breakout or breakdown is imminent — and being positioned correctly can make a big difference in returns.
Stay alert. Don’t predict — prepare.
⚠️ Disclaimer
This article is for educational and informational purposes only and does not constitute financial advice or a recommendation to buy or sell any securities. Trading and investing in the stock market involve risk, including the risk of losing capital. Always conduct your own research or consult with a qualified financial advisor before making any trading decisions. We are not responsible for any losses incurred from decisions based on this analysis.

#NIFTY Intraday Support and Resistance Levels - 19/06/2025Today, a flat opening is expected in Nifty around the 24,800 level. The index continues to trade within a narrow range, indicating market indecision and potential consolidation.
🔼 On the upside, if Nifty sustains above the 24,750–24,800 zone, it may trigger a bullish move toward 24,850 → 24,900 → 24,950+. Sustained strength above 24,950 can further open room for a breakout.
🔽 On the downside, if the index slips below 24,700, a short opportunity may arise toward 24,650 → 24,600 → 24,550-. Breach of 24,550 could lead to deeper correction.
⚠️ Key Notes:
The market is likely to remain range-bound and volatile.
Reversals from resistance and support levels are possible.
Trade with a strict stop loss and manage positions actively.

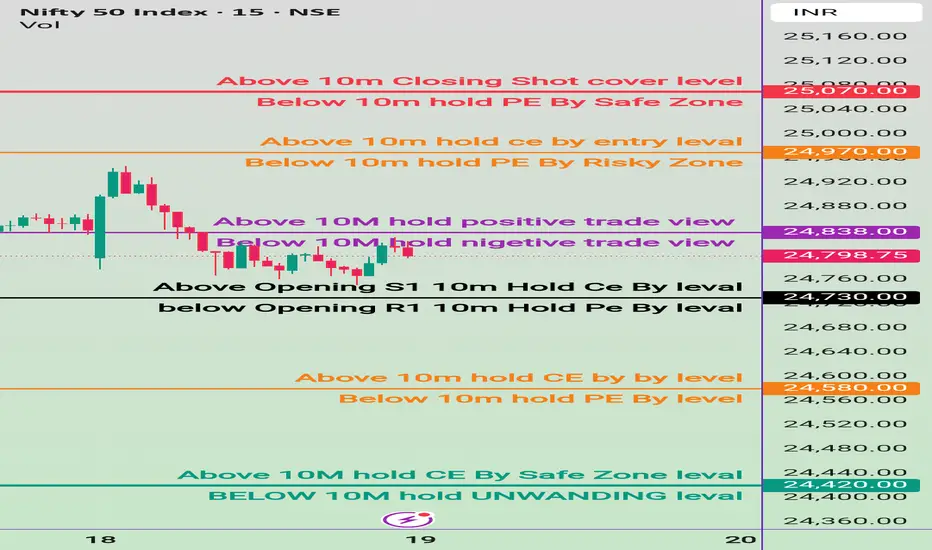
19 june Nifty50 brekout and Breakdown leval
✅ Safe Buy Zone (Support Levels):
24,437.70 → Above 10M: Hold CE by Safe Zone Level
24,420.00 → Below 10M: Hold Unwinding Level
→ Breach below could trigger unwinding / profit booking.
🔴 Resistance & Bearish PE Zones:
25,070.00 – Above 10m closing: Short Cover Level
→ Strong resistance; if crossed and sustained, short covering possible.
24,970.00 – Above 10m: Hold CE by Entry Level
→ Bullish entry confirmation level.
24,838.00 – Above 10M: Hold Positive Trade View
→ Indicates shift to bullish bias if held above.
⚫ Opening Based Levels:
24,730.00
→ Above Opening S1: Hold CE by Level
Below Opening R1 (level not clearly marked with value but appears near 24,730)
→ Hold PE by Level
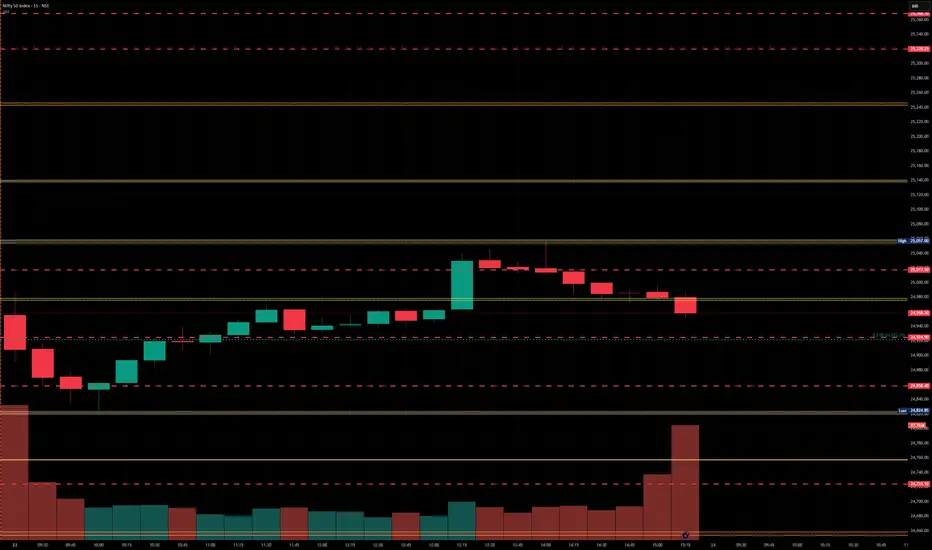
Nifty Analysis EOD – June 20, 2025 – Friday🟢 Nifty Analysis EOD – June 20, 2025 – Friday 🔴
🚀 Bull Run Out of the Blue 🚀 – A Masterclass in Price Action
Nifty kicked off the session with a +56-point gap-up — surprising many, especially since Gift Nifty hinted flat to negative and yesterday’s close was weak. The real jolt came when, in the very first minute, price broke above the Previous Day High (PDH) and opened directly above the CPR zone — a rare occurrence when geopolitical tensions are peaking.
As I often say:
📌 “Market rarely follows the obvious. It thrives in the unexpected.”
Today was a textbook example of that.
Luckily, we were prepped. In yesterday’s note, I mentioned the bullish trigger above 24,862 — and right from the open, Nifty respected every level, offering "hope-on" and "hope-off" trades. What seemed like a 25K test turned into a blast to 25,136, with 100 points added in the last 30 minutes, leaving even seasoned traders awestruck.
The intraday close at 25,079.75 and the adjusted close at 25,112.40 — both above the 15th May closing levels — give a bullish vibe heading into the weekend. 🤞
💬 Personal Note:
Today was special — I sat with my elder daughter, helping her understand real-time market behavior. And what a day it was! From trend reversals, cup & handle, head & shoulders, wedges, shallow pullbacks, to aggressive one-way rallies — everything aligned perfectly to make this a live-action lesson in intraday trading.
🕯 5 Min Time Frame Chart with Levels
🕯 Daily Time Frame Chart
🕯 Daily Candle Breakdown
Open: 24,787.65
High: 25,136.20
Low: 24,783.65
Close: 25,112.40
Change: +319.15 (+1.29%)
📊 Candle Structure Breakdown
Real Body: 324.75 pts → ✅ Strong Green Candle
Upper Wick: 23.80 pts
Lower Wick: 4.00 pts
🔍 Interpretation
Opened flat and never looked back.
Minimal wicks = clear directional strength.
Buyers in full control from open to close.
🕯 Candle Type
📈 Bullish Marubozu-like — One of the strongest bullish signals. A powerful sign of trend continuation or breakout momentum.
📌 Key Insight
Today’s candle reinforces bullish strength.
Holding above 25,100 is key going forward.
A move above 25,136 could invite fresh upside targets — possibly 25,180+ and beyond.
🛡 5 Min Intraday Chart
⚔️ Gladiator Strategy Update
ATR: 251.32
IB Range: 116.6 → Medium IB
Market Structure: 📈 ImBalanced
Trades Triggered:
🔹 9:41 AM – Long Trade → Target Achieved (Trailing Exit, R:R 1:4.79)
🔹 12:18 PM – Short Contra Trade → Target Achieved (R:R 1:2)
🔹 1:07 PM – Long Trade → Target Achieved (Trailing Exit, R:R 1:2.62)
📌 Support & Resistance Zones
Resistance Levels
25,125 ~ 25,150
25,180 ~ 25,212
25,285
Support Levels
25,080 ~ 25,060
25,000 ~ 24,980
24,965
24,894 ~ 24,882
💭 Final Thoughts
The market surprised today — not just in movement but in clarity.The clean break, follow-through strength, and intraday structure hint at momentum continuation — but weekends can bring surprise news.
📌 Watch 25,100 as line in the sand on Monday.
🧠 “Markets are teachers. Today’s lesson? Expect the unexpected, but prepare like it’s already here.”
✏️ Disclaimer
This is just my personal viewpoint. Always consult your financial advisor before taking any action.

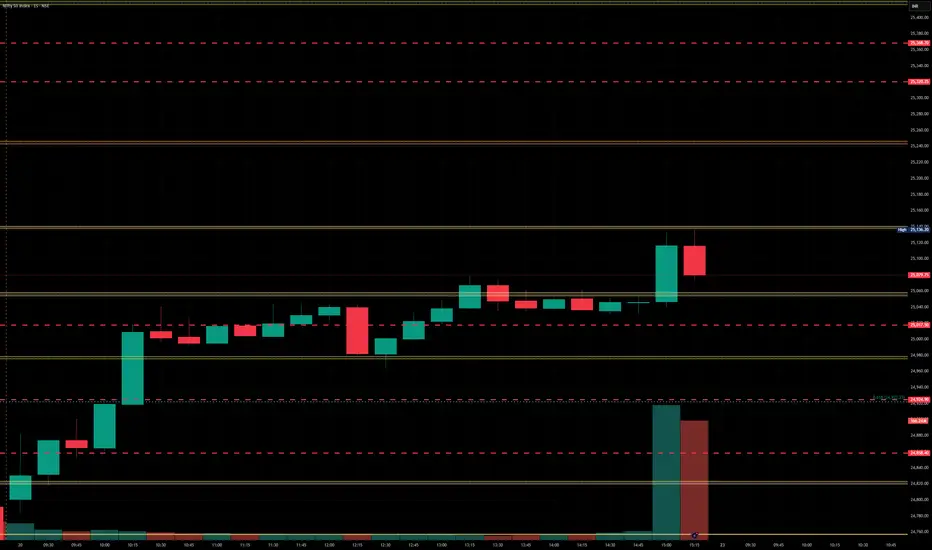
Nifty levels - Jun 23, 2025Nifty support and resistance levels are valuable tools for making informed trading decisions, specifically when combined with the analysis of 5-minute timeframe candlesticks and VWAP. By closely monitoring these levels and observing the price movements within this timeframe, traders can enhance the accuracy of their entry and exit points. It is important to bear in mind that support and resistance levels are not fixed, and they can change over time as market conditions evolve.
The dashed lines on the chart indicate the reaction levels, serving as additional points of significance to consider. Furthermore, take note of the response at the levels of the High, Low, and Close values from the day prior.
We hope you find this information beneficial in your trading endeavors.
* If you found the idea appealing, kindly tap the Boost icon located below the chart. We encourage you to share your thoughts and comments regarding it.
Wishing you success in your trading activities!
Nifty 50 view Considering that, we have had already been in quarterly, and at the fag end of new Fiscal Year QTR which is Apr to Jun 25.
If you could observe present quarter has entered the domain July to Sep 24 domain, and it was challenging the previous data points. While it was doing so, it appears to be experiencing fatigue before challenging the highest zonal resitance of all time high.
For the time being index is weak on shorter time frames, but longer time frames are solid as of now.
The best biased opnion will be to buy on deeps

NIFTY S/R for 19/5/25Support and Resistance Levels:
Support Levels: These are price points (green line/shade) where a downward trend may be halted due to a concentration of buying interest. Imagine them as a safety net where buyers step in, preventing further decline.
Resistance Levels: Conversely, resistance levels (red line/shade) are where upward trends might stall due to increased selling interest. They act like a ceiling where sellers come in to push prices down.
Breakouts:
Bullish Breakout: When the price moves above resistance, it often indicates strong buying interest and the potential for a continued uptrend. Traders may view this as a signal to buy or hold.
Bearish Breakout: When the price falls below support, it can signal strong selling interest and the potential for a continued downtrend. Traders might see this as a cue to sell or avoid buying.
MA Ribbon (EMA 20, EMA 50, EMA 100, EMA 200) :
Above EMA: If the stock price is above the EMA, it suggests a potential uptrend or bullish momentum.
Below EMA: If the stock price is below the EMA, it indicates a potential downtrend or bearish momentum.
Trendline: A trendline is a straight line drawn on a chart to represent the general direction of a data point set.
Uptrend Line: Drawn by connecting the lows in an upward trend. Indicates that the price is moving higher over time. Acts as a support level, where prices tend to bounce upward.
Downtrend Line: Drawn by connecting the highs in a downward trend. Indicates that the price is moving lower over time. It acts as a resistance level, where prices tend to drop.
Disclaimer:
I am not a SEBI registered. The information provided here is for learning purposes only and should not be interpreted as financial advice. Consider the broader market context and consult with a qualified financial advisor before making investment decisions.

Resistance zones and Geo-political instability acting up.Geo-Political instability and resistance zone are acting up together to stop Nifty and not allowing it to close above 25K. As the world is looking at developments in Iran Vs Israel conflict with beated heart market today gave up some gains from yesterday. The only index looking strong is IT index right now. Avoid taking very long positions unless you are very sure of the company. Yesterday also Nifty failed to close above 25K opened briefly near 25K today and then moved downwards. Lot will be decided in the short term by the developments that happen tonight. Important G7 meet and US Federal reserve Rate Cut meet is also to happen later in the week. These 2 global factors will decide fate of the market in the short term. Local factors are all in line and nothing to worry for Indian markets on that front.
The supports for Nifty remain at: 24713 (Trend line support), 24425 (Mother line support of Daily chart), next support is near 23917, 23806 (Father line support of daily chart is in place). Closing below 23906 can lead to further down side and in such a scenario Nifty can fall further towards 23500 or 23047 levels. If we get a closing below that we will give updates regarding the same.
Resistances for Nifty remain at: 24982 (Today's high), 25112 and trend line resistance of 25251. When we get a closing above 25251 we will update you regarding the further upward resistnace levels.
Disclaimer: The above information is provided for educational purpose, analysis and paper trading only. Please don't treat this as a buy or sell recommendation for the stock or index. The Techno-Funda analysis is based on data that is more than 3 months old. Supports and Resistances are determined by historic past peaks and Valley in the chart. Many other indicators and patterns like EMA, RSI, MACD, Volumes, Fibonacci, parallel channel etc. use historic data which is 3 months or older cyclical points. There is no guarantee they will work in future as markets are highly volatile and swings in prices are also due to macro and micro factors based on actions taken by the company as well as region and global events. Equity investment is subject to risks. I or my clients or family members might have positions in the stocks that we mention in our educational posts. We will not be responsible for any Profit or loss that may occur due to any financial decision taken based on any data provided in this message. Do consult your investment advisor before taking any financial decisions. Stop losses should be an important part of any investment in equity.

Nifty levels - Jun 18, 2025Nifty support and resistance levels are valuable tools for making informed trading decisions, specifically when combined with the analysis of 5-minute timeframe candlesticks and VWAP. By closely monitoring these levels and observing the price movements within this timeframe, traders can enhance the accuracy of their entry and exit points. It is important to bear in mind that support and resistance levels are not fixed, and they can change over time as market conditions evolve.
The dashed lines on the chart indicate the reaction levels, serving as additional points of significance to consider. Furthermore, take note of the response at the levels of the High, Low, and Close values from the day prior.
We hope you find this information beneficial in your trading endeavors.
* If you found the idea appealing, kindly tap the Boost icon located below the chart. We encourage you to share your thoughts and comments regarding it.
Wishing you success in your trading activities!

Multi timeframe Pullback reversal entriesThis is very simple but yet effective way of trading. Entry through Multi timeframe analysis. Price riding on MA ( respecting MA levels) and at Pullback - we can enter at reversal in lower time frame once price started riding MA. Though this is very basic - but very effective as this can be applied in timeframe. The sync between higher and lower timeframe for entry. We can exit as per out trade rules - either lower TF MA breach or Higher TF. Entry with proper calculation of Risk Reward only. This is the basic strategy of trend following specially for learners and practicing trading. Even season traders use this. MA period can be arranged as per suitability. Here I have applied 30/50.
This for educational and learning purpose only. Enter trading post proper practice only.
Views are highly welcome.

#NIFTY Intraday Support and Resistance Levels - 01/07/2025Nifty is expected to open with a slight gap up near the 25,550 level, which lies close to a minor resistance zone. If the index manages to sustain above this region, we may see a continuation of bullish momentum with potential upside levels at 25,600, 25,650, and 25,700. Holding above 25,550 would signal strength, supported by recent recovery attempts from lower levels.
However, if the index fails to hold above 25,550 and starts slipping below 25,450, weakness may creep in. A fall below 25,450 could open the door for downside targets of 25,350, 25,300, and possibly 25,250. Traders should stay cautious around the 25,550–25,600 zone for a clear directional move, with strict stop losses on both sides.

#Nifty - 1500 Points Move Expected?Date: 20-05-2025
#Nifty Current Price: 24683.9
Mid-Point: 24805.35
Upside Targets: 25645.39, 26048.95, 26515.30 and 26981.65
Downside Targets: 23966.86, 23561.75, 23095.40 and 22629.05
Support: 24371.97
Resistance: 25241.83
