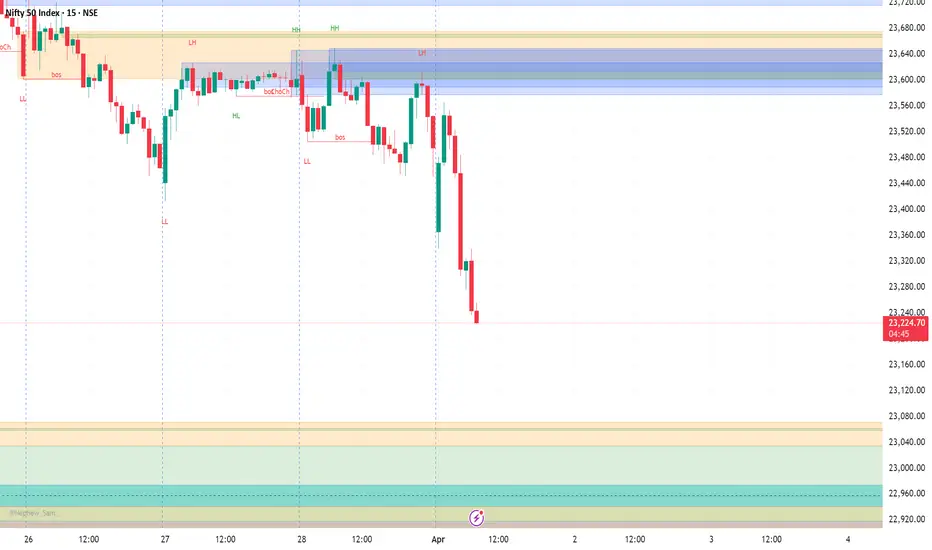
NIFTY approaching 23000-22900-22800 levels As we can see NIFTY looks more weak as it has broken the consolidation making it weaker. Now that it has confirmed the weakness and expected to reach its next eminent demand zone of 23000-22900 levels hence till the zone is reached, every rise can be shorted so plan your trades accordingly and keep watching.
NIFTY trade ideas

2 April Nifty50 important level trading zone #Nifty50
99% working trading plan
Gap up open 23231 above & 15m hold after positive trade target 23312, 23432
Gap up open 23231 below 15 m not break upside after nigetive trade target 23114, 23070
Gap down open 23114 above 15m hold after positive trade target 23231, 23312
Gap down open 23114 below 15 m not break upside after nigetive trade target 23070 , 22995
💫big gapdown open 23070 above hold 1st positive trade view
💫big Gapup opening 23312 below nigetive trade view
📌For education purpose I'm not responsible your trade
More education following me

NIFTY : Trading Levels and Plan for 31-Mar-2025📌 NIFTY Trading Plan – 31-Mar-2025
📊 Market Overview:
Nifty closed at 23,495, showing mixed sentiment near the Opening Support Zone (23,401 – 23,465). The market is at a crucial juncture, with potential bullish momentum above resistance levels, while breakdowns below key supports may trigger selling pressure.
This plan will help you react strategically to different opening scenarios, ensuring a favorable risk-reward ratio.
🔼 Scenario 1: Gap-Up Opening (100+ points above 23,600)
A gap-up above 23,600 signals bullish momentum, but for sustained upside, Nifty must stay above 23,642 – 23,842. Watch for rejection at resistance zones, as profit booking can lead to reversals.
✅ Plan of Action:
If Nifty sustains above 23,772, expect a move towards the next resistance at 23,925 – 23,990. A breakout above 23,990 could open doors for 24,050+.
If price faces rejection at 23,842, a pullback towards 23,642 → 23,495 is possible. If it breaks below 23,495, expect further downside.
Avoid aggressive longs inside 23,642 – 23,842, as this is a potential reversal zone. Wait for a decisive breakout or rejection confirmation.
🎯 Pro Tip: If the gap-up is filled within the first 15-30 minutes, it suggests weak buying pressure and increases the probability of a reversal.
⚖ Scenario 2: Flat Opening (Within ±100 points, around 23,500)
A flat opening near 23,495 indicates indecision. The market will take direction after the first few candles, so breakouts or breakdowns from key levels should be closely monitored.
✅ Plan of Action:
Upside case: If Nifty breaks and sustains above 23,642, it may head towards 23,772 → 23,925. Monitor price action near these resistance levels before entering fresh longs.
Downside case: If Nifty breaks below 23,495, it could test 23,336 → 23,164. A breakdown below 23,164 will shift the trend bearish.
Avoid trading inside the No Trade Zone (23,495 – 23,642), as price could consolidate before a breakout.
🎯 Pro Tip: In a flat opening, wait for a clear 15-minute candle close above or below key levels before entering trades.
🔽 Scenario 3: Gap-Down Opening (100+ points below 23,400)
A gap-down below 23,400 may indicate fresh selling pressure, making it crucial to observe whether buyers step in at support zones.
✅ Plan of Action:
If price sustains below 23,400, expect a decline towards 23,336 → 23,164. A breakdown below 23,164 could lead to a sharp fall towards 23,100.
If price finds support at 23,164 and rebounds, it may recover towards 23,336 → 23,495. A strong close above 23,495 will shift momentum back to the bulls.
Be cautious of bear traps – If the market gaps down but quickly recovers, it could trigger short covering, leading to a strong upside reversal.
🎯 Pro Tip: If the gap-down occurs near a strong buyer’s support zone, wait for a bullish price action confirmation before entering long trades.
⚠️ Risk Management Tips for Options Traders
🔹 Avoid over-leveraging – Use proper position sizing to manage risk.
🔹 Theta Decay Awareness – If the market consolidates, option premiums will erode rapidly.
🔹 Use Spreads for Protection – Instead of naked options, use spreads to limit risk and improve probability.
🔹 Trade at Key Levels – Avoid impulsive trades; focus on defined support and resistance zones.
📌 Summary & Conclusion
📍 Key Levels to Watch:
🟥 Resistance: 23,772 → 23,925 → 23,990
🟧 No Trade Zone: 23,495 – 23,642
🟩 Support: 23,336 → 23,164 → 23,100
🔸 Bullish Bias: Above 23,642, targeting 23,772 – 23,925
🔸 Bearish Bias: Below 23,400, expecting a fall towards 23,336 – 23,164
🔸 Neutral/Choppy: Inside 23,495 – 23,642, avoid unnecessary trades
🎯 Final Advice:
Stick to the structured trading plan and execute only at key levels.
Avoid emotional trading—wait for confirmation before entering trades.
The first 15-30 minutes after market open will provide better clarity—observe price action before committing to a trade.
📢 Disclaimer
I am not a SEBI-registered analyst. This trading plan is for educational purposes only. Please conduct your own research or consult a financial advisor before making any trades.

Nifty50 Analysis Based on Today's ClosingThe Nifty 50 index closed at ₹23,165.70 on April 1, 2025, down by 354 points (-1.50%)
Analysis Based on Today's Closing
Key Support Levels
Immediate Support: ₹23,100
This level aligns with the 20-day EMA and is a critical short-term support. A breakdown below this could lead to further downside.
Next Support: ₹22,900
If ₹23,100 is breached, the next significant support lies at ₹22,900, which could act as a strong demand zone.
Key Resistance Levels
Immediate Resistance: ₹23,400
This level, which was previously a support, now acts as resistance. A recovery above this level could indicate a reversal.
Next Resistance: ₹23,650
Sustaining above ₹23,650 could lead to a test of ₹23,800, which is a critical resistance for bullish momentum.
Scenario Analysis
Bearish Breakdown
If Nifty 50 falls below ₹23,100, it could test ₹22,900.
A breakdown below ₹22,900 could lead to further weakness, targeting ₹22,700 or lower.
Bullish Recovery
If Nifty 50 reclaims ₹23,400, it could target ₹23,650.
A breakout above ₹23,650 could lead to ₹23,800, signaling a potential trend reversal.
Market Sentiment
The market sentiment remains cautious due to global headwinds, including concerns over U.S. tariff policies.
Sectors like IT and banking faced significant pressure, contributing to today's decline.
NOTE: Please note that this analysis is for informational purposes only and should not be considered as financial advice or a recommendation to buy or sell any securities. Always conduct your own research and consult with a certified financial advisor before making any investment decisions.

NIFTY50.....Box trading?Hello Traders,
the NIFTY50 has seen a massive sell-off during Monday's session. It declined from a high @ 23483.70 to a low @ 23221.15 in the first trading hour. That was a huge sell-off, off about 227.15 points.
It collapsed below my favored sell-off level @ 23462 and opened the door to more selling pressure, as it touched my price range from 23289 to 23196 by some points.
Chart analysis:
On March 24th the index achieved a 2.0 Fibo-extension @ 23869.60 points. This was a peak! Since the index is in a corrective mode, and possibly has shown a w-x-y correction, that has chances to morph into a triple correction.
Shorthand I expect a test off the lower boundary of the box, ranging @ 23038 points. N50 has the option to show a wave 4 of lower degree and decline than to a wave 5 low below today's low.
But step by step.
First, I'd like to check tomorrow's pattern and judge that.
The bulls need a massive buying pressure to achieve the range of 23414 to 23646.45 points.
Well Traders..... That's it for a short note.
Have a great week....
Ruebennase
Please ask or comment as appropriate.
Trade on this analysis at your own risk.

Nifty levels - Apr 02, 2025Nifty support and resistance levels are valuable tools for making informed trading decisions, specifically when combined with the analysis of 5-minute timeframe candlesticks and VWAP. By closely monitoring these levels and observing the price movements within this timeframe, traders can enhance the accuracy of their entry and exit points. It is important to bear in mind that support and resistance levels are not fixed, and they can change over time as market conditions evolve.
The dashed lines on the chart indicate the reaction levels, serving as additional points of significance to consider. Furthermore, take note of the response at the levels of the High, Low, and Close values from the day prior.
We hope you find this information beneficial in your trading endeavors.
* If you found the idea appealing, kindly tap the Boost icon located below the chart. We encourage you to share your thoughts and comments regarding it.
Wishing you success in your trading activities!

Nifty short term analysis as per Gann fanNifty touched 2/1 Gann fan Line and corrected from there 1/1 low Gann fan Line which stands at 4 march 2025. Nifty may find resistance at 2/1 level if it crosses this decisively then will go towards higher level in coming days.

nifty50 directioncurrent scenario suggest price to follow the bearish trend as todays low was broken after a early morning pullback that infuse the liquidity more on the supply side than demand and we saw a big red bar it is likely to come back at the area around 23000 to 22950 with minor intraday pullbacks
Nifty 50 sell nifty 50 rectracment wave 3 62 % in
previous downside impulse and again
breakdown wave c stoploss 23700 target 21720

#NIFTY Intraday Support and Resistance Levels - 01/04/2025Flat or slightly gap down opening expected in nifty. After opening if nifty starts trading below 23450 level then possible strong downside rally upto 23250 level. Any upside movement only expected if nifty sustain above 23500 after opening session. Upside 23750 will act as strong resistance for today's session.

Nifty April 1st Week Analysis Nifty is looking uncertain at the moment. Global uncertainties and a truncated week are enough to restrict momentum for bulls, but charts are indicating that at least we can expect a green weekly close on Nifty. Levels to watch for upside are 23620. Upon crossing 23620, we can expect good momentum. On the downside, imp levels to watch are 23350. Upon breaching 23350, we can expect some retracement. All levels are marked in the chart posted.

1 April Nifty50 important level trading zone #Nifty50
99% working trading plan
Gap up open 23578 above & 15m hold after positive trade target 23692, 23860
Gap up open 23578 below 15 m not break upside after nigetive trade target 23468, 23368, 23148
Gap down open 23468 above 15m hold after positive trade target 23578, 23692
Gap down open 23468 below 15 m not break upside after nigetive trade target 23368, 23143
💫big gapdown open 23368 above hold 1st positive trade view
💫big Gapup opening 23692 below nigetive trade view
📌For education purpose I'm not responsible your trade
More education following me

Nifty 50- Week starting 24th April,2025Nifty had a solid run last week, however, there are several resistances going forward. Nifty might struggle going ahead in the coming week. It appears that the zone of 23500-23800 is a strong resistance zone. Will it crossover, consolidate or collapse?
Previous Daily swing high=23807, Equal Rally distance =23559,
38.2% retracement= 23612, 50% Retracement=24121, 200 DMA=24068

Nifty50-Viewpoint-March ,25On monthly chart, Nifty has closed below its opening levels for 5 consecutive months.
(Octber24-Feburaru,25). This also suggest that nifty might close above March opening. That means the bottom for March might be in place.
Based on these points I feel nifty might be headed towards 23500-23700 levels in March, 25.

Nifty 50 Upcomming Fibonacci Retracement levels(April 2025)Nifty 50 important upcomming retacement levels in Day Timeframe.
Look for Gap filling
Important retracement fibinaci levels are marked
Important support and resistance is marked

NIFTY still looks weak! As expected NIFTY still seems to be consolidating between our levels and yet to decide its upcoming trend but looking at global cues, we can expect NIFTY to open weak but the zones could act as a strong demand and supply done hence till NIFTY sustains below our above either zones, the trend will not be confirmed so wait for proper setups and confirmations and plan your trades accordingly and keep watching.

Nifty trend directionNifty 23519 - couldn't raise above the resistance 23620 though short covering during the last session. Many imbalances to cover. keeping 23620, we expect nifty to test 23340 as posted earlier and also has more possibility to fall below.

NIFTYNIFTY
MTF Analysis
NIFTYYearly Demand 18887
NIFTY 6 Month Demand 21801
NIFTYQtrly Demand BUFL 22526
NIFTYMonthly Demand 23110
NIFTYWeekly SOE 23049
NIFTYDaily Demand DMIP 22940
ENTRY -1 Long 23049
SL 23,263
RISK -323
Target as per Entry 32,305
Last High 26,277
Last Low 23,263

NIFTY50 Repeats 2015-2016 .. diving to 19500 by July 2025?NIFTY is showing the pattern of 2015-2016 asking for a deep correction to digest the profits in last few years and providing another opportunity to early birds later in the summer.
It feels like NIFTY is leading indicator starting correction from Q3 in 2025 and probably would hit the bottom too early compared to US equities.

#Nifty50 Market Update: A Week of Volatility and Uncertainty
The #Nifty50 closed at 23,519, marking a 170-point rise from last week's close, after hitting a high of 23,869 and a low of 23,412. As anticipated last week, once Nifty managed to sustain above the crucial 23,300 level, it surged to a high of 23,869, before retracing to close at 23,519. However, this week’s market candle formed a Dragonfly Doji, indicating that bears continue to hold control, as concerns over the financial year-end and the looming uncertainty of Trump's new tariff policy, set to take effect on April 2, dampened market sentiment.
With the market facing such pressure, it's crucial to consider the potential volatility for next week, as the market will be truncated due to the Eid holiday on Monday. As a result, Nifty could trade within a broad range of 24,000 to 23,000. For the next phase of an uptrend, Nifty must hold above 24,000, after which it could test higher levels of 24,200, 24,414 (a key Fibonacci level), and possibly 24,600.
Looking at the broader market trends, the monthly time frame remains bearish, while the weekly is slightly bullish and the daily trend is bullish. If favorable conditions align, we may begin to see upward movement in Nifty and other indices by mid-April, though in the interim, we’ll likely need to weather the storm and remain patient with the bearish sentiment.
S&P 500 Market Update: Testing Critical Support Levels
The S&P 500 closed at 5,580, down about 90 points from the previous week's close, hitting a low of 5,572. With the index closing near its weekly low, it suggests downward pressure may persist into the next week, with potential support levels at 5,550 and 5,458 (another key Fibonacci level). A test of these levels could put additional strain on Indian markets as well, amplifying volatility.
Overall, the market remains in a precarious position, and investors should brace for potential swings until more clarity emerges, especially with the geopolitical and policy risks at play.

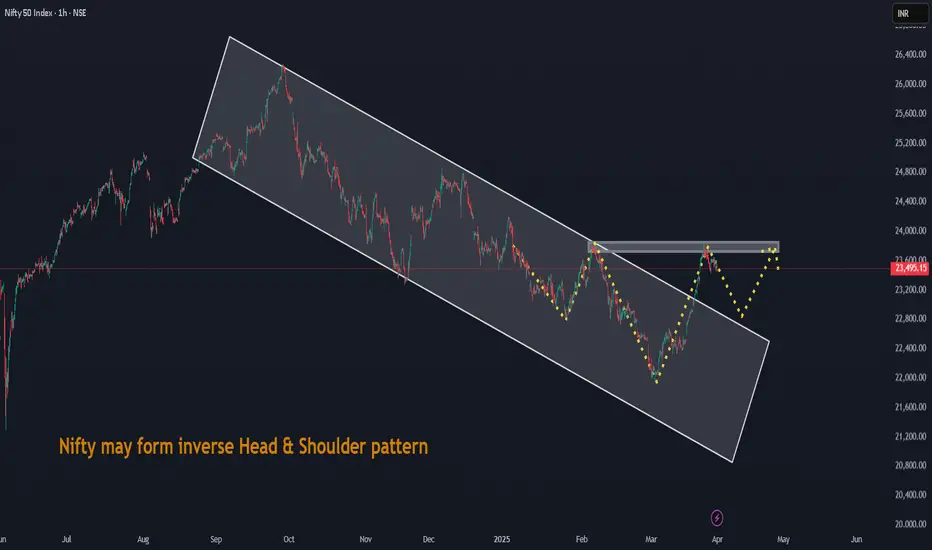
Nifty may form inverse Head & Shoulder patternNifty may form inverse Head & Shoulder pattern. This is one of the sign of early revetsal
Nifty - A way ahead!!!I'll be super bullish if Nifty closes above 23900 weekly.
I'll be playing for the next ATH.
