Nifty Review & Analysis - Daily
Nifty opened Gap up +150 points again following Global Cues and saw surge throughout the day making a high of 23708 and closing at 23658 (+1.5%).
Price Action : - Bullish
Nifty closed 1.5% in positive. Consequtive 6 days green candle and closing above 10,20,50 nad 200 dEMA
Candle Pattern: - Bullish
Formed a Big Green candle with a small wick on upside.
Daily EMA Positioning: Bullish
10dEMA 22979
20dEMA 22848
50dEMA 23036
200dEMA 23399
EMA Trend:
Closed above 10dEma ,20dEma, 50DEMA and 200DEMA,
Daily MA suggests Strong Buy
Hourly suggests Strong Buy
15mins Suggests Strong Buy
The momentum indicator, RSI - Relative Strength Index is above 60 now at 71.5 - Just Over Bought
Momentum gaining towards Upside
Support/Resistance Levels:
Major Support 23300-500
Immediate Support 22600
Immediate Resistance 22750
Major Resistance 24000
Trend:
Short Term Trend is Bullish
Daily Options Activity:
Highest CE OI was at 24000 also saw some unwinding with huge Unwinding at 23600-500 highest - Support
Highest PE OI was at 23300, highest Put addition seen at 23500 followed by 23600 - support
PCR is 1.2 indicating Bullishness
Daily Futures Activity FII + Pro F&O Data:
FII Long/Short ratio at 32.5%/67.5% indicating addition of Longs by FIIs - Bullish
Change in Futures OI:
FII Future positions saw littl3 addition in longs +2K with shorts unchanged -Bullish
Nifty Futures price was higher by 01.5% and 12.5 %OI Increase indicating Long Additions
Observation:
Nifty looks strong above 23550 forming daily positive green candles, closing above 10,20,50, 200dEMA and RSI just in overbought zone
Overall Trend:
Sentiment is very Positive
Outlook for Next Session:
Nifty looks strong around 23600, might consolidate above 23550 before another upmove to 24000
Approach & Strategy:
Long with 22850 as SL in April contract, continue with SL 23500
My Trades & Positions:
Long in 23200CE April, closed and moved to 23600CE April
NIFTY trade ideas

Nifty Trend Update: Daily Downtrend, SMALER TIME FRAME ........ Nifty Analysis & Trade Plan – Trend Shift & Key Levels
📌 Market Structure & Trend Analysis
Daily Time Frame: The trend has shifted to a downtrend after a Change of Character (ChoCh) below 23,875.
Weekly Time Frame: The POI has been tapped, aligning with the daily trend shift.
Monthly Time Frame: The price has broken below an Internal Daily Market Structure (IDM), indicating potential further downside.
📌 Consolidation & Breakout Scenarios
Current Price Action: Nifty has been consolidating within the same price zone for the past 5 days.
Key Reference Levels:
Previous Low: 21,964
Resistance Breakout Level: If price breaks above this consolidation, we can expect a fast rally towards ₹23,050.
Failure to Create New High: If the price fails to break and sustain above consolidation, we could see a downmove towards ₹21,500 – ₹21,250.
📌 Trading Plan & Confirmation Strategy
Bullish Confirmation:
Price needs to break and hold above the consolidation zone.
A successful breakout can trigger a rapid move towards ₹23,050.
Bearish Confirmation:
If price fails to create a new high and rejects consolidation, watch for a break below ₹21,964, leading to a move towards ₹21,500 – ₹21,250.
Adaptive Trading: As traders, we must stay flexible and adjust our trading plan based on real-time price action.
📌 Final Thoughts
This analysis focuses on price behavior after consolidation and the swipe method to determine high-probability trade setups. Stay patient, wait for confirmation, and react to price movements accordingly.

Careful Nifty 50Be careful with nifty 50 up move dont think it a bull move market might fall again as per the trendline shown . only above 26200 market looks strong upward

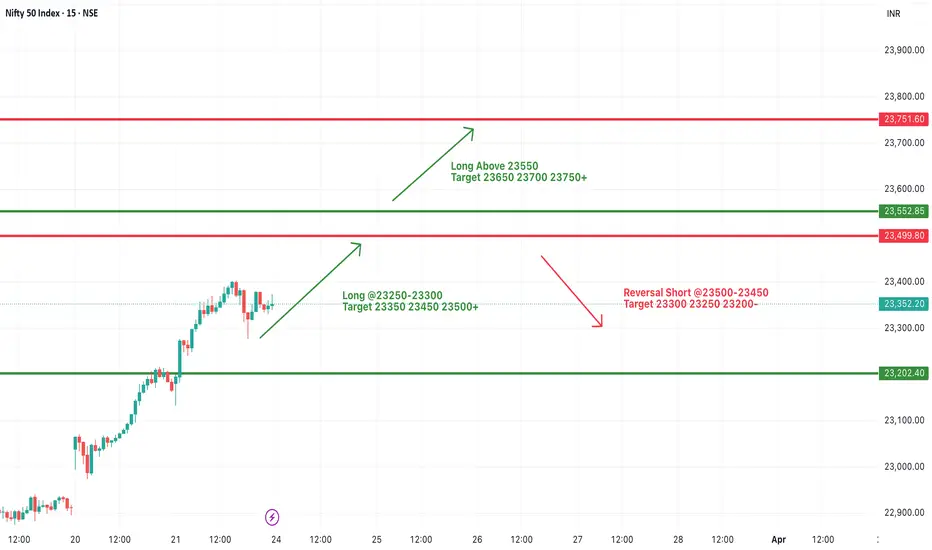
#NIFTY Intraday Support and Resistance Levels - 24/03/2025Today will be gap up opening expected in nifty. Expected opening near 23450 level. After opening if nifty gives breakout and starts trading above 23500 level then expected strong upside rally upto 23750+ level in opening session. 23500-23450 level will act as resistance. Any correction only expected if nifty gives reversal from this level.
Nifty 50 - a bullish EW countHere's a very bullish count for the Nifty 50. Is it due a turn to the upside after a 6 month correction? This counts suggests that we have seen a simple ABC zigzag correction that has completed at the 38.2 fib correction. Perhaps it's a bit early days to say the trend has changed but there has been some positive price action this last few weeks.

Nifty Trading Stratgey for Option PlayersNifty Trading Strategy for the Week Ahead 📝✅
Nifty has recovered strongly from the 22,700–22,800 zone up to around 23,350. Momentum on the 1H chart is still pointing upward (higher highs and higher lows since early March).
Max Pain: ⚠
The current Max Pain appears around 23,200–23,300.
Price (≈23,350) is slightly above Max Pain. Often, option sellers benefit if the index settles near the Max Pain level by expiry; however, in a strong uptrend, price can remain above it.
Open Interest (OI) & Change in OI:📊
Significant Put OI (and additions) around 23,200 and 23,000. This often implies a support zone.
Noticeable Call OI at or above 23,500, which could act as a short-term resistance if price approaches that region.
Put–Call Ratio (PCR): 📈📉
PCR is around 1.05–1.10, suggesting mildly bullish sentiment.
A PCR > 1 usually means more puts are being sold or more call positions are being closed, implying the market is not aggressively bearish. However, an extremely high PCR can also hint at an overbought market, so it’s good to be cautious.
2. Possible Strategy 🧠
Given the uptrend and the supportive OI near 23,200, a buy-on-dips approach looks reasonable. However, be mindful of the overhead call OI around 23,500.
Entry:💡
Buy (go long) near 23,300–23,280
Rationale: You’re buying close to the short-term support area (23,200–23,250) indicated by strong Put OI and near the Max Pain region.
Target: 🎯
First Target: 23,450–23,500
Rationale: This zone is just below the big Call OI cluster, which could be the first significant resistance. Lock in partial profits here if the market moves up quickly.
2nd Target (if momentum is strong): 23,600 🎯🎯
Only consider holding for a higher target if you see follow-through buying and a breach of 23,500 on good volumes.
Stop Loss: 🔴
Stop Loss: 23,200 (on a closing basis if you are trading intraday to multi-day)
Rationale: A break below 23,200 would indicate that sellers are gaining control and that the put-writers’ support is failing.

24 March #Nifty50
99% working trading plan
Gap up open 23440 above & 15m hold after positive trade target 23633, 23793
Gap up open 23440 below 15 m not break upside after nigetive trade target 23310,22240
Gap down open 23310 above 15m hold after positive trade target 23440, 23633+
Gap down open 23310 below 15 m not break upside after nigetive trade target 23222, 22180
💫big gapdown open 23633 above hold 1st positive trade view
💫big Gapup opening 23222 below nigetive trade view
📌For education purpose I'm not responsible your trade
More education following me

Nifty Analysis 24.3.2025As of March 21, 2025, the Nifty 50 index closed at 23,350.40, reflecting a 0.69% increase from the previous trading session. This uptick contributed to a 4% weekly gain, marking the best week since July 2022.
Foreign Institutional Investors (FIIs) have been net sellers in the Indian equity markets in recent months. From October 2024 to March 2025, FIIs sold approximately $28 billion worth of shares, leading to a 13% decline in the Nifty 50 index from its late September 2024 peak. In the first half of March 2025 alone, FIIs sold $3.5 billion worth of Indian stocks, with significant sell-offs in the information technology and consumer goods sectors.
However, recent data indicates a moderation in foreign outflows. FIIs have turned buyers recently, contributing to improved market sentiment. This shift, coupled with attractive large-cap valuations, has bolstered optimism among investors.
Nifty 50
In summary, while the Nifty 50 index has experienced volatility due to substantial FII outflows in recent months, recent trends suggest easing foreign selling and renewed investor confidence, leading to a notable recovery in the index.

NIFTYNIFTY TRend Reversal
Nifty 22100 hold n then Rally 1500 points - now expecting consolidation 22900
Nifty 22100 was Weekly demand Point & Price respect that level
Now Expecting 22900-22700 this is Key suppprt zone for Target 26000
we can see some downside on Tuesday

NIFTY S/R for 24/2/25Support and Resistance Levels:
Support Levels: These are price points (green line/shade) where a downward trend may be halted due to a concentration of buying interest. Imagine them as a safety net where buyers step in, preventing further decline.
Resistance Levels: Conversely, resistance levels (red line/shade) are where upward trends might stall due to increased selling interest. They act like a ceiling where sellers come in to push prices down.
Breakouts:
Bullish Breakout: When the price moves above resistance, it often indicates strong buying interest and the potential for a continued uptrend. Traders may view this as a signal to buy or hold.
Bearish Breakout: When the price falls below support, it can signal strong selling interest and the potential for a continued downtrend. Traders might see this as a cue to sell or avoid buying.
MA Ribbon (EMA 20, EMA 50, EMA 100, EMA 200) :
Above EMA: If the stock price is above the EMA, it suggests a potential uptrend or bullish momentum.
Below EMA: If the stock price is below the EMA, it indicates a potential downtrend or bearish momentum.
Trendline: A trendline is a straight line drawn on a chart to represent the general direction of a data point set.
Uptrend Line: Drawn by connecting the lows in an upward trend. Indicates that the price is moving higher over time. Acts as a support level, where prices tend to bounce upward.
Downtrend Line: Drawn by connecting the highs in a downward trend. Indicates that the price is moving lower over time. It acts as a resistance level, where prices tend to drop.
Disclaimer:
I am not a SEBI registered. The information provided here is for learning purposes only and should not be interpreted as financial advice. Consider the broader market context and consult with a qualified financial advisor before making investment decisions.

Nifty 50 spot 2025 March month predictionEverything is on chart for SWING view
AREA UP AREA LOW SPACE

NIFTY50.....One more leg up?Hello Traders,
the NIFTY50 has run into my cited price area I mentioned, ranging from 23038 to 23785. This is a wide range, but these are the facts!
One open target is @ 23502 area. Here a decision will be made, whether it was it was the short coverage or just the end of wave v of ((iii)) of c!?
On the daily chart to observe is the fact, that price has popped above the upper boundary of the trend-channel. Typically, a retest of the area is to wait for, but not sure.
So, if price bounce back to 23000 zone, at least the trend has to be continued for 2–3 days.
Keep in mind, that a bull-run for this length is typically followed by a longer lasting corrective move. So, a second probability for this scenario is a triple correction, that is developing in a w-x-y-x²-z pattern.
Note the blue arrow at the chart. I have left this one unchanged to visualize the price area I have expected!
I will observe the coming pattern on Monday – Tuesday and update the count for you.
Have a great weekend.....
Ruebennase
Please ask or comment as appropriate.
Trade on this analysis at your own risk.

NIFTY : Intraday Trading levels and Plan for 25-Mar-2025📊 Nifty Trading Plan – 24-Mar-2025 (Educational & Strategy-Oriented)
Chart Timeframe: 15-Min | Key reference zones marked on chart
📍
🚀 GAP-UP Opening (Above 23,407)
If Nifty opens with a gap-up above 23,407, it will enter the Wave 3 Resistance Zone (23,508 – 23,582), which is a high-probability reversal zone.
✅ Plan of Action:
• Don’t rush into buying after the gap-up. Wait and observe the price behavior around 23,508 – 23,582.
• This area is likely to witness profit booking or short build-up.
• Look for signs of reversal like bearish engulfing, shooting star, or bearish divergence on RSI.
• If such patterns form, consider buying Put Options (OTM PE) with a stop-loss on a 15-min candle closing above 23,585.
• If Nifty sustains above 23,582 with strong volume, then we might be heading into an extended up-move, but this is lower probability.
• Safer trades are shorting on signs of exhaustion at higher levels.
📌 Key Zone to Watch: 23,508 – 23,582 (Wave 3 Resistance)
📈 FLAT Opening (Between 23,245 – 23,407)
This is the Opening Resistance / Support Band (23,345 – 23,407), acting as a decision-making zone.
✅ Plan of Action:
• Let the market settle in the first 15–30 mins.
• If price holds and builds strength above 23,345, Nifty may climb towards 23,407, and if broken, test 23,508+.
• Weak price action (rejection wicks or low volumes) from 23,345–23,407 signals weakness. In that case, look for short opportunities with SL above 23,407.
• Avoid CE entries unless price sustains above 23,407 with momentum and volume breakout.
• If price starts to slip below 23,245, sellers will get more active and price could drop quickly to next support.
📌 Key Decision Zone: 23,345 – 23,407
📌 Support Trigger: 23,245 (Opening Support)
📉 GAP-DOWN Opening (Below 23,245 or near 23,185 – 22,985)
If Nifty opens below the Opening Support at 23,245, or even near deeper support zones of 23,185 or 22,985, it will bring in volatility and create both breakdown and reversal opportunities.
✅ Plan of Action:
• A gap-down near 23,185 should be watched carefully. This is a minor intraday support. If held with a bullish candle (like a hammer), consider buying CE with SL below 23,160.
• If the gap-down extends to 22,985 (Last Support for Intraday), it's a strong bounce zone. A bullish reversal candle here provides high RR long trades.
• If price fails to hold 22,985, sellers may dominate and drag Nifty further down. Consider PE trades only after a 15-min close below 22,985.
• Avoid panic trading – let the zone react and only act based on confirmation candles.
📌 Bounce Zones: 23,185 and 22,985
📌 Breakdown Trigger: Below 22,985
🛡️ Risk Management Tips for Options Traders:
• Avoid trading first 5–15 mins after opening, especially on gap days – let price give structure.
• Use hedged strategies like Bull Call or Bear Put Spreads to reduce premium loss due to theta decay.
• Trade light near reversal zones – don’t go all-in on emotional conviction.
• Always place stop-loss on closing basis (15-min candle), not fixed points, especially during volatile moves.
• If VIX is high, premiums are inflated – focus on quick entry & exit, no holding hoping for magic.
📌 Summary & Conclusion:
• Nifty has entered a critical decision zone.
• Watch 23,407 carefully – above it, bulls may attempt a final push to 23,582, but signs of exhaustion there are likely.
• On the downside, supports at 23,185 & 22,985 will act as bounce zones.
• Directional trades should be initiated only after price confirms intent post opening.
• Use structure + volume for confidence in setups.
⚠️ Disclaimer: I am not a SEBI-registered analyst. The above content is for educational purposes only. Please do your own analysis or consult a certified financial advisor before making any trading decisions.

Nifty analysis as of 23/03/2025Nifty analysis as of 23/03/2025
Nifty analysis
bank nifty analysis
stocks
dji nasdaq etc

Nifty trend direction. Nifty on daily chart is showing broadening descending wedge pattern which is bullish reversal pattern. Nifty has resistance at 23528.if this resistance broken nifty could make another 2000 points bullish move.

Nifty March 4th week analysisNifty is looking positive , but on the upside 23600 will be a very strong resistance and we can expect further upside only if nifty successfully crosses and sustains above 23600 and further rally can continue upto levels of 23911-24044 in the upcoming week. If nifty fails to cross 23600 then we can expect small retracement and range bound movement throughout the week in nifty.

Nifty's Strong Surge: What's Next for the Market?
This week, Nifty surged to 23,350, an impressive 950-point rally from last week’s close. The index hit a high of 23,402 and a low of 22,353. As I highlighted last week, I expected Nifty to trade within a narrow range of 22,850 – 21,950. However, Nifty broke out of this range, shattering the upper limit, and the resulting short covering led to a strong bullish close.
Next Week: A Critical Turning Point
Looking ahead, next week is going to be crucial. Despite the strong move, Nifty is still in a bearish phase on both the weekly and monthly time frames. However, if Nifty manages to retrace slightly to 23,000 and sustain above the 22,900 – 23,000 range, we could see the bulls taking control, pushing the market up toward 23,800/23,850.
On the other hand, if Nifty falls below 22,800, it would signal a breakout failure, which would be bad news for the bulls. In that case, Nifty could potentially drop to 22,000.
March-End Volatility: Be Ready for Both Sides
At the end of March, traders typically start booking their losses to offset gains for the financial year, creating increased volatility. This makes it an exciting time for directional traders, as we could see sharp movements in both directions.
For me, as long as the monthly and weekly charts remain bearish, I am cautious and not ready to turn bullish just yet. However, there are some sectors showing relative strength, and these could offer trading opportunities:
Nifty Energy
Nifty Financial Services
Nifty Metal
Nifty Public Sector Enterprises (PSE)
Keep an eye on stocks from these sectors, as they are currently outperforming others.
S&P 500: Mixed Signals
On the global front, the S&P 500 closed this week at 5,667, barely 30 points above last week’s close. The index has failed to sustain above the DEMA200 level at 5,705, signaling that the bulls are struggling to maintain momentum. A consecutive daily close above this level would help restore confidence among the bulls, potentially targeting 5,850.
However, if S&P 500 drops below 5,600, we could see a faster sell-off, with the recent low of 5,500 likely to come into play. It’s going to be a tense week as we await to see whether the bulls or the bears take control.
In Summary: Prepare for Volatility
Next week promises to be an exciting week for traders, as both domestic and global markets face critical levels. Directional traders should remain flexible, prepared for sharp moves in both directions. Focus on key sectors showing strength and stay vigilant for any breakout or breakdown in the Nifty and S&P 500.

$Nifty50Bang on 200 ema on H4 and D1
Reclaiming vwap from ATH is our next zoi
For now surely some sort of chop for the next impulse
BTFD mode

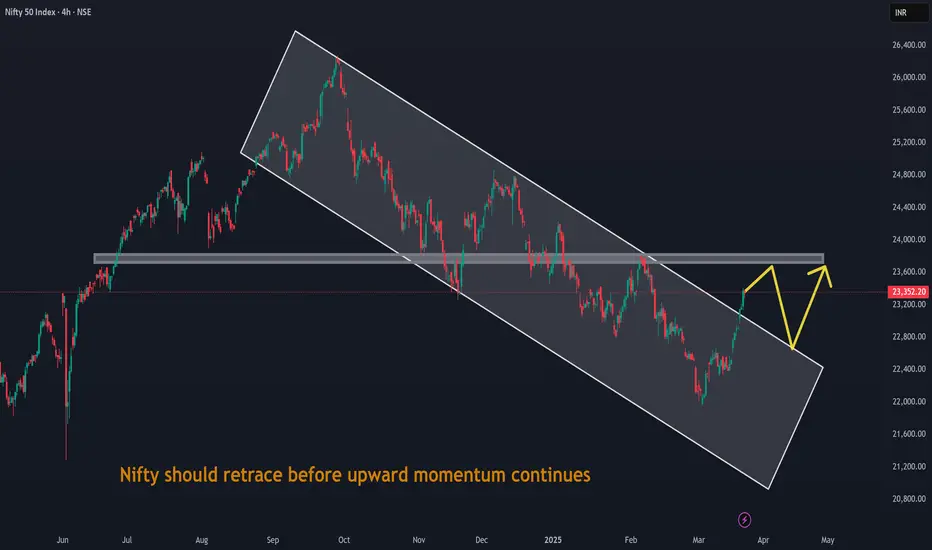
Nifty should retrace before upward momentum continuesNifty should retrace before upward momentum continues. It will consolidates as of now.

Nifty 50 monthly chart analysis History leads to the future. In weekly Chart big green candle is another sign of bull market.

Nifty 50 at the Monthly SR RANGE.Nifty 50 at the Monthly SR RANGE.
If it breaks the 18100 range then we may see a downfall for some time.

NIFTY:LookS Bullish for 24K TGTNIFTY :Had a wonderful run this week and in the process successfully crossed all its critical Moving averages viz 20DEMA,50DEMA ,100 DEMA. Nifty gave a close very nearer to its 200DEMA falling at 23397 and is its immediate weaker reistance. NIFTY also formed Triple bottom pattern in daily chart and it suggests that ,NIFTY holding above 23400 its likely to test 23800-24000.For me any reasonable dip is a buy for 23800+Target,those holding may trail their SL (For educational purpose only)
