NIFTY S/R for 19/2/25Support and Resistance Levels:
Support Levels: These are price points (green line/shade) where a downward trend may be halted due to a concentration of buying interest. Imagine them as a safety net where buyers step in, preventing further decline.
Resistance Levels: Conversely, resistance levels (red line/shade) are where upward trends might stall due to increased selling interest. They act like a ceiling where sellers come in to push prices down.
Breakouts:
Bullish Breakout: When the price moves above resistance, it often indicates strong buying interest and the potential for a continued uptrend. Traders may view this as a signal to buy or hold.
Bearish Breakout: When the price falls below support, it can signal strong selling interest and the potential for a continued downtrend. Traders might see this as a cue to sell or avoid buying.
MA Ribbon (EMA 20, EMA 50, EMA 100, EMA 200) :
Above EMA: If the stock price is above the EMA, it suggests a potential uptrend or bullish momentum.
Below EMA: If the stock price is below the EMA, it indicates a potential downtrend or bearish momentum.
Trendline: A trendline is a straight line drawn on a chart to represent the general direction of a data point set.
Uptrend Line: Drawn by connecting the lows in an upward trend. Indicates that the price is moving higher over time. Acts as a support level, where prices tend to bounce upward.
Downtrend Line: Drawn by connecting the highs in a downward trend. Indicates that the price is moving lower over time. It acts as a resistance level, where prices tend to drop.
Disclaimer:
I am not a SEBI registered. The information provided here is for learning purposes only and should not be interpreted as financial advice. Consider the broader market context and consult with a qualified financial advisor before making investment decisions.
NIFTY trade ideas

Nifty 22848 Trend directionNifty 22848 - is moving in uptrend channel. Expected to test 22970, 23050

STRONG UPMOVE as expected! What’s next? As we can see NIFTY finally showed its strength after testing our patience as discussed in our previous analysis that it formed bullish flag-pole pattern. Now following the structure we can see more room for upmove in NIFTY reaching its trendline resistance but based on global cues we can expect a weaker opening can be followed by strong closing so plan your trades accordingly and keep watching.

*Is Nifty turning Bullish..?***Market Overview**
The Nifty 50 index has experienced a significant downtrend since late 2024, with persistent selling pressure driving prices lower. However, recent price action suggests that buyers are attempting to stage a recovery. The question remains: **Is this a real reversal or just a temporary bounce?
In this analysis, we’ll break down the technical structure, key levels, indicator readings, and potential trade setups to help traders make informed decisions.
1. Market Structure & Trend Analysis
**Trend Direction:**
- The index recently found support at **22,307 – 22,738**, leading to a bounce.
- Multiple "Buy" signals indicate a possible reversal, but confirmation is needed.
**Key Support & Resistance Levels:
- **Resistance:**
- 23,043 (**38.2% Fibonacci Retracement**)
- 23,612 (**50% Fibonacci Retracement**)
- 24,108 (**61.8% Fibonacci Retracement**)
- **Support:**
- 22,738 (**Immediate support**)
- 22,307 (**Critical level**)
- 22,008 (**Major long-term support**)
**Price Pattern:**
- Nifty is trading within a **descending channel**.
- A **breakout above 23,043** could confirm a bullish reversal.
- A breakdown **below 22,307** could accelerate selling momentum.
2. Indicator Analysis**
Trend Meter (Momentum Indicator)**
- Mixed **green and red bars** suggest **market indecision**.
- More green bars are needed to confirm a trend shift.
Moving Averages & EMA Trend
- Price is still **below key EMAs**, meaning the overall trend is bearish.
- A breakout **above 23,043** is necessary for trend confirmation.
3. Trade Scenarios & Strategy
#*Bullish Scenario: If Price Holds Above 22,738**
- If Nifty **breaks & closes above 23,043**, expect an upside move toward **23,612 – 24,108**.
#* Bearish Scenario: If Price Breaks Below 22,307**
- If Nifty **fails to hold 22,738**, it could test **22,307**.
- If **22,307 breaks**, expect a further decline toward **22,008**.
**Conclusion**
🔹 **Nifty is at a crucial decision point.**
🔹 **Buyers must push above 23,043 for a confirmed reversal.**
🔹 **Sellers regain control if 22,738 breaks.**

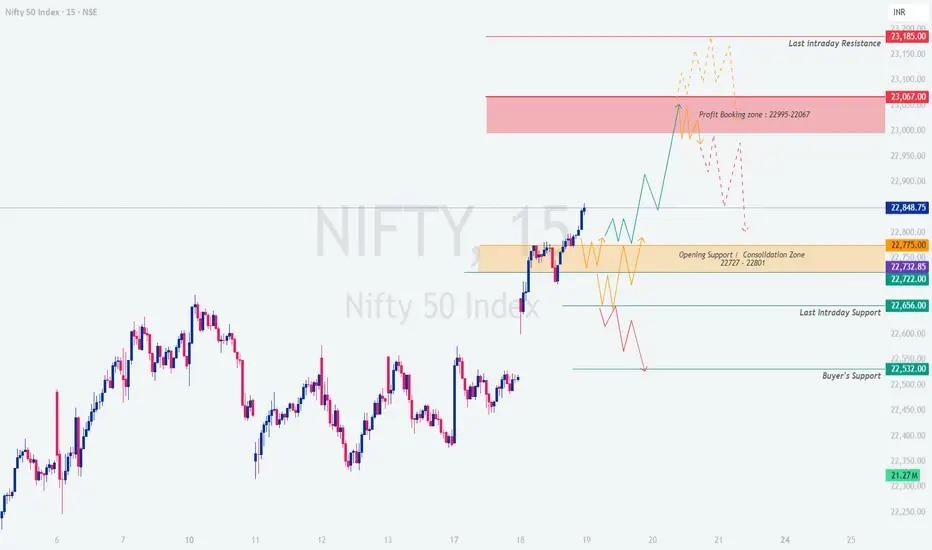
NIFTY : Intraday Trading Levels and Plan for 19-March-2025🔥 NIFTY – Intraday Trading Plan for 19-Mar-2025
Current Market Price (CMP): 22,848.75
Chart Time Frame: 15-min
📘 Opening Scenario 1: GAP-UP Opening (100+ points)
If NIFTY opens with a strong gap-up above 22,950, it would directly open into the Profit Booking Zone: 22,995 – 23,067 .
Avoid aggressive long entries near the opening if prices directly hit the profit booking zone, as early buying could trap latecomers. Wait and observe price action in the 22,995 – 23,067 range. If the index forms bullish consolidation with strength, breakout above 23,067 can push it towards the final resistance at 23,185. If rejection occurs near this zone, look for reversal signals like a 15-min bearish candle with follow-up selling to consider short scalps targeting back to 22,850 – 22,775.
🧠 Tip: Avoid call option entries if IVs are inflated and premiums are already factored in after a big gap-up. Time decay can eat your premiums fast.
📗 Opening Scenario 2: FLAT Opening (within 50-80 pts)
In case of a flat or minor gap opening near 22,800 – 22,850, the price will open just above the key consolidation zone: 22,727 – 22,801 .
Look for first 15-30 minutes consolidation. If NIFTY sustains above 22,801, fresh buying can push it to test 22,995. A failure to sustain above 22,801 and breakdown below 22,775 will drag prices back into the range. The downside targets then would be 22,656 and 22,532. No trade zone for flat opening: avoid trades inside 22,727 – 22,775, unless a directional breakout occurs.
🧠 Tip: For flat openings, best setups come after the first 15-30 minutes. Let the market decide the direction first—then align your trade.
📙 Opening Scenario 3: GAP-DOWN Opening (100+ points)
A gap-down below 22,700 will place the index back into or below the consolidation zone. Major supports are at 22,656**, 22,532, and Buyers’ Support: 22,270 – 22,320.
Aggressive buying should be avoided unless NIFTY shows strong reversal signals from support zones like 22,532 or 22,270. If prices bounce from the Buyers’ Support Zone, a quick upside retracement towards 22,656 or even 22,727 is possible. However, if NIFTY breaks below 22,270, it could enter a deeper correction territory—so keep strict stop losses.
🧠 Tip: When buying the dip in a gap-down scenario, use options spreads (e.g., bull call spreads) to reduce premium decay risk while maintaining upside exposure.
💡 Risk Management Tips for Options Traders:
✅ Use defined-risk strategies like spreads (Bull Call / Bear Put)
✅ Avoid chasing momentum in the first 15 minutes of market opening
✅ Stick to 1–2 high probability trades per day
✅ Always place stop loss based on structure or candle close
✅ Never average into losing options trades—respect time decay
✅ Focus on ATM or slightly OTM contracts with 1–2 day expiry for best gamma moves
📊 Summary & Conclusion:
Key Zones to Watch:
🔸 Resistance Zone: 22,995 – 23,067
🔸 Support Zone: 22,656 – 22,532
🔸 Buyers’ Zone: 22,270 – 22,320
🔸 No Trade Zone: 22,727 – 22,775
Be reactive, not predictive. Let price action guide your trades based on these levels. Respect volatility and avoid emotional trades.
⚠️ Disclaimer: I am not a SEBI registered analyst. The above levels and insights are for educational purposes only. Please consult your financial advisor before taking any positions. Trade responsibly! 💼📉
Nifty Review & Analysis - DailyNifty opened Gap up 150 points following Global Cues and saw surge throughout the day making a high of 22857 and closing at 22834 +1.45%
Price Action : - Bullish
Nifty closed 1.5% in positive.
Candle Pattern:
Formed a Big Green candle with a small wick on upside.
Daily EMA Positioning:
10dEMA 22540
20dEMA 22623
50dEMA 22992
200dEMA 23404
EMA Trend:
Closed above 10dEma and 20dEma,
Daily MA suggests Buy
Hourly suggests Buy
15mins Suggests Strong Buy
The momentum indicator, RSI - Relative Strength Index at 54
Momentum gaining towards Upside
Support/Resistance Levels:
Major Support 22750
Immediate Support 22500
Immediate Resistance 22900
Major Resistance 23000
Trend:
Short Term Trend is Slight Bullish
Daily Options Activity:
Highest CE OI was at 23000 with highest addition at 23000 - Resistanc
Highest CE unwinding see at 22700 - Support
Highest PE OI was at 22500, highest Put addition seen at 22600, 22700 - support
PCR is 1.4 indicating Bullishness
Daily Futures Activity FII + Pro F&O Data:
FII Long/Short ratio at 24%/76% indicating slowly addition of Longs by FIIs - Bullish
Change in Futures OI:
FII Future positions saw little addition in longs +7K with -2K change in shorts -Bullish
Nifty Futures price was higher with 0.7% OI addition - Bullish
Observation:
Overall looks a positive breakout above 22600, with good PE addition at 22600 & 22700 levels can see
higher levels if 22850 taken out for targets 23000 in shortterm
Overall Trend:
Sideways consolidating turning positive
Outlook for Next Session:
Nifty looks strong above 22700, untill breakout above 23000 it might consolidate
Approach & Strategy:
Wait and watch as last 2 day’s strategy worked perfectly and Nifty has given around 500 points in 2 days, i would wait till 22900-23000 taken out for further Longs
My Trades & Positions:
Closed Long positions at 22800+ held from 22340.

Excellent Break Out by Nifty. Will the momentum continue?Today the Nifty had a good leap after a lot of consolidation. The key question is will the momentum continue or FIIs will again take this opportunity to book profit. Today FII is on the net buying side after a long time. If the buying continues or even if FII remains neutral there is a good chance that we can see upside from here.
Key resistances for Nifty remain at 22857, 22921 and 22985. Above 22985 Nifty can gain more strength and may try to regain the levels of 23044, 23147 and 23249. 23404 as of now remains a mega resistance which is also the 200 days EMA of 200 days Father line. This zone as of now is little difficult to cross. Closing above 23404 can give might boost to the Bulls and a new Bull run can begin post closing above this point. Supports for Nifty at this juncture remain at 22726 (200 hours EMA or Father line of Hourly chart), 22594 and 22543. A closing below 22543 which is the Mother line support of the hourly chart or the (50 Hours EMA).
As there are small signs of reversal on the cards. It is a good time to read my book the Happy Candles Way to Wealth Creation. This is one of the highest rated books on Amazon. This book will teach you Behavioural Finance, Fundamental Analysis and Technical analysis. Every Bull Rally has a top and every Bear run has a bottom. If you can identify them. If you can understand the risk reward ratio. If you can understand the profit booking points, entry points the Mother, Father and the Small Child theory. The magic of Mother and Father lines. There is a lot of money to be made in the stock market. You need to learn, study and form your own strategy. If you want a ready made strategy then this book offers Happy Candles Number Strategy. All these things will help you in creating generational wealth. Do read my book and evolve into a Magnificent Investor and a Wealth creator. The Book is only priced at Rs.349 go ahead grab your copy.
Disclaimer: The above information is provided for educational purpose, analysis and paper trading only. Please don't treat this as a buy or sell recommendation for the stock or index. The Techno-Funda analysis is based on data that is more than 3 months old. Supports and Resistances are determined by historic past peaks and Valley in the chart. Many other indicators and patterns like EMA, RSI, MACD, Volumes, Fibonacci, parallel channel etc. use historic data which is 3 months or older cyclical points. There is no guarantee they will work in future as markets are highly volatile and swings in prices are also due to macro and micro factors based on actions taken by the company as well as region and global events. Equity investment is subject to risks. I or my clients or family members might have positions in the stocks that we mention in our educational posts. We will not be responsible for any Profit or loss that may occur due to any financial decision taken based on any data provided in this message. Do consult your investment advisor before taking any financial decisions. Stop losses should be an important part of any investment in equity.

How to decide Nifty decisive bull move for long term from here ?1. First nifty price has to exit parallel channel to be able to anticipate a bullish move
2. Break of Previous swing high confirms the buyers interest at higher prices.
3. Break above the equal highs lies a Long standing liquidity. sweep of all these sell stops, potentially removes weak bears
4, 5. A short term low is a possibility above which price might move with double the strength of both bulls buyers and sellers covering.

Bulletin.....2025-03-18.....It runs into my cited target area!Hello Traders,
this time I'd like to show you a lower timeframe to analyze the chart.
Let's dive in the 15 minutes time area.
The possible wave b-low @ 22329.55 was all of waves ((b))! The move to the upside probably was a wave ((c)) up, and it is developing within an impulsive structure. One target for this idea is around 22900 area. This would end a wave ((iii)) of (iii) of ((c))!
Keep in mind, that wave iv always can morph into a triangle or a variation thereof!
But this is the chance, with the lowest probability!
That's it for today......
Have a great week.....
Ruebennase
Please ask or comment as appropriate.
Trade on this analysis at your own risk.

The Elliott WaveThe chart above shows the 5 waves which has been travelled by nifty
As per the Elliott wave pattern the coming waves will be a major correction waves with 'ABCDE' pattern most probably, of which wave 'A' has been made by nifty.
NSE:NIFTY

NIFTY-Breakout Above 23,100 Signals Bullish MomentumNIFTY 23,000 as Key Resistance; Breakout Above 23,100 Signals Bullish Momentum
The NIFTY 50 index is currently facing resistance at the 23,000 level. A decisive close above 23,100, accompanied by strong trading volume, would confirm a breakout and signal further upside potential. This move would reinforce bullish sentiment and could lead to continued upward momentum.
Traders should closely monitor volume confirmation to validate the breakout. If sustained, the next potential resistance levels could be 23,500–23,800, while failure to hold above 23,100 may trigger a pullback toward 22,800–22,900.
Disclaimer: This is for demonstration and educational purpose only. this is not buying and selling recommendations. I am not SEBI registered. please consult your financial advisor before taking any trade.

NIFTY50 Bearish Sentiment - MARCH 2025TradingView - NIFTY50 - Correction is due and the month of March is having a bearish sentiment. Trade with care for the upside, downside is evident, Sell on Highs is the Trading Strategy. Trading View is Bearish!

NIFTY Flag BreakoutNIFTY...Finally after a long time has given a good AD ratio...Flat was forming now broke out...see chart...tgt calculated and marked on the chart....Good momentum also exists...Also note if the tgt is achieved ..then on a larger time frame a larger pattern will be broken..But we will come to that once that is achieved..Now we wait for this tgt to be achieved.

#NIFTY Intraday Support and Resistance Levels - 18/03/2025Gap up opening expected in nifty. Expected opening near 22700 level. After opening if nifty starts trading above 22750 level then possible strong upside rally upto 22950+ in today's session. Any downside or reversal expected near a 22700 level. Downside 22550 level will act as a strong support for today's session. Major downside only expected below 22500 level.

[INTRADAY] NIFTY PE & CE Levels(18/03/2025)Today will be a gap up opening in NIFTY 50. whether the NIFTY 50 will have a gap-up or gap-down opening is highly speculative and depends on a variety of factors, including global market trends, economic data, geopolitical events, and corporate earnings reports.

What the NIfty Data Points as on 18 march 2025?What the NSE:NIFTY Data Points as on 18 march 2025 📈
Key Observations:🔍
- Spot Price & Max Pain:Spot Price: 22,508.75
- Max Pain: 22,500
- The max pain theory suggests that the price might
gravitate towards 22,500 by expiry.
Open Interest (OI) & OI Change:📊
High OI build-up at 22,500 and 22,600 strike prices.
Call writing seen at 22,600 and 22,700, indicating resistance.
Put writing seen at 22,500 and 22,400, suggesting support.
Put-Call Ratio (PCR):🔗
PCR ~ 1.08, indicating a slightly bullish to neutral sentiment.
PCR > 1 suggests that more puts are being written, which generally supports the price.
Technical Price Data:⚙📈📉
Nifty is trading at 22,510-22,515.
Resistance seen near 22,600, as call writers are active.
Support at 22,500 and 22,450, as put writers are strong.
Trading Strategy for Nifty🧠
1. Intraday Trading Plan (March 18, 2025)
Entry: Buy around 22,500-22,510 (if Nifty sustains above 22,500).
Target: 22,570-22,600 (resistance level).
Stop Loss: 22,470 (below put writers' support at 22,450).
Reasoning:
Support is strong at 22,500, backed by put writing.
Max pain is at 22,500, meaning price may stabilize or rebound from there.
PCR > 1 suggests mild bullishness.
2. Swing Trading Plan (For Next 2-3 Days)
Bullish View (If Nifty stays above 22,500):Entry: Buy around 22,500-22,520
Target: 22,650-22,700 (resistance zone).
SL: 22,450
Bearish View (If Nifty breaks below 22,500 with volume):Entry: Short below 22,490
Target: 22,400-22,350 (next put support).
SL: 22,550
Final Thoughts
The market is slightly bullish but facing resistance at 22,600.
Any break below 22,500 can trigger a fall towards 22,400-22,350.
If Nifty holds above 22,500, a rally to 22,600-22,650 is likely.

18 March Nifty50 important level trading zone #Nifty50
99% working trading plan
Gap up open 22608 above & 15m hold after positive trade target 22708, 22870
Gap up open 22608 below 15 m not break upside after nigetive trade target 22428,22370
Gap down open 22428 above 15m hold after positive trade target 22608, 22708+
Gap down open 22428 below 15 m not break upside after nigetive trade target 22370, 22270
💫big gapup open 22710 above hold 1st positive trade view & 22710 below nigetive view
💫big Gapdawon opening 22370 below nigetive trade view, 22370 above positive trade view
📌For education purpose I'm not responsible your trade
More education following me

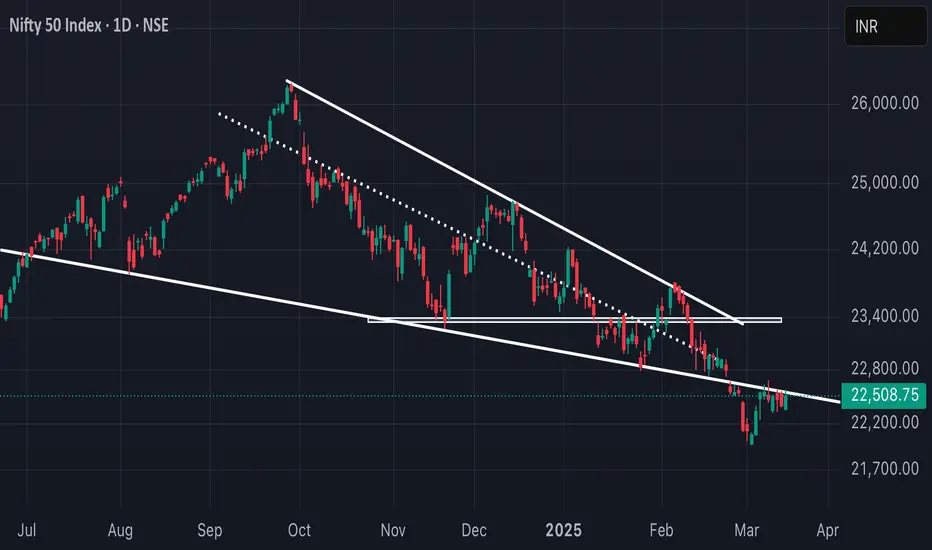
$NIFTY : Tested 22000 fib retracement. RSI Oversold. Long $NIFTYIn 2024 the light bearer of the developing markets was India and its index $NIFTY. It closely beat the S&P 500 in 2024. But 2025 has not been good for $NIFTY. The rotation trade sell India and buy Chinna by the large institutional investors has put immense pressure on the Indian indexes. The index almost fell into the bear market by collapsing close to 20%.
If you have been watching my blog space I made a case in point on 22 Feb 2025 that there is still some downside left in the chart. Since then, we have fallen another 2 % and sitting just at the bottom of the Upward sloping Fib Retracement channel drawn by joining the potential tops of the NSE:NIFTY weekly chart. The chart pattern on 22 Feb 2025 clearly indicated that we can touch the lows around 22000. We touched the lows of 22032 on 28 Feb 2025. Since the we have gained some lost ground.
Final verdict: Possible retest the 22000 levels and then go long from there on $NIFTY.

NIFTY showing signs of REVERSAL As we can see NIFTY can be seen in more like flag-pole pattern which shows bullish continuation structure and trading around resistance which previously acted as support making it weaker hence any closing above the pattern can show 23000++ in no time so plan your trades accordingly and keep watching.
Nifty Ready for some great movesNifty greatly approach to 22000 and clearly respected it now due to low RR we are Ready for some kind of short cover which will be quick enough which will let you think to sell on high but the institution will go with buy the dips☠️☠️

NIFTY : Intraday Trading Levels and Plan for 18-Mar-2025📅 NIFTY INTRADAY TRADING PLAN – 18th March 2025 (Tuesday)
🕒 Timeframe: 15 Min | 📍Reference Closing: 22,515
📉 CHART STRUCTURE EXPLAINED:
Nifty closed near the middle of the Opening Resistance / Support Zone (22,508–22,547). There are clearly defined areas of support and resistance on both sides that help frame our intraday plan. Price action around these zones will provide direction for high-probability trades.
🟩 GAP-UP OPENING (100+ points): Above 22,617
If Nifty opens above the Last Intraday Resistance (22,617), it enters a potential breakout zone.
Avoid entering trades immediately after a GAP-UP above 22,617. Let the index retest this level for confirmation. If the price sustains above 22,617 for 15 minutes with higher volume, expect a continuation rally towards the Profit Booking Zone (22,727–22,801). Wait for a dip near 22,617 or even the upper band of 22,547. If the retest holds, go long with SL below 22,547. Profit booking is advised near 22,727–22,801 as this zone is likely to attract selling. Avoid fresh longs near 22,800 unless there’s a consolidation breakout.
🧠 Educational Note: Chasing GAP-UPs leads to poor entries. The best trades happen when price retests a broken resistance and confirms support.
🟨 FLAT OPENING (Within 22,508–22,547 Zone)
This is the Opening Resistance / Support Zone — a tricky area that demands patience.
Avoid trading in the first 15–30 minutes if price opens inside the 22,508–22,547 zone. It’s a chop zone, prone to false breakouts. A breakout above 22,547 with volume gives a long opportunity towards 22,617, and eventually 22,727. A breakdown below 22,508 brings the price into the Opening Support Zone (22,403–22,420). Watch for reversal signs here for possible bounce trades. Only consider directional trades once Nifty decisively exits this range.
🧠 Tip: In tight ranges, option premiums decay faster. Avoid entering trades without confirmation.
🟥 GAP-DOWN OPENING (100+ points): Below 22,403
If Nifty opens below the Opening Support Zone, volatility increases and levels become more critical.
Support is visible at the Buyers' Zone (22,210–22,247). If the index opens around this zone, wait for a reversal pattern like bullish engulfing or double bottom on 15-min chart. If 22,210 holds with a strong bounce, a long can be initiated targeting 22,403–22,508 with SL below 22,210. However, if 22,210 breaks with conviction, bears may drag the index to 21,950–22,000 levels. Avoid shorts immediately at open—wait for either breakdown retest or confirmation below 22,210.
🧠 Insight: Panic gap-downs often trigger short-covering rallies. Watch how price behaves in the first hour.
📘 RISK MANAGEMENT TIPS FOR OPTION TRADERS:
🛡️ Risk management is your ultimate edge in the market. Follow these key principles:
Never trade options without a stop loss. Monitor levels, not just premium prices. Avoid selling far OTM options when market structure is trending. It’s a trap during sharp moves. If market is inside range, go with spreads instead of naked options to reduce Theta burn. Size your positions wisely—don’t risk more than 1–2% of total capital on a single trade. Always book partial profits at target zones and trail the rest with a stop.
🧠 Options are like ice—they melt fast in choppy markets. Patience and timing are key!
📌 SUMMARY & CONCLUSION:
✅ Resistance Levels: 22,617 / 22,727 / 22,801
✅ Support Levels: 22,403 / 22,210
✅ Critical Zones:
⚠️ 22,508–22,547 (Opening Decision Zone)
✅ 22,403–22,420 (Support)
🛑 22,727–22,801 (Profit Booking Zone)
👉 Wait for confirmation before entering. Let market structure guide your direction, not emotions.
❗ Disclaimer: I am not a SEBI registered analyst. This plan is shared purely for educational purposes. Please consult with your financial advisor before making any trading decisions.

Nifty Review & Analysis - DailyNifty opened Falt in line with global cues and saw buying from opening making a high of 22577 then to find some profit booking to close at 22509, 0.5% above previous day’s close.
Price Action : - Bullish
Nifty closed 0.5% in positive.
Candle Pattern:
Formed a Big Green candle with a small wick on uopside.
Daily EMA Positioning:
10dEMA 22476
20dEMA 22601
50dEMA 22999
200dEMA 23410
EMA Trend:
Closed above 10dEma finding resistance at 20dEma,
Daily MA suggests Selling
Hourly suggests Buy
15mins Suggests Strong Buy
The momentum indicator, RSI - Relative Strength Index rising above 42
Support/Resistance Levels:
Major Support 22400
Immediate Support 22300
Immediate Resistance 22580
Major Resistance 22750
Trend:
Overall Trend is Slight Bullish above 22600
Daily Options Activity:
Highest CE OI was at 23000 with highest addition at 22800 - Resistance
Highest PE OI was at 22000, highest Put writing seen at 22500, 22300 - support
PCR is 1 indicating slight positive
Daily Futures Activity FII + Pro F&O Data:
FII Long/Short ratio at 21%/79% indicating slowly addition of Longs by FIIs
Change in Futures OI:
FII Future positions saw little addition in longs +2K with -1K change in shorts
Nifty Futures price was slightly higher with no major OI addition
Observation:
Overall looks a positive consolidation day above 22500, with good PE addition at 22500 can see
higher levels if 22580 taken out for targets 22700-800 in currents wkly series
Overall Trend:
Sideways consolidating turning positive
Outlook for Next Session:
Nifty looks strong above 22580 for tgt 22750-800
Approch & Strategy:
Long above 22580 for tgt 22750-800
My Trades & Positions:
Holding Longs from 22450 levels

Nifty holding above Hourly Mother line a good signalNifty holding above 50 Hours EMA or Mother line in the hourly chart is a good signal for the market if it holds above 22464 then there is a chance of further recovery. The supports for Nifty remain at 22464 (strong Mother line support), 22368 (Another strong trend line support), 22311 and 22205. If the support at 22205 is broken Nifty can go in a jiffy to 21976 or below. In case we get a closing above 22591 Nifty will become stronger and can jump to 22678 or 22722 levels. 22722 is a strong 200 Hours EMA or Father line resistance. A closing above 22722 can take us to next historical resistance levels of 22813, 22921, 23044, 23147 and 23249 levels. Closing above 23249 has potential to bring Bulls back out of ICU and Take Nifty further up.
Disclaimer: The above information is provided for educational purpose, analysis and paper trading only. Please don't treat this as a buy or sell recommendation for the stock or index. The Techno-Funda analysis is based on data that is more than 3 months old. Supports and Resistances are determined by historic past peaks and Valley in the chart. Many other indicators and patterns like EMA, RSI, MACD, Volumes, Fibonacci, parallel channel etc. use historic data which is 3 months or older cyclical points. There is no guarantee they will work in future as markets are highly volatile and swings in prices are also due to macro and micro factors based on actions taken by the company as well as region and global events. Equity investment is subject to risks. I or my clients or family members might have positions in the stocks that we mention in our educational posts. We will not be responsible for any Profit or loss that may occur due to any financial decision taken based on any data provided in this message. Do consult your investment advisor before taking any financial decisions. Stop losses should be an important part of any investment in equity.
