NIFTY showing signs of REVERSAL As we can see NIFTY can be seen in more like flag-pole pattern which shows bullish continuation structure and trading around resistance which previously acted as support making it weaker hence any closing above the pattern can show 23000++ in no time so plan your trades accordingly and keep watching.
NIFTY trade ideas
Nifty Ready for some great movesNifty greatly approach to 22000 and clearly respected it now due to low RR we are Ready for some kind of short cover which will be quick enough which will let you think to sell on high but the institution will go with buy the dips☠️☠️

NIFTY : Intraday Trading Levels and Plan for 18-Mar-2025📅 NIFTY INTRADAY TRADING PLAN – 18th March 2025 (Tuesday)
🕒 Timeframe: 15 Min | 📍Reference Closing: 22,515
📉 CHART STRUCTURE EXPLAINED:
Nifty closed near the middle of the Opening Resistance / Support Zone (22,508–22,547). There are clearly defined areas of support and resistance on both sides that help frame our intraday plan. Price action around these zones will provide direction for high-probability trades.
🟩 GAP-UP OPENING (100+ points): Above 22,617
If Nifty opens above the Last Intraday Resistance (22,617), it enters a potential breakout zone.
Avoid entering trades immediately after a GAP-UP above 22,617. Let the index retest this level for confirmation. If the price sustains above 22,617 for 15 minutes with higher volume, expect a continuation rally towards the Profit Booking Zone (22,727–22,801). Wait for a dip near 22,617 or even the upper band of 22,547. If the retest holds, go long with SL below 22,547. Profit booking is advised near 22,727–22,801 as this zone is likely to attract selling. Avoid fresh longs near 22,800 unless there’s a consolidation breakout.
🧠 Educational Note: Chasing GAP-UPs leads to poor entries. The best trades happen when price retests a broken resistance and confirms support.
🟨 FLAT OPENING (Within 22,508–22,547 Zone)
This is the Opening Resistance / Support Zone — a tricky area that demands patience.
Avoid trading in the first 15–30 minutes if price opens inside the 22,508–22,547 zone. It’s a chop zone, prone to false breakouts. A breakout above 22,547 with volume gives a long opportunity towards 22,617, and eventually 22,727. A breakdown below 22,508 brings the price into the Opening Support Zone (22,403–22,420). Watch for reversal signs here for possible bounce trades. Only consider directional trades once Nifty decisively exits this range.
🧠 Tip: In tight ranges, option premiums decay faster. Avoid entering trades without confirmation.
🟥 GAP-DOWN OPENING (100+ points): Below 22,403
If Nifty opens below the Opening Support Zone, volatility increases and levels become more critical.
Support is visible at the Buyers' Zone (22,210–22,247). If the index opens around this zone, wait for a reversal pattern like bullish engulfing or double bottom on 15-min chart. If 22,210 holds with a strong bounce, a long can be initiated targeting 22,403–22,508 with SL below 22,210. However, if 22,210 breaks with conviction, bears may drag the index to 21,950–22,000 levels. Avoid shorts immediately at open—wait for either breakdown retest or confirmation below 22,210.
🧠 Insight: Panic gap-downs often trigger short-covering rallies. Watch how price behaves in the first hour.
📘 RISK MANAGEMENT TIPS FOR OPTION TRADERS:
🛡️ Risk management is your ultimate edge in the market. Follow these key principles:
Never trade options without a stop loss. Monitor levels, not just premium prices. Avoid selling far OTM options when market structure is trending. It’s a trap during sharp moves. If market is inside range, go with spreads instead of naked options to reduce Theta burn. Size your positions wisely—don’t risk more than 1–2% of total capital on a single trade. Always book partial profits at target zones and trail the rest with a stop.
🧠 Options are like ice—they melt fast in choppy markets. Patience and timing are key!
📌 SUMMARY & CONCLUSION:
✅ Resistance Levels: 22,617 / 22,727 / 22,801
✅ Support Levels: 22,403 / 22,210
✅ Critical Zones:
⚠️ 22,508–22,547 (Opening Decision Zone)
✅ 22,403–22,420 (Support)
🛑 22,727–22,801 (Profit Booking Zone)
👉 Wait for confirmation before entering. Let market structure guide your direction, not emotions.
❗ Disclaimer: I am not a SEBI registered analyst. This plan is shared purely for educational purposes. Please consult with your financial advisor before making any trading decisions.

Nifty Review & Analysis - DailyNifty opened Falt in line with global cues and saw buying from opening making a high of 22577 then to find some profit booking to close at 22509, 0.5% above previous day’s close.
Price Action : - Bullish
Nifty closed 0.5% in positive.
Candle Pattern:
Formed a Big Green candle with a small wick on uopside.
Daily EMA Positioning:
10dEMA 22476
20dEMA 22601
50dEMA 22999
200dEMA 23410
EMA Trend:
Closed above 10dEma finding resistance at 20dEma,
Daily MA suggests Selling
Hourly suggests Buy
15mins Suggests Strong Buy
The momentum indicator, RSI - Relative Strength Index rising above 42
Support/Resistance Levels:
Major Support 22400
Immediate Support 22300
Immediate Resistance 22580
Major Resistance 22750
Trend:
Overall Trend is Slight Bullish above 22600
Daily Options Activity:
Highest CE OI was at 23000 with highest addition at 22800 - Resistance
Highest PE OI was at 22000, highest Put writing seen at 22500, 22300 - support
PCR is 1 indicating slight positive
Daily Futures Activity FII + Pro F&O Data:
FII Long/Short ratio at 21%/79% indicating slowly addition of Longs by FIIs
Change in Futures OI:
FII Future positions saw little addition in longs +2K with -1K change in shorts
Nifty Futures price was slightly higher with no major OI addition
Observation:
Overall looks a positive consolidation day above 22500, with good PE addition at 22500 can see
higher levels if 22580 taken out for targets 22700-800 in currents wkly series
Overall Trend:
Sideways consolidating turning positive
Outlook for Next Session:
Nifty looks strong above 22580 for tgt 22750-800
Approch & Strategy:
Long above 22580 for tgt 22750-800
My Trades & Positions:
Holding Longs from 22450 levels

Nifty holding above Hourly Mother line a good signalNifty holding above 50 Hours EMA or Mother line in the hourly chart is a good signal for the market if it holds above 22464 then there is a chance of further recovery. The supports for Nifty remain at 22464 (strong Mother line support), 22368 (Another strong trend line support), 22311 and 22205. If the support at 22205 is broken Nifty can go in a jiffy to 21976 or below. In case we get a closing above 22591 Nifty will become stronger and can jump to 22678 or 22722 levels. 22722 is a strong 200 Hours EMA or Father line resistance. A closing above 22722 can take us to next historical resistance levels of 22813, 22921, 23044, 23147 and 23249 levels. Closing above 23249 has potential to bring Bulls back out of ICU and Take Nifty further up.
Disclaimer: The above information is provided for educational purpose, analysis and paper trading only. Please don't treat this as a buy or sell recommendation for the stock or index. The Techno-Funda analysis is based on data that is more than 3 months old. Supports and Resistances are determined by historic past peaks and Valley in the chart. Many other indicators and patterns like EMA, RSI, MACD, Volumes, Fibonacci, parallel channel etc. use historic data which is 3 months or older cyclical points. There is no guarantee they will work in future as markets are highly volatile and swings in prices are also due to macro and micro factors based on actions taken by the company as well as region and global events. Equity investment is subject to risks. I or my clients or family members might have positions in the stocks that we mention in our educational posts. We will not be responsible for any Profit or loss that may occur due to any financial decision taken based on any data provided in this message. Do consult your investment advisor before taking any financial decisions. Stop losses should be an important part of any investment in equity.

Nifty - 2 hr - ABCDE about to completeBearish pattern looks close to completion or already done
Shorts need to start booking out. Decent risk reward on longs

Nifty Elliott Wave Update – Wave 4 Retracement in Play?Following up on my previous analysis, I’ve adjusted the wave counts for 1 and 2 within the final wave C. One key observation is that wave 3 ended exactly at 1.618x wave 1, reinforcing the need to remap the earlier structure.
Currently, Nifty seems to be in wave 4 retracement, and I’ve marked a potential reversal zone (green box) based on Fibonacci levels. If this plays out, we could see the final wave 5 extending downward, possibly into the yellow box, aligning with Fib projections.
The overall bias remains bearish unless we see a strong invalidation. Let’s see how this unfolds!

NIFTY Intermediate Trend Analysis- Elliott Wave PatternElliott Wave Analysis: Primary Wave Count (Red)
The primary wave structure indicates a completed Wave 4, confirming a corrective phase before a downward impulse begins.
The Wave 4 retracement appears to be near the 38.2% Fibonacci level, which aligns with a standard correction before a continuation downward.
Intermediate Wave Count (Purple)
A smaller intermediate wave count is visible, showing the beginning of a downward movement.
The first Wave 1 (down) is confirmed as the price moves below 22,300, indicating the start of an impulsive decline.
A Wave 2 retracement may have formed, but it seems weak and unable to break back above resistance.
Downside Projection -
If NIFTY sustains below 22,300, it confirms a continued downward move.
Next key support levels:
22,000 – Psychological level & minor support
21,500 – Strong Fibonacci confluence and major demand zone
The final target could be 21,300 if Wave 3 extends significantly downward.
Momentum Confirmation -
The Awesome Oscillator (AO) show a going to confirm bearish crossover.
Volume appears to be increasing on red candles, supporting the downward wave structure.
The failure confirmation marked on the chart strengthens the case for bearish momentum.
Conclusion & Trading Strategy:
Bearish Bias: As long as NIFTY remains below 22,300, expect further downside. Expecting Targets: 22,000 → 21,500 → 21,300.
Disclaimer:
This Elliott Wave analysis is for educational purposes only and should not be considered financial advice. Market conditions can change rapidly, and proper risk management is essential. Always conduct your own analysis and consult with a financial professional before making any trading decisions.

Nifty 17.3.2025 Analysis As of March 17, 2025, the Nifty 50 index opened higher, rising by 0.42% to 22,492, driven by gains in the financial sector and positive trends in Asian markets following China's new economic measures. citeturn0news14
However, the Indian stock market has been experiencing a downturn over the past months. In February 2025, the Nifty 50 index declined by approximately 15% from its peak in September 2024, marking its worst run in 29 years and erasing about $1 trillion in investor wealth. citeturn0news15
Despite the recent uptick, the market remains volatile. Analysts predict that the Nifty 50 may face further challenges, with resistance at 22,800 and expected trading ranges between 21,800 to 22,900 in March. citeturn0news15
Investors are advised to exercise caution and stay informed about ongoing market developments.
navlistRecent Developments in the Indian Stock Marketturn0news14,turn0news15

Nifty Trend directionNifty 22397 - Has support at 22310. A close below will confirm the bearish trend. Inverted cup pattern suggest bearishness. A break below 22310 will take down Nifty to 22000.

#NIFTY Intraday Support and Resistance Levels - 17/03/2025Expected gap up opening in nifty near 22500 level. After opening this is an important level for nifty. If nifty starts trading and sustain above 22550 level then expected upside rally upto 22700+ level. Downside reversal expected if nifty not sustain above level and starts trading below 22500. Downside 22350 level will act as a strong support for today's session.

Nifty Data and Trading Strategy for 17 March 2018 NSE:NIFTY Analysis and Trading Strategy
Key Observations:
Nifty Spot Price: 22,397.20
Max Pain: 22,450This suggests that option writers will try to move the market towards this level by expiry.
PCR (Put-Call Ratio): 0.99PCR near 1.0 indicates a balanced market, with no extreme bullish or bearish bias.
A rise above 1.2 suggests bullishness, while a drop below 0.8 suggests bearishness.
OI (Open Interest) Data:Call OI Change: 430.58L (High call writing at resistance levels)
Put OI Change: 369.91L (Put writing suggests strong support)
Total Calls OI: 752.31L vs. Total Puts OI: 745.22L (Almost equal, indicating a neutral stance)
Support and Resistance Levels:
Immediate Resistance: 22,500 (Strong Call Writing)
Immediate Support: 22,300 (Strong Put Writing)
Next Resistance: 22,600
Next Support: 22,200
Trading Plan (March 17, 2025)
Scenario 1: Bullish Setup (Breakout Above 22,450)
Entry: Above 22,450 (Confirm breakout with volume)
Target 1: 22,500
Target 2: 22,600
Stop Loss: 22,350
Reason:If Nifty moves above max pain (22,450), bulls will gain momentum.
PCR indicates a balanced market, but a breakout with volume can trigger further upside.
Scenario 2: Bearish Setup (Breakdown Below 22,350)
Entry: Below 22,350 (Confirm breakdown with volume)
Target 1: 22,300
Target 2: 22,200
Stop Loss: 22,450
Reason:Call writing at 22,500 suggests strong resistance.
Breakdown below 22,350 may lead to further downside towards 22,300 and 22,200.
Final Strategy:
Bias: Neutral to Bullish (Watch for breakout above 22,450)
Intraday Plan:If Nifty opens flat → Wait for breakout/breakdown confirmation
If Nifty opens above 22,450 → Buy on dips
If Nifty opens below 22,350 → Sell on rise
Closing above 22600 will confirm the UPTREND As we can see NIFTY had been in downtrend taking resistance at the previously acting SUPPORT. Now following the candles we can see the RESISTANCE has been tested which has made it weaker hence any closing above 22600 can change the overall trend and can show 23500 in coming trading sessions so plan your trades accordingly and keep watching

Our view on nifty is on upside We are bullish in nifty till our target is achieved
Buy nifty at 22300
Target 22660 22784 23178
Sl 22105
If nifty close below 22080 thn we see 10% downside in it ..

Just a long term market analysis of NIFTY 50NSE:NIFTY Considering the trends and overall global markets this is going to be go down slowly to the 20k range in the coming months. RSI will be moving down to an oversold position. And consolidating in the range of 22.5k and 20k will be the most ideal from my view of analysis.

NIFTYNIFTY SPOT PRICE
MTF Analysis Price Time Frame Trend
NIFTYYearly Demand 18,868 HTF UP
NIFTY 6 Month Demand 19,201 HTF UP
NIFTYQtrly Demand BUFL 22,526 HTF UP
20,198
NIFTYMonthly Demand 20,222 MTF Down
NIFTYWeekly Demand 22,180 MTF Down
NIFTYDaily Demand DMIP 22,060 MTF Down
NIFTYDaily Demand DMIP 21,066 MTF Down
21,382
NIFTY 240 M 22,060 LTF Down
NIFTY 180 M 21,650 LTF Down
NIFTY 120 M 21,650 LTF Down
NIFTY 60 M 21,650 LTF Down
21,753
21,111
ENTRY -1 Long 22,060
SL 21,710
RISK 350
Target as per Entry 23,816
RR 5
Last High 23,806
Last Low 21,964
ENTRY -2 Long 20,950
SL 20,750
RISK 200
Target as per Entry 24,200
Last High 23,806
Last Low 21,964

Nifty Intraday Support & Resistance Levels for 17.03.2025Thursday’s session saw Nifty opening with a gap-up, touching a high of 22,558.05, but it couldn’t sustain the momentum and dropped to a low of 22,377.35 by the end of the day. It closed at 22,397.20, losing 73 points from the previous close. Both the Weekly and Daily Trends (50 SMA) remain negative.
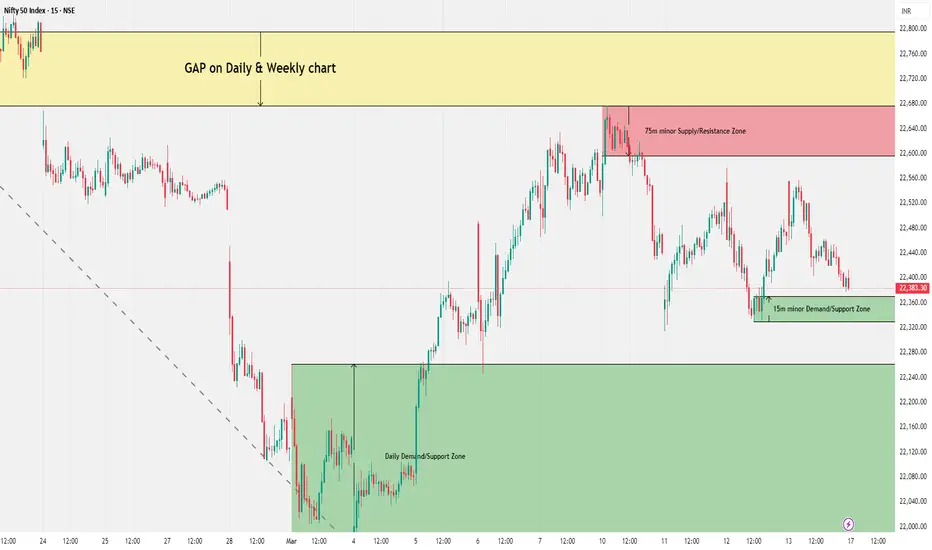
Demand/Support Zones
Near Minor Demand/Support Zone (15m): 22,329.55 - 22,370.20
Near Demand/Support Zone (Daily): 21,964.60 - 22,261.55
Far Support: 21,281.45 (Low of 4th June 2024)
Far Demand/Support Zone (Daily): 20,769.50 - 20,950
Supply/Resistance Zones
Near Minor Supply/Resistance Zone (75m): 22,595.90 - 22,676.75
Far Supply/Resistance Zone (Weekly): 23,222 - 23,807.30
Outlook
The outlook remains unchanged from the previous update—if the Daily Demand Zone support holds, we might see Nifty testing 22,885 or even 23,100 in the coming days. However, continued selling pressure at resistance zones could keep the index range-bound.
NIFTY : Intraday Trading levels and Plan for 17-Mar-2025📊 NIFTY Trading Plan – 17-Mar-2025
Nifty is currently hovering near the Opening Support Zone: 22,351 – 22,378, with a key resistance at 22,442 and profit booking zone near 22,617. Depending on how the market opens, we will plan our trades accordingly.
💡 Let’s analyze different scenarios:
🔥 Scenario 1: Gap-Up Opening (100+ Points)
If Nifty opens above 22,442, the index will test the last intraday resistance at 22,551. A decisive breakout above 22,617 may trigger strong bullish momentum.
✅ Plan of Action:
If Nifty sustains above 22,551, look for bullish price action and enter longs with targets of 22,617 and 22,680+.
If a sharp rejection occurs near 22,617, consider booking partial profits and trail SL.
Avoid chasing longs if Nifty starts showing weakness near resistance. Wait for a pullback.
📌 Key Levels to Watch: 22,442 (Support) | 22,551 (Breakout Zone) | 22,617+ (Profit Booking Zone).
📢 Tip: In case of a fake breakout above 22,617, selling pressure may drag Nifty back to 22,442. Watch for reversal patterns before taking aggressive trades.
📉 Scenario 2: Flat Opening (Within 50 Points)
If Nifty opens near 22,383 – 22,434, we will monitor price action near the Opening Support/Resistance Zone. The first 30 minutes will be crucial for direction confirmation.
✅ Plan of Action:
If Nifty bounces from 22,351 – 22,378, look for long opportunities targeting 22,442 and 22,551.
If Nifty struggles to hold 22,442, expect sideways action. Trade only near major levels.
A breakdown below 22,351 will indicate weakness, leading to a test of 22,296 and 22,208.
📌 Key Levels to Watch: 22,351 – 22,378 (Support Zone) | 22,442 (Resistance) | 22,551 (Breakout Confirmation).
📢 Tip: Use a wait-and-watch approach in the first 30 minutes. Let the market establish direction before making big trades.
🛑 Scenario 3: Gap-Down Opening (100+ Points)
A gap-down below 22,351 could push Nifty towards the last intraday support of 22,296. If the selling extends, watch the golden retracement zone at 22,114, which is a high-probability demand zone.
✅ Plan of Action:
If Nifty stabilizes at 22,296, expect a recovery towards 22,351 – 22,378. Scalping opportunities exist.
If selling pressure continues below 22,296, expect a further slide to 22,114, which will be a must-watch area for buyers.
Only consider fresh longs at 22,114 if strong reversal signs appear. Else, avoid catching falling knives.
📌 Key Levels to Watch: 22,296 (Support) | 22,208 (Breakdown Confirmation) | 22,114 (Golden Buy Zone).
📢 Tip: Avoid aggressive longs in a gap-down scenario unless a clear reversal is seen at major supports. Watch for confirmation before entering any trade.
⚡ Risk Management Tips for Options Traders
🔹 Premium Decay Alert: If Nifty consolidates, avoid buying OTM options. Time decay will erode premiums.
🔹 Hedge Positions: If selling options, hedge using spreads to reduce risk.
🔹 Exit at SL: Do not hold options hoping for reversals. Stick to the predefined SL.
🔹 Avoid Trading the First 5-Minutes: Market volatility is high; let a pattern form.
🔹 Size Appropriately: If uncertain, reduce lot size and wait for confirmation.
📌 Summary & Conclusion
✅ If Nifty Opens Gap-Up: Watch for 22,551 – 22,617 resistance zones. A breakout can trigger further upside.
✅ If Nifty Opens Flat: First 30 minutes are crucial. Support at 22,351 – 22,378 should hold for longs.
✅ If Nifty Opens Gap-Down: Watch 22,296 for a reaction. If broken, 22,114 is a key buy zone.
📢 Final Note: The best trades come when price action confirms levels. Avoid emotional trading and respect stop losses.
📜 Disclaimer
I am not a SEBI-registered analyst . All views are for educational purposes only. Traders should conduct their own analysis or consult a financial advisor before making any investment decisions.

Nifty March 3rd Week analysis Nifty is looking uncertain , and we can expect downside to continue if it breaks recent support level of 22228 and if it crosses 22495 on the upside then there are chances for upside momentum to continue . All levels are marked in the chart posted.

NIFTY50.....One leg is missing!Hello Traders,
the NIFTY50 has been moving sideways for the past week. It shows a tight trading range from 22314-22676 with a spike to the upside! That show's to my view, that the move up is not over yet.
Probably on lower low (above the 21694) is to be expected, but also a second leg to the upside as well is to expect.
So, what's the conclusion for the coming week?
Thought the low above 21694 is coming, a rebound to the upside from 23038 to 23320 is possible. The first target price would be exactly to the underside of the 0.618 Fibo from the second leg to the downside (starting from 24857.75. The range of 23785 is also a target as well!
If the NIFTY50 is willing to decline directly to new lows (<21694) the door is open to the targets as per my last week's analyze (@ 21137 to 21821)!
Well, a lot "if and when", but I guess we (you) are well-prepared for the possible things and market action to come.
Have a great weekend.....
Ruebennase
Please ask or comment as appropriate.
Trade on this analysis at your own risk.

17 March Nifty50 important levels trading zone
#Nifty50
99% working trading plan
📌Gap up open 22568 above & 15m hold after positive trade target 22710, 22890
📌Gap up open 22568 below 15 m not break upside after nigetive trade target 22388,2226
📌Gap down open 22388 above 15m hold after positive trade target 22568, 22710+
📌Gap down open 22388 below 15 m not break upside after nigetive trade target 22268, 22148
💫big gapdown open 22710 above hold 1st positive trade view 22710 below nigetive view
💫big Gapup opening 22268 below nigetive trade view 22268 above positive trade view
📌For education purpose I'm not responsible your trade
More education following me

Nifty near important support holding it is key for progress. Nifty this week tried to consolidate and in the process lot a lost of ground covered last week. Holding the support level of 22314 is the key to move forward. If this major support is broken Nifty may again fall to the strong Bear zone of 21975, 21782 or even 21285 levels. If 22314 support is held the future resistances can be 22531, 22668 and 22842. If these resistances are crossed we will reach Mother and Father line resistances at 23018 and 23419. A monthly closing above Father line resistance that is 23419 can bring Bulls back into action. Shadow of the candle is neutral with slightly positive tinge.
Disclaimer: The above information is provided for educational purpose, analysis and paper trading only. Please don't treat this as a buy or sell recommendation for the stock or index. The Techno-Funda analysis is based on data that is more than 3 months old. Supports and Resistances are determined by historic past peaks and Valley in the chart. Many other indicators and patterns like EMA, RSI, MACD, Volumes, Fibonacci, parallel channel etc. use historic data which is 3 months or older cyclical points. There is no guarantee they will work in future as markets are highly volatile and swings in prices are also due to macro and micro factors based on actions taken by the company as well as region and global events. Equity investment is subject to risks. I or my clients or family members might have positions in the stocks that we mention in our educational posts. We will not be responsible for any Profit or loss that may occur due to any financial decision taken based on any data provided in this message. Do consult your investment advisor before taking any financial decisions. Stop losses should be an important part of any investment in equity.

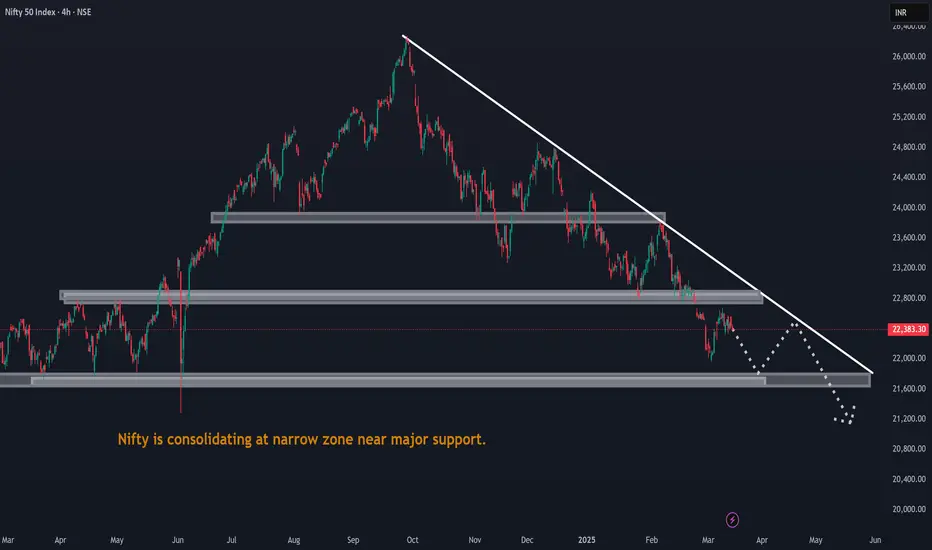
Nifty is consolidating at narrow zone near major support.Nifty is consolidating at narrow zone near major support.