NIFTY50 Intraday Analysis for 14 March 2025On 15m TF, NSE:NIFTY has given a ChoCh and taken out last swing low, confirming the temporary swing high of 22676. Price is still trading in the premium zone, with an accumulation forming in the last 2 sessions (Wednesday and Thursday)
Price is likely to take out the Sell Side Liquidity of this accumulation and likely to do a reversal from 22100-22180 levels, with an upside target of 22700.
Reasons:
If Market has to do a complete reversal from this level, it has to generate enough liquidity to take market up for next couple of days, hence this accumulation to generate liquidity and once Sell side liquidity is taken out, we can expect a reversal from the below demand zone (FVG).
If price breaks below the demand zone
1. Price may sweep the low at 21970 and reverse.
2. Price closing below the 21970 means, trend continuation for further fall.
Conclusion:
Opening is crucial, if the price dips to 22100-22180 range, observe price action in 1m or lower timeframes to enter long, with a tight SL below last swing low 21970.
If the price opens higher, it is likely to take out Buy Side Liquidity first and then fall to collect Sell side liquidity and then make the upside move.
NB: Not a financial advise, just sharing my observation for educational purposes.
NIFTY trade ideas

Nifty trend directionNifty 22468 is moving in uptrend with gaining support at 22360- 22320 zone.
Expected to test 22920

#NIFTY50 ReversalA NIFTY 50 Reversal occurs when the price direction of the NIFTY 50 index (India's benchmark stock index) changes trend, either from a downtrend to an uptrend (bullish reversal) or from an uptrend to a downtrend (bearish reversal).

#NIFTY Intraday Support and Resistance Levels - 13/03/2025Flat opening expected in index. After opening if nifty starts trading above 22500 level then expected upside rally upto 22650+ in today's session. 22650 level will act as an immediate upside resistance. Expected reversal from this level. Major downside expected if nifty not sustain above 22500 and starts trading below 22450 level.

Nifty Might Be More Bearish TodayNIFTY Trading Strategy Based on Data Analysis
Key Observations: 🔍
Spot Price: 22,470.50
Max Pain:
22,450 → This suggests options sellers will benefit if Nifty expires near this level.
OI (Open Interest) Analysis:📊
Total Calls OI: 1,758.40 L
Total Puts OI: 1,527.76 L
Call OI Change:
+192.31 L (Increase in call writing, indicating resistance)
Put OI Change:
-157.51 L (Decrease in put positions, indicating weaker support)
PCR (Put Call Ratio):
0.8688A PCR below 1 indicates bearish sentiment as more calls are being written than puts.
Nifty Chart:📈📉
Resistance Levels: 22,500 - 22,600 (heavy call writing)
Support Levels: 22,300 - 22,400 (some put writing but weaker)
Trading Strategy 🧠
1. Bearish Bias (Short Nifty)📉
Entry: Sell Nifty near 22,480 - 22,500
Target: 22,350 (near support level)
Stop Loss (SL): 22,550 (above strong resistance)
Reasoning:🔍
Max Pain at 22,450: Expect Nifty to hover near this level.
High Call OI at 22,500 & 22,600: Indicates strong resistance.
PCR < 1: More calls written than puts → Bearish sentiment.
OI Change: Call writing is increasing, confirming resistance at 22,500.
2. Alternative Bullish Strategy (Only If Nifty Holds 22,400)📈
Entry: Buy Nifty near 22,400 (support zone)
Target: 22,520 (near resistance)
SL: 22,350 (below support)
Reasoning:🔍
If Nifty holds 22,400 and PCR rises above 1, bullish strength can return.
However, current data suggests bearish pressure is stronger.
Final Recommendation:
Primary View: Bearish → Sell on Rise (Short at 22,480-22,500)
Alternative View: Buy Only if Nifty Holds 22,400 with Strength
Nifty Analysis 13.3.2025As of March 12, 2025, the Nifty 50 index closed at 22,470.50, reflecting a slight decrease of 0.12% from the previous day. citeturn0search1
Recent technical analyses suggest a bearish outlook for the Nifty 50:
- **Head and Shoulders Formation**: A head and shoulders pattern has been identified, with a breakdown through the support at 22,779, signaling a potential further decline towards 20,405. citeturn0search2
- **Elliott Wave Analysis**: The index reached a peak around 26,300 in September 2024. Subsequent movements suggest a corrective phase, with potential targets between 22,500 and 22,550. citeturn0search3
Fundamentally, the Indian stock market has experienced significant challenges:
- **Prolonged Downturn**: The Nifty 50 is on track for its fifth consecutive monthly decline, marking its longest losing streak since 1996. This downturn has led to a 15% drop from its September peak, erasing nearly $1 trillion in investor wealth. Factors contributing to this decline include weak earnings, persistent foreign outflows, and uncertainties regarding U.S. tariffs. citeturn0news22
- **Investor Behavior**: Foreign investors have sold approximately $25 billion in Indian equities since September. While local institutional investors continue to buy, inflows are slowing, indicating cautious sentiment among domestic investors. citeturn0news22
In summary, both technical indicators and fundamental factors point towards a cautious outlook for the Nifty 50 in the near term. Investors are advised to monitor these developments closely and consider appropriate risk management strategies.

Still in DOWNTREND !As we can see despite strong opening NIFTY fell resisting from the trendline resistance and we shall stand by our analysis of selling the rise till NIFTY breaches 21670 levels and closes above for change of structure of market so plan your trades accordingly and keep watching .

NIFTY : Intraday Trading levels and Plan for 13-Mar-2025📘 NIFTY Trading Plan for 13-Mar-2025
Chart Reference: Nifty is currently trading near 22,468, with price showing rejection from near-term resistance. Multiple levels such as 22,435, 22,496, and 22,600 are key zones to watch.
Let’s break down the trading approach into opening scenarios 👇
✅ 1. GAP-UP OPENING (100+ points above previous close)
If NIFTY opens near or above the Opening Resistance Zone – 22,600 to 22,626 :
📍 This zone has acted as a supply area earlier, and a gap-up into this area could trap late buyers if not sustained.
🟧 Scenario 1 – Rejection at Resistance:
🔻 If NIFTY opens within this resistance zone and shows early weakness (such as a bearish engulfing, evening star, or rejection wick), short trades can be considered.
🎯 Targets:
➤ 22,496 (Initial Support)
➤ 22,435 (Next Support)
🟩 Scenario 2 – Breakout Above 22,626:
✅ A strong 15-min bullish candle above 22,626 with volume confirmation can trigger a long entry.
🎯 Targets:
➤ 22,680
➤ 22,800 (Last Intraday Resistance)
🧠 Tip: In gap-up opens, avoid immediate entries. Wait 15–30 mins for the market to establish direction. If upside sustains with strength, trail using VWAP or 5-min EMA.
⚖️ 2. FLAT OPENING (within ±100 points)
If NIFTY opens between 22,435 – 22,496:
This region is the Opening Support/Resistance Zone , meaning both bulls and bears will be active here. The key is to observe who dominates.
🟩 Long Setup:
If NIFTY holds above 22,496 and gives a breakout above 22,600, it will confirm bullish strength.
🎯 Upside Targets:
➤ 22,680
➤ 22,800
🟥 Short Setup:
If price fails to hold above 22,435 and breaks below it with momentum:
🎯 Downside Targets:
➤ 22,319 (Opening Support)
➤ 22,208 (Last Intraday Support)
🧠 Tip: Use option strategies like straddles or strangles near this flat zone if expecting a breakout or expansion in volatility. Avoid naked directional trades unless there is strong confirmation.
🔻 3. GAP-DOWN OPENING (100+ points below previous close)
If NIFTY opens near or below 22,319 (Opening Support):
📍 The area between 22,319 – 22,208 is critical for support. Watch closely for price action.
🟩 Reversal Setup:
If NIFTY opens near 22,208–22,319 and holds this support with signs of strength (bullish pin bar, morning star, or strong bullish volume), a reversal trade can be taken.
🎯 Targets:
➤ 22,435
➤ 22,496
🟥 Breakdown Setup:
If support at 22,208 breaks with a large red candle and follow-through, short trades can be initiated.
🎯 Targets:
➤ 22,140–22,100 Zone (Intraday Expansion Move)
🧠 Tip: Gap-downs can lead to high implied volatility. Be cautious of IV crush if reversal happens. Consider bear put spreads to manage premium risk.
💡 Risk Management Tips for Options Traders
Avoid buying deep OTM options post 12 PM unless there is strong trend confirmation. Always trade with a defined stop-loss. Use 15-min closing basis for better validation. Consider spreads (bull call, bear put) to reduce the impact of theta decay. On volatile days, reduce position size and hedge your trades. Don’t trade immediately after a gap — let the first 15–30 mins settle to avoid traps.
📌 Summary & Conclusion
✅ Key Resistance Zones:
➤ 22,600–22,626 (Opening Resistance)
➤ 22,800 (Last Intraday Resistance)
✅ Key Support Zones:
➤ 22,435 (Pivot Zone)
➤ 22,319 (Opening Support)
➤ 22,208 (Last Support Zone)
🎯 Let price action guide your trade around these key levels. Remember — reacting to the market is better than predicting it.
⚠️ Disclaimer
I am not a SEBI registered analyst. This trading plan is shared purely for educational purposes. Please do your own research or consult your financial advisor before making any investment or trading decisions.

13 March Nifty50 important level trading zone #Nifty50
99% working trading plan
Gap up open 22568 above & 15m hold after positive trade target 22732, 22868
Gap up open 22568 below 15 m not break upside after nigetive trade target 22378,22242
Gap down open 22378 above 15m hold after positive trade target 22568, 22732+
Gap down open 22378 below 15 m not break upside after nigetive trade target 22242, 22138
💫big gapdown open 22242 above hold 1st positive trade view
💫big Gapup opening 22732 below nigetive trade view
📌For education purpose I'm not responsible your trade
More education following me

NIFTY | LONG | SWINGNIFTY is showing positive intent in terms of a Mean Reversion.
Notice the low of 11 March held. This signals Bulls in control.
Long position can be built up for a Target to 22,900 level.
SL - today's low.

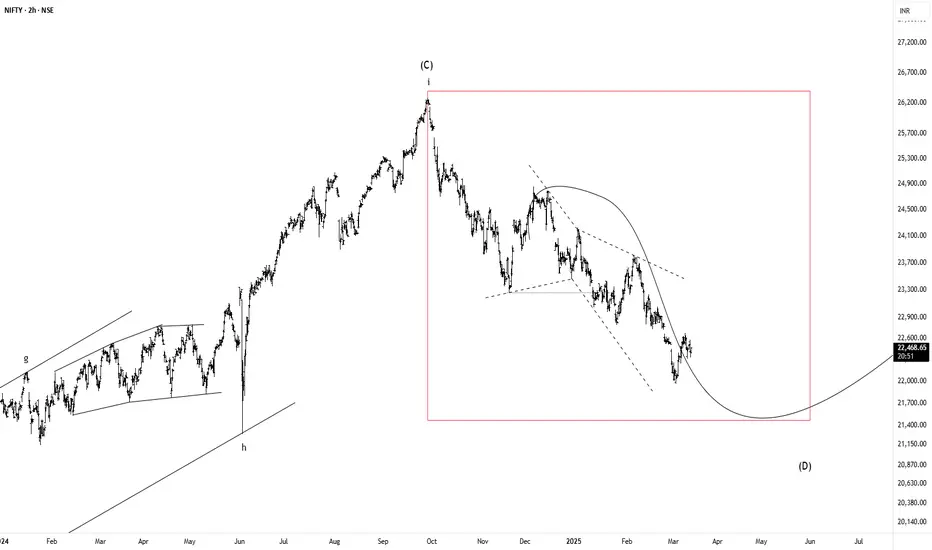
Nifty 50 Forecast by NEoWaveOn the 2H timeframe, the recent price correction appears to be a diametric one. When a Diametric Zigzag forms, it usually forms a combination pattern, so we consider 2 scenarios:
Scenario 1
Diametric wave-(g) ends in the range of 21050 – 21473 or even higher and the upward movement begins
Scenario 2
a- Wave-(g) continues to the range of 21050 – 21473 and then, in order to complete the time correction, a combination pattern of Diametric – X – Triangle is formed on the support range.
b- Wave-(g) continues to the range of 21050 – 21473 and then a small X wave is formed, but the price crosses the support range of 21050 – 21473, in this case, the combination pattern will still form, but the price can decrease to 19993 or the price range of 18993-18744 according to the second pattern.
The second scenario is more likely to form.
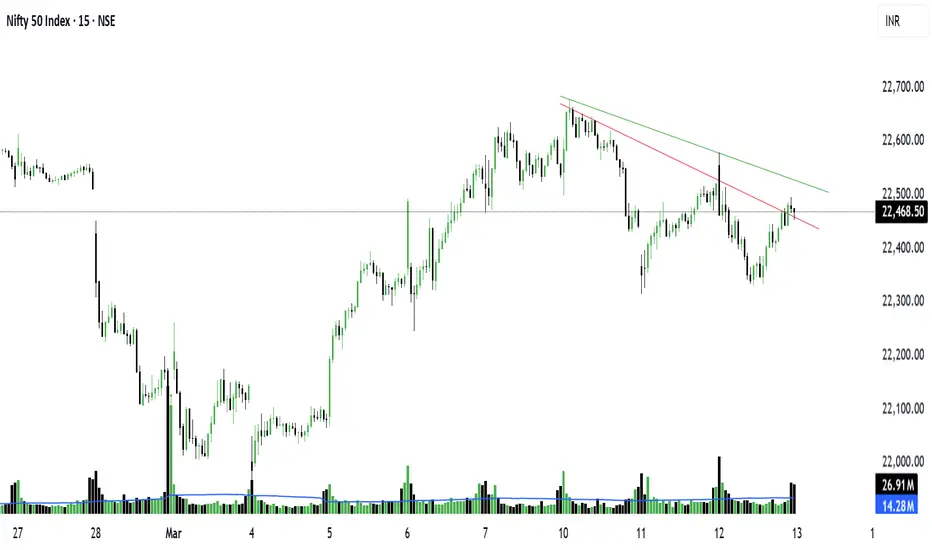
NIFTY FORMING A BEAR FLAG ON 1 HOUR TIME FRAMENifty has retraced form the recent lows of 21964 and has formed a high of 22676 we did see an up move today but in order for this move to sustain Nifty needs to trade above 22550 for 1 hour if it breaks the 22480-22450 zone we may see Nifty falling to the new levels mentioned in the chart as of now the chart appears to bearish in nature

NIFTY:STRUCK BETWEEN 10DEMA AND 10DEMA&50DEMA IN WKLY CHARTNIFTY: Nifty trading between 22300-500 and remains volatile and lack direction,going by the trend long shall be considered if it holds above 22625-650 on closing basis for 22800-23000 tgt on the contrary NIFTY breaching 22000 on closing basis will trigger a selling spree and expect a sharp fall by 300-400 points.As of now for me Long above 22650 and short below 22000(For educational purpose only)


#NIFTY Intraday Support and Resistance Levels - 12/03/2025Flat opening expected in nifty. After opening if nifty sustain above 22500 level then possible upside rally upto 22750+ level in today's session. Any major downside only expected if nifty not sustain above level and starts trading below 22450. This downside rally can goes upto 22300 level after the breakdown.

Selling the RISE as per our PLAN!! As we can see NIFTY has recovered considerably despite the weak opening and weak global cues which could be due the factored fall which has already taken place in NIFTY. Hence any weakness is not impacting NIFTY any further. Now we will stick to our plan and sell the rise as it can still be seen trading around resistance which previously acted as a SUPPORT hence as long as we are below the structure and doesn’t closes above 600 levels every rise can be sold so plan your trades accordingly and keep watching.

Nifty Intraday Support & Resistance Levels for 12.03.2025Tuesday’s session saw Nifty opening gap-down due to negative global cues, hitting a low of 22,314.70 before gradually recovering to a high of 22,522.10 by the end of the day. It closed at 22,497.90, gaining 37 points over the previous close. The Weekly Trend (50 SMA) remains negative, while the Daily Trend (50 SMA) has turned negative from oversold levels.
Demand/Support Zones
Near Demand/Support Zone (Daily): 21,964.60 - 22,261.55
Far Support: 21,281.45 (Low of 4th June 2024)
Far Demand/Support Zone (Daily): 20,769.50 - 20,950
Supply/Resistance Zones
Near Minor Supply/Resistance Zone (75m): 22,595.90 - 22,676.75
Far Supply/Resistance Zone (Weekly): 23,222 - 23,807.30
Outlook
After making a recent high of 22,676.75 on Monday, Nifty faced selling pressure but managed to recover from 22,314.70 on Tuesday, closing near 22,500, showing some bullish strength. However, the index has not retraced much from its fall between 23,807.30 to 21,964.60. If the Daily Demand Zone support holds, we could see a potential move towards 22,885 or even 23,100 in the coming days.

NIFTY : Intraday Trading Levels and Plan for 12-Mar-2025📅 NIFTY Trading Plan – 12-Mar-2025
(Timeframe: 15-min | Chart structure based on demand/supply and price action)
Opening Scenarios 📈📉
Gap-Up Opening (📍+100 Points or more)
If Nifty opens above the 22,598 resistance zone, price may initially test this level as support.
🔹 A successful hold here can trigger a bullish rally toward the last intraday resistance at 22,800, with intraday targets around 22,700+.
🔸 However, if Nifty fails to sustain above 22,598 and slips back inside the orange resistance zone, a corrective dip back to 22,496–22,482 may occur.
📌 Plan of Action:
✅ Buy on retest & strength above 22,598
❌ Avoid fresh longs if candles close back below 22,598
Flat Opening (±100 Points)
If Nifty opens near 22,520–22,482, this range becomes a decision-making zone.
🔹 Holding above 22,520 can provide a quick upside move toward 22,598+.
🔸 On the other hand, weakness below 22,482, especially on hourly close, can open downside toward the Opening Support Zone: 22,358–22,415.
📌 Plan of Action:
✅ Wait for the first 15–30 min range breakout
💡 Above 22,520 = bullish bias
⚠️ Below 22,482 = cautious; only scalp short with confirmation
Gap-Down Opening (📉 -100 Points or more)
A gap-down near or below 22,358–22,415 places price directly into the Opening Support Zone.
🔹 Watch for price rejection wicks or bullish reversal candles near this zone.
🔸 If broken decisively, Nifty may test 22,259 (last intraday support) and then the Best Buy Zone: 22,115–22,155, which aligns with the golden retracement zone.
📌 Plan of Action:
✅ Wait and observe price action at 22,358–22,259
📉 Short only if there's breakdown with volume
📈 Strong bounce near 22,115–22,155 = high RR long trade setup
📘 Risk Management Tips for Options Traders 💡
📏 Avoid buying OTM calls or puts after big gap openings . Wait 15–30 mins for premium decay to stabilize.
🛑 Always place SL based on chart levels or candle close—not fixed points .
🧠 Avoid averaging losing options positions —theta decay can kill.
💸 Position sizing is key: Never risk more than 1–2% of capital per trade.
🎯 Trade with a plan, not emotions. Let levels guide your decisions.
📊 Summary & Key Levels
🔹 Upside Resistance: 22,598 – 22,800
🔸 Key Pivot Levels: 22,520 / 22,482
🟢 Support Zones: 22,358 – 22,259 – 22,115
⚠️ Best Risk-Reward Zone: 22,115 – 22,155 (Watch for reversal signs)
📌 Conclusion
Nifty is trading in a reactive zone. Smart trading lies in reacting to key levels, not predicting. Avoid emotional trades near resistance or support—let price confirmation guide you. Patience will reward the prepared trader.
📛 Disclaimer: I am not a SEBI registered analyst. All views shared are for educational purposes only. Please consult your financial advisor before taking any trades.

12 March Nifty50 important level trading zone #Nifty50
99% working trading plan
Gap up open 22542 above & 15m hold after positive trade target 22623, 22722+
Gap up open 22542 below 15 m not break upside after nigetive trade target 22458,22358, 22233
Gap down open 22458 above 15m hold after positive trade target 22542, 22623+
Gap down open 22458 below 15 m not break upside after nigetive trade target 22358, 22233
📌For education purpose I'm not responsible your trade
More education following me

Smart recovery by Nifty after opening Gap-Down. Nifty opened Gap down after a sell-off in global markets in general and US markets in particular. Nasdaq tanked 3.81%, Dow cracked 2.08% and S&P 500 cracked 2.70% last night. Nifty however has closed 37 points in positive showing some strength. The recovery from day's low was 183.2 which sounds like a very powerful comeback.
However we are not out of the woods till we close above few important resistances which are in front of Nifty. Immediate resistances are at 22531, 22668 and 22842. Once we close above 22842 there are Mother and Father Line resistances at 23067 and 23439. Closing above 23439 is the key for Bulls to make a comeback. Those who are not aware about my Mother, Father and Small Child theory of stock market can read my book the Happy Candles Way to Wealth creation. The book is one of the highest rated books on Amazon in the category. The book teaches Behavioural finance, Fundamental analysis and Technical analysis. Many consider this book as hand book of investment. Anyone who reads it will benefit and take something home some valuable learning whether he is a newbie or a seasoned investor.
Supports for Nifty will be near 22314, 21975, 21782 and 21281. If Nifty can carry forward today's momentum into tomorrow there is a chance of further recovery. Shadow of the candle despite today's smart recovery is absolutely neutral. Market will be closed on Friday for Dhuleti so next 2 days are very crucial for Bulls. Mother and Father lines are far away but bulls will be very happy to get a closing above 22668 if not 22842 this week. Bears will try to drag the market below today's low of 22314. So it can be a tussle of the highest order in store for the next 2 days.
Disclaimer: The above information is provided for educational purpose, analysis and paper trading only. Please don't treat this as a buy or sell recommendation for the stock or index. The Techno-Funda analysis is based on data that is more than 3 months old. Supports and Resistances are determined by historic past peaks and Valley in the chart. Many other indicators and patterns like EMA, RSI, MACD, Volumes, Fibonacci, parallel channel etc. use historic data which is 3 months or older cyclical points. There is no guarantee they will work in future as markets are highly volatile and swings in prices are also due to macro and micro factors based on actions taken by the company as well as region and global events. Equity investment is subject to risks. I or my clients or family members might have positions in the stocks that we mention in our educational posts. We will not be responsible for any Profit or loss that may occur due to any financial decision taken based on any data provided in this message. Do consult your investment advisor before taking any financial decisions. Stop losses should be an important part of any investment in equity.

Nifty 27000 ?The Nifty index seems to have completed a Wave IV correction and Wave V is next. It could have already started or may start in coming weeks. The equality levels indicate it going above 27000 in this move.
Note- This is a medium-term view.

NIFTY S/R for 11/2/25Support and Resistance Levels:
Support Levels: These are price points (green line/shade) where a downward trend may be halted due to a concentration of buying interest. Imagine them as a safety net where buyers step in, preventing further decline.
Resistance Levels: Conversely, resistance levels (red line/shade) are where upward trends might stall due to increased selling interest. They act like a ceiling where sellers come in to push prices down.
Breakouts:
Bullish Breakout: When the price moves above resistance, it often indicates strong buying interest and the potential for a continued uptrend. Traders may view this as a signal to buy or hold.
Bearish Breakout: When the price falls below support, it can signal strong selling interest and the potential for a continued downtrend. Traders might see this as a cue to sell or avoid buying.
MA Ribbon (EMA 20, EMA 50, EMA 100, EMA 200) :
Above EMA: If the stock price is above the EMA, it suggests a potential uptrend or bullish momentum.
Below EMA: If the stock price is below the EMA, it indicates a potential downtrend or bearish momentum.
Trendline: A trendline is a straight line drawn on a chart to represent the general direction of a data point set.
Uptrend Line: Drawn by connecting the lows in an upward trend. Indicates that the price is moving higher over time. Acts as a support level, where prices tend to bounce upward.
Downtrend Line: Drawn by connecting the highs in a downward trend. Indicates that the price is moving lower over time. It acts as a resistance level, where prices tend to drop.
Disclaimer:
I am not a SEBI registered. The information provided here is for learning purposes only and should not be interpreted as financial advice. Consider the broader market context and consult with a qualified financial advisor before making investment decisions.

#NIFTY Intraday Support and Resistance Levels - 11/03/2025Slightly gap down opening expected in nifty. After opening if nifty starts trading below 22450 level then possible downside rally upto 22300 in opening session. This downside rally can extend further in case nifty gives breakdown of 22250 level. Any bullish side rally only expected if nifty starts trading and sustain above 22500 level.
