NIFTY Short Term View <25650-25200>If you follow my other ideas, I think you are gaining trust on the tool ZZ. Please don't blindly follow me and my posts. I just want to make you curios that one tool with clear idea is enough to predict the market. But condition is you have to practice a ton.
Here I am sharing just glimpse of it, there are so many things to do with ZZ.
Keep learning || Trust analysis || Keep Trading & Investing
Any question or suggestion please feel free to comment below.
NIFTY trade ideas

NIFTY THIS WEEK? What's the plan
"There’s more hidden in a candle chart than most headlines will ever reveal.”
If you look at this NIFTY chart casually, you’ll see just another uptrend. But if you feel the price — really look into the structure — you’ll notice something deeper:
We’re not just in a rally. We’re in a breakout after base-building. And that’s a very different game.
What I Noticed This Week:
1. Strong Follow-Through
NIFTY didn’t just pop — it’s sustaining gains. Each green candle is following the next without hesitation. That means institutions are buying, not just retailers reacting.
2. Previous Resistance = Gone
Look back at 25,200–25,300. That zone rejected price multiple times. Now? It’s broken clean, with a bullish Marubozu-style candle. That’s a confirmation, not just a fluke.
3. No Panic Selling Yet
Usually, breakouts invite profit booking. This one? Sellers are quiet. When there's no rejection at new highs, it tells you confidence is strong.
But Here’s What You Must Watch:
Are we near psychological exhaustion? Markets can get euphoric and overextend - even in strong trends. Volume Spike or Divergence? If volumes dry or RSI starts diverging, stay alert.
Global cues & Bank Nifty:
If Bank Nifty stalls, NIFTY will slow too. Watch correlation.
What This Means for You:
Trend is strong, but smart traders plan exits in upmoves - not panic in downmoves.
Ask yourself:
Do you have entries based on structure?
Are you overexposed at highs, hoping for more?
Are you following momentum blindly or with plan?
Personal Reflection:
I’ve learned this the hard way:
“Buying strength is good. But riding strength without a stop loss is just greed in disguise.”
So this week:
Observe, don’t chase.
Track - don’t blindly enter.
There’s always another breakout. But there’s only one portfolio.

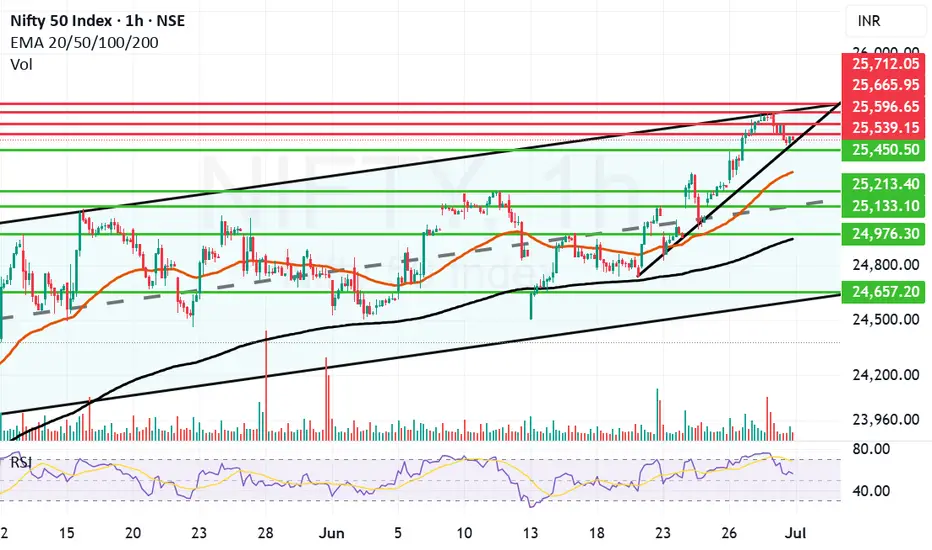
Nifty goes into consolidation mode to end the month at 25500.Today Nifty went into consolidation mode searching for the supports nearby after a massive upward run in the last week. Even though we saw Nift climbing down 120 points today the closing above 25500 is a good sign. It was a volatile day where Nifty made a high of 25669 and a low of 25473 moving 200 points down. But recovered a bit to close at 25517.
The Supports for Nifty remain at: 25450, 25321 (Mother line Support), 25133 (Mid-channel support). If that is broken the Nifty may fall further towards 24976 or 24956 (Which is the Father line support). Channel bottom seems to be at 24657. If we get a closing below this zone we will comment about further supports on the down side.
The Resistance for Nifty remain at: 24539, 24596, 25665 and finally 25712. (25712 seems to be the channel and trend top. Once Nifty closes above this zone we will be able to comment about further levels on the upside.
Disclaimer: The above information is provided for educational purpose, analysis and paper trading only. Please don't treat this as a buy or sell recommendation for the stock or index. The Techno-Funda analysis is based on data that is more than 3 months old. Supports and Resistances are determined by historic past peaks and Valley in the chart. Many other indicators and patterns like EMA, RSI, MACD, Volumes, Fibonacci, parallel channel etc. use historic data which is 3 months or older cyclical points. There is no guarantee they will work in future as markets are highly volatile and swings in prices are also due to macro and micro factors based on actions taken by the company as well as region and global events. Equity investment is subject to risks. I or my clients or family members might have positions in the stocks that we mention in our educational posts. We will not be responsible for any Profit or loss that may occur due to any financial decision taken based on any data provided in this message. Do consult your investment advisor before taking any financial decisions. Stop losses should be an important part of any investment in equity.
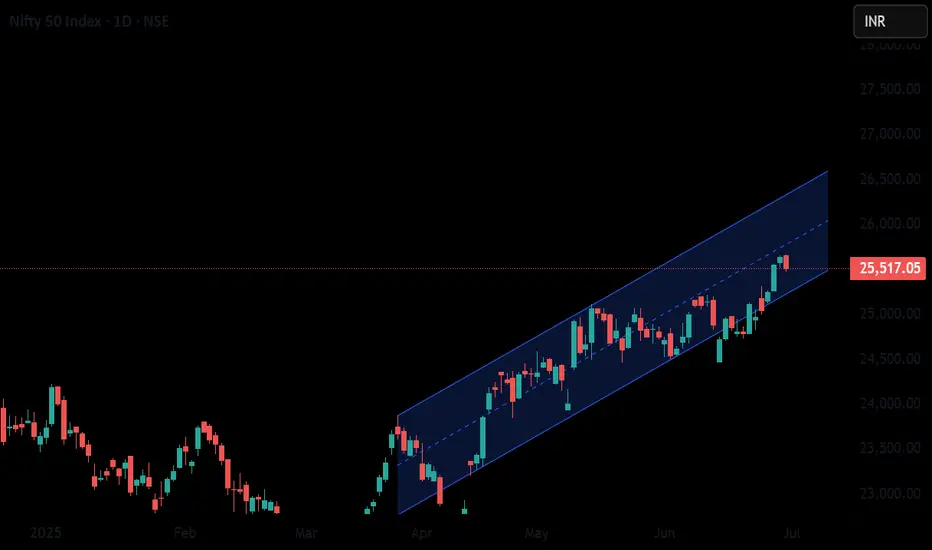
Nifty 50 moving in upward channel, with strong foundation Apparently NIfty 50 is moving in a upward channel to its all time high probably.
Nifty is Bearish for next week. But Why ? "Ask me in comments".Nifty is facing resistance at this level for a specific reason. this week it can be bearish and continue to go down side.

NIFTY 50 INDEX CHART ANALYSIS FOR INTRADAYNIFTY 50 INDEX CHART ANALYSIS FOR INTRADAY.
here we are seeing of nifty 50 index chart, and one is resistance and one box is support that is yellow color and if price will come to support and then we will try to find of buy opportunity. if support zone breaks then we will plan for sell of nifty and if break of resistance, then we will see big rally.

Rising Nifty momentum has broken major ResistanceRising Nifty momentum has broken major Resistance. Global cues are positive for Indian stock markets.

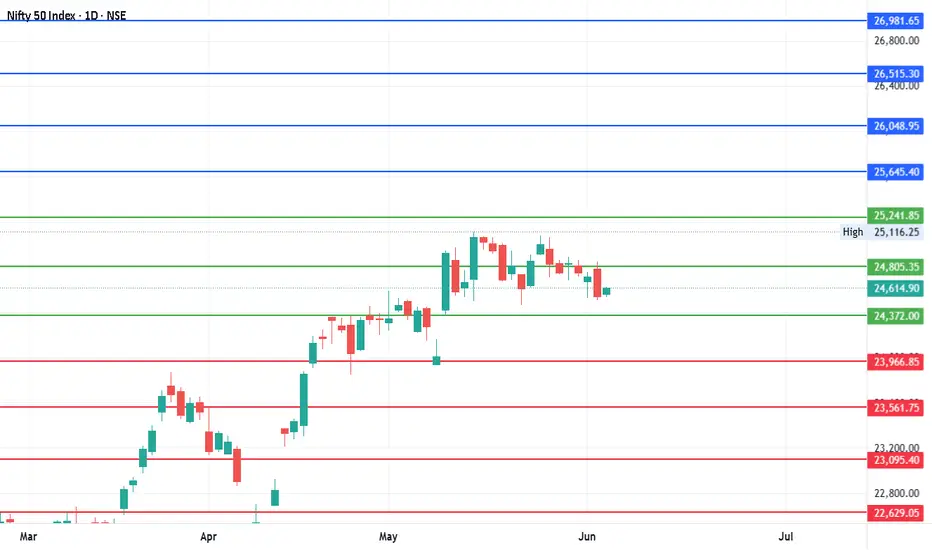
#Nifty - Quarterly Pivot is 24805.35 | 22629.05 or 26981.65?Date: 04-06-2025
Pivot Point: 24805.35 Support: 24371.98 Resistance: 25241.83
Upside Targets:
Target 1: 25645.39
Target 2: 26048.95
Target 3: 26515.30
Target 4: 26981.65
Downside Targets:
Target 1: 23966.86
Target 2: 23561.75
Target 3: 23095.4
Target 4: 22629.05
#Nifty
#NiftyChartPatterns
#NiftyTrendAnalysis
Nifty - Reposting of previous Levels Again
This is just a "Reposting of #Nifty previous Levels Again" to help you to remember so that you can plan your activity accordingly. Every level plays a key level as target, support and resistance.
Previous Levels
Current Price: 24,461.15
Mid-point: 24413.83
Upside: 24913.61, 25115.13, 25378.11 and 25641.10
Downside: 23914.92, 23712.53, 23449.54 and 23186.55
Resistance: 24712.10
Stop loss: 24117.31
#Nifty

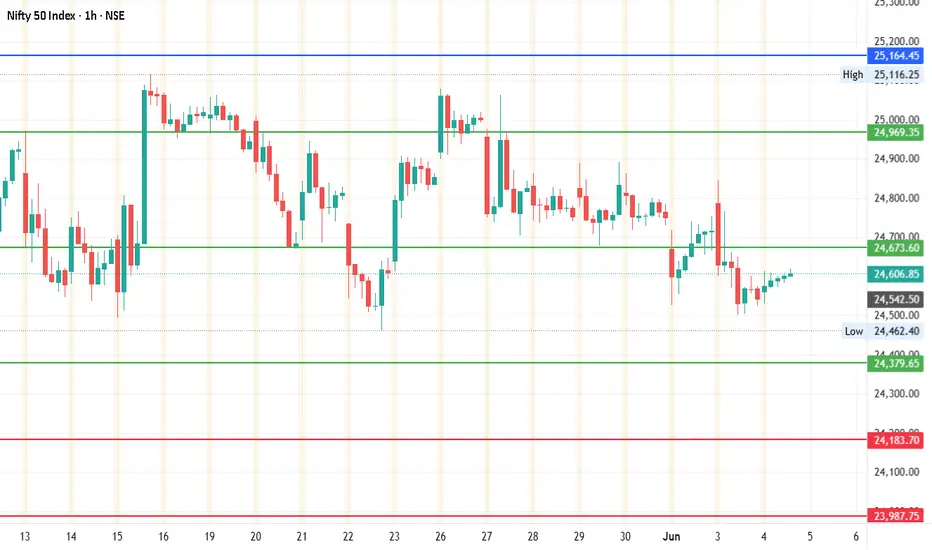
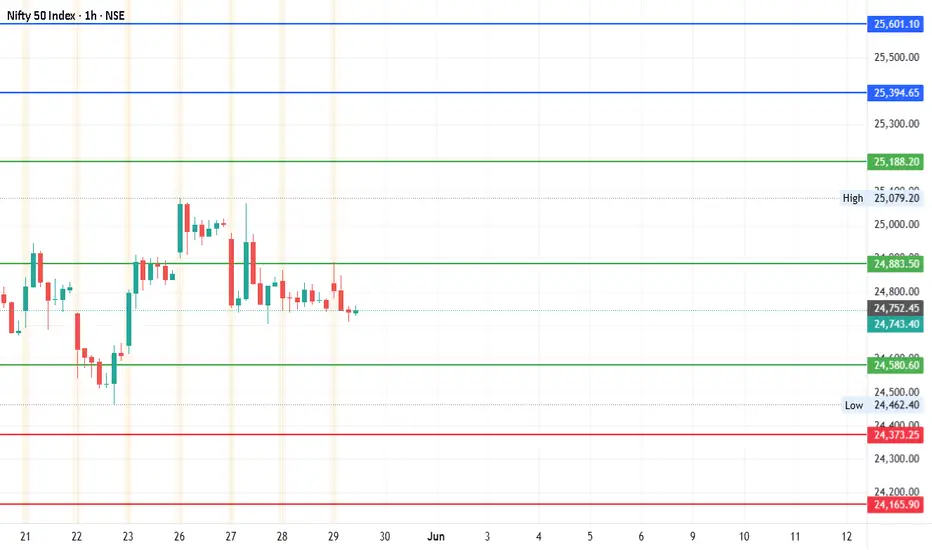
#Nifty - Short Term Pivot is 24673.63Date: 04-06-2025
Pivot Point: 24673.63 Support: 24379.64 Resistance: 24969.33
Upside Targets:
Target 1: 25164.43
Target 2: 25359.53
Target 3: 25616.74
Target 4: 25873.95
Downside Targets:
Target 1: 24183.68
Target 2: 23987.725
Target 3: 23730.5125
Target 4: 23473.30
#NiftyChartPatterns
#NIFTY - 640 pts done. What Next?May 29
Date: 29-05-2025
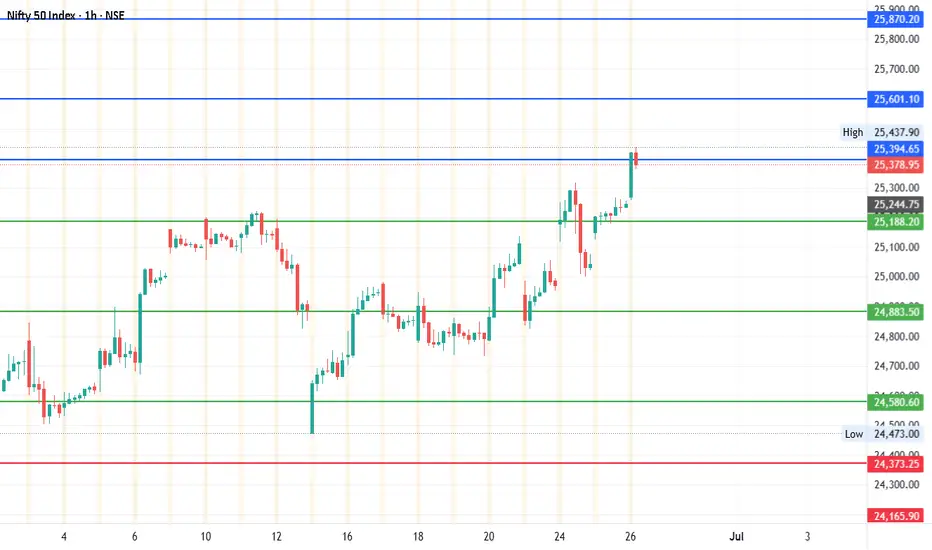
#NIFTY - Pivot Point is 24883.50
#NIFTY Current Price: 24755 (As on 29th May 2025 post is still valid). We also have other pivot points, and the target levels are pointing to the much higher. Both the pivots are valid.
Every pivot point will have a different target level.
Upside Target 1: 25394.66 is hit and continue to watch these levels.
Upside Targets: 25394.66, 25601.10, 25870.20 and 26139.30
Downside Targets: 24373.24, 24165.90, 23896.80 and 23627.70
Support: 24580.58
Resistance: 25188.21
NIFTY S/R for 27/5/25Support and Resistance Levels:
Support Levels: These are price points (green line/shade) where a downward trend may be halted due to a concentration of buying interest. Imagine them as a safety net where buyers step in, preventing further decline.
Resistance Levels: Conversely, resistance levels (red line/shade) are where upward trends might stall due to increased selling interest. They act like a ceiling where sellers come in to push prices down.
Breakouts:
Bullish Breakout: When the price moves above resistance, it often indicates strong buying interest and the potential for a continued uptrend. Traders may view this as a signal to buy or hold.
Bearish Breakout: When the price falls below support, it can signal strong selling interest and the potential for a continued downtrend. Traders might see this as a cue to sell or avoid buying.
MA Ribbon (EMA 20, EMA 50, EMA 100, EMA 200) :
Above EMA: If the stock price is above the EMA, it suggests a potential uptrend or bullish momentum.
Below EMA: If the stock price is below the EMA, it indicates a potential downtrend or bearish momentum.
Trendline: A trendline is a straight line drawn on a chart to represent the general direction of a data point set.
Uptrend Line: Drawn by connecting the lows in an upward trend. Indicates that the price is moving higher over time. Acts as a support level, where prices tend to bounce upward.
Downtrend Line: Drawn by connecting the highs in a downward trend. Indicates that the price is moving lower over time. It acts as a resistance level, where prices tend to drop.
Disclaimer:
I am not a SEBI registered. The information provided here is for learning purposes only and should not be interpreted as financial advice. Consider the broader market context and consult with a qualified financial advisor before making investment decisions.

#Nifty - Pivot Point is 25016.05Date:12-06-2025
#Nifty Current Price: 24950
Pivot Point: 25016.05 Support: 24711.72 Resistance: 25322.18
#Nifty Upside Targets:
Target 1: 25529.42
Target 2: 25736.65
Target 3: 26006.88
Target 4: 26277.10
#Nifty Downside Targets:
Target 1: 24503.59
Target 2: 24295.45
Target 3: 24025.225
Target 4: 23755.00


trading strategyVolume bars at the bottom show trading activity (green for buying, red for selling).
The current price is around 25,374, which is inside the sideways area, indicating the market is undecided at the moment.

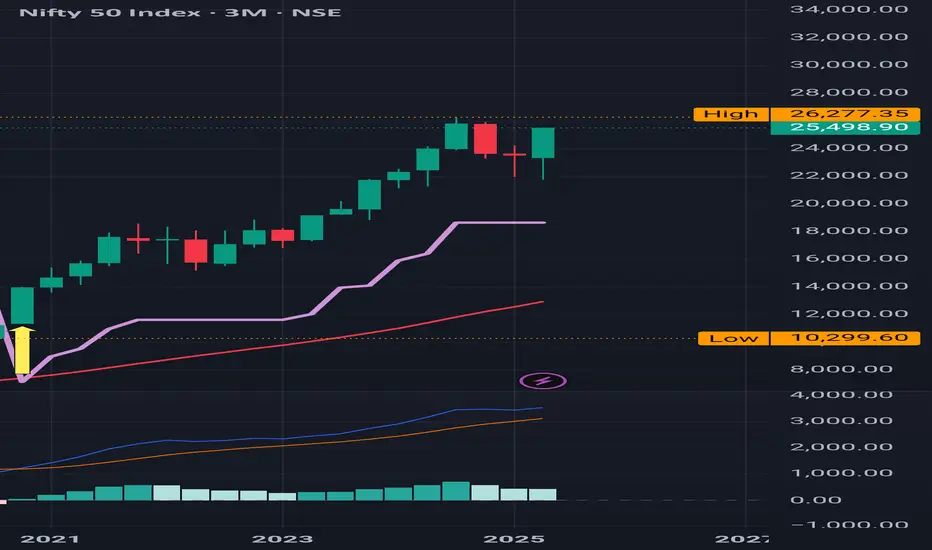
Nifty : Moving towards the ATH Nifty : Moving towards the ATH of 26277
MACD is looking extremely strong
No Red Band Resistance at this moment
This is 3 months Time frame Chart
( Not a Buy / Sell Recommendation
Do your own due diligence ,Market is subject to risks, This is my own view and for learning only .)
trading strategyUp Trend Area (Above ~25,440):
If the price breaks above the red resistance line (~25,440), it indicates a potential uptrend.
Traders may expect bullish movement and consider buying opportunities above this zone.
Sideways Area (Between ~25,292 and ~25,440):
This range indicates consolidation or indecision in the market.
Price is moving within a range without clear direction.
Traders may wait for a breakout either upwards or downwards.
Down Trend Area (Below ~25,292):
If the price falls below the green support level (~25,292), it may enter a downtrend.
This could signal bearish sentiment and potential selling opportunities.

NiftyNifty
looking at the chart, we can see 5waves getting completed....
if this structure holds true ...
24000 would be 1st tgt...
just a view!!
Vedang :)
Disclaimer: Chart is for study purpose only!!

#NIFTY - Weekly Pivot Point is 24883.50 | Next Target?Date: 29-05-2025
#NIFTY - Pivot Point is 24883.50
#NIFTY Current Price: 24755
Upside Targets: 25394.66, 25601.10, 25870.20 and 26139.30
Downside Targets: 24373.24, 24165.90, 23896.80 and 23627.70
Support: 24580.58
Resistance: 25188.21
25171 below sustain take put optionlast 3 week exp( 5 jun, 12 jun,19) all of price touched high and low compination*
check on{ one day time frame}
5 jun -{high 24897 low 24613}
12 jun - {high 25198 low 24826}
19 jun -{high 24862 low 24733}
coming 26 jun my point of target 24862
everything mention about my chart
just is my point of view idea ,,I am not sebi reg
thank you ,,,,happy day happy profit

NIFTY at Best Resistance !!This is the 1 hour Chart of NIFTY 50.
NIFTY 50 is trading near it's Resistance zone at 24400 range.
NIFTY 50 is forming a broadening pattern; resistance lies near 24,500.
Nifty 50 is forming parallel channel inside the pattern ; resistance lies near 24350.
If this level is sustain, then we may see Lower prices in Nifty 50.
Thank You !!

Nifty Analysis EOD – June 23, 2025 – Monday🟢 Nifty Analysis EOD – June 23, 2025 – Monday 🔴
👊 Tug of War Between Optimism and Pessimism
Nifty opened with a sharp 140-point gap-down, weighed by geopolitical tensions and negative news cues. The mood was clearly pessimistic — yet, from the deep low of 24,824.85, bulls made a bold comeback.
What followed was a classic textbook reversal:Price clawed back up, cutting through multiple key resistances — S1, VWAP, CDH, CPR BC, and Central CPR — before kissing the CPR TC, where it marked the day high at 25,057. This level acted as a supply zone and pushed Nifty back down toward the CPR BC, where it managed to close above the open — a quiet victory for the bulls, even in a red session overall.
The level 24,825 has now proven itself once again — the market’s respect for this support zone grows stronger with every bounce.
Today’s candle was a spinning top-style doji and also formed an inside bar, with all movement inside Friday’s wide-range candle (352 pts). Despite a smaller 232-point range today, this still requires caution — inside bars after large-range candles often result in false breakouts, especially amid macro noise.
📌 When the world looks bearish, and the chart looks bullish — trust your system.And that’s exactly what I did today — sticking to the Gladiator Strategy, a simple, disciplined intraday price action-based option buying framework.
🕯 5 Min Time Frame Chart with Intraday Levels
🕯 Daily Time Frame Chart with Intraday Levels
🕯 Daily Candle Breakdown
Open: 24,939.75
High: 25,057.00
Low: 24,824.85
Close: 24,971.90
Change: −140.50 (−0.56%)
📊 Candle Structure Breakdown
Real Body: 32.15 pts (small green body)
Upper Wick: 85.10 pts
Lower Wick: 114.90 pts
🔍 Interpretation
Despite a lower close than Friday, it was a green-bodied candle (close > open).
Long lower wick shows strong buying near 24,825.
Long upper wick signals resistance near 25,050–25,060.
🕯 Candle Type
📍 Spinning Top with Long Wicks — Sign of indecision, but slight bullish bias due to buying off the lows.
📌 Key Insight
Support at 24,825 holds strong.
Upper rejection near 25,050 indicates tight overhead pressure.
Watch closely:
Break above 25,060 → May trigger bullish continuation.
Break below 24,820 → Could open downside to 24,735–24,660 zone.
🛡 5 Min Intraday Chart
⚔️ Gladiator Strategy Update
ATR: 254.95
IB Range: 163.25 → Medium IB
Market Structure: ⚖️ Balanced
Trades Triggered:
🟢 10:14 AM – Long Trade → ✅ Target Achieved (Trailing Exit, R:R 1:4.51)
🔴 2:16 PM – Short Signal → ❌ Discarded (RR not favorable)
📌 Support & Resistance Zones
Resistance Levels
24,980 ~ 25,000
25,060 ~ 25,080
25,125 ~ 25,150
25,180 ~ 25,212
25,285
Support Levels
24,965
24,894 ~ 24,882
24,825
24,800 ~ 24,768
24,735 ~ 24,725
💭 Final Thoughts
Markets are currently walking a tightrope — with bearish headlines on one side and bullish price action on the other.The Gladiator approach today helped sidestep the noise and focus on what matters: price structure and clean levels.
📌 Trade the chart, not the news. And when in doubt — zoom out.
🧠 “Uncertainty is the playground of the disciplined.”
✏️ Disclaimer
This is just my personal viewpoint. Always consult your financial advisor before taking any action.

Nifty50 June 2025 LevelNifty50 now chart tomorrow open down side and going up for breakout next swing.
