NIFTY : Intraday Trading levels and Plan for 25-Mar-2025Market Context:
Nifty closed at 22,080.30, with key structural zones identified:
🔴 Last Intraday Resistance Zone: 22,188 - 22,230
🟠 No Trade Zone: 22,070 - 21,966
🟢 Opening Support: 21,966
🟢 Last Intraday Support: 21,889
🟩 Key Demand Zone: 21,613 - 21,889 (Potential Wave C Completion Area)
With a 100+ point gap opening considered, let’s analyze different market scenarios.
🟢 Scenario 1: Gap-Up Opening (100+ Points Above 22,180)
If Nifty opens above 22,180, it enters the Last Intraday Resistance Zone (22,188 - 22,230).
Sustaining above 22,230 – A breakout above this resistance can lead to a potential move toward 22,356.
Failure at 22,230 – A rejection from this level could push Nifty back toward 22,080, the previous closing level.
If price consolidates near 22,230 without strong buying, it signals a possible reversal, making a short trade viable.
🔹 Trading Plan:
Go long only if Nifty sustains above 22,230 on an hourly close, targeting 22,356.
Sell below 22,188 if rejection is observed, with a target of 22,080.
Options traders can consider 22,200 CE for longs and 22,300 PE if rejection occurs.
🟡 Scenario 2: Flat Opening (Within 22,070 - 22,100)
A flat opening near 22,080 places Nifty in a neutral zone, requiring clear direction.
A move above 22,100 may lead to an attempt toward the resistance at 22,188 - 22,230.
A drop below 22,070 would push price into the No Trade Zone, signaling indecision.
A break below 21,966 will shift momentum bearish, targeting 21,889.
🔹 Trading Plan:
Avoid trades inside the No Trade Zone and wait for a breakout.
A rejection from 22,188 can offer a short trade opportunity toward 22,070.
Long positions should only be considered above 22,230, with proper stop-loss management.
🔴 Scenario 3: Gap-Down Opening (100+ Points Below 21,980)
A gap-down near 21,966 - 21,889 will bring price into Opening Support & Last Intraday Support Zones.
Holding 21,889 – A strong bounce can occur from this level, offering a buying opportunity.
Breaking 21,889 – If sustained selling continues, Nifty may move toward the Wave C Completion Zone (21,613 - 21,889).
If price enters the 21,613 - 21,889 range, this zone could act as a major reversal point based on the daily chart.
🔹 Trading Plan:
Look for buying opportunities at 21,889 if price shows signs of reversal.
If breakdown below 21,889 occurs, wait for confirmation before shorting toward 21,613.
Options traders can use 21,900 PE for breakdown trades and 21,800 CE for bounces.
📊 Risk Management Tips for Options Trading
✅ Use Stop Loss on an Hourly Close Basis – Avoid holding options without confirmation of direction.
✅ Trade Small in No Trade Zones – Wait for a breakout or rejection before increasing position size.
✅ Monitor India VIX – If volatility spikes, avoid aggressive short selling.
✅ Book Profits at Resistance & Support Levels – Avoid holding options till expiry unless confident in direction.
✅ Stay Disciplined – If market structure changes, be quick to adapt rather than forcing trades.
📌 Summary & Conclusion
Bullish Scenario: Above 22,230, Nifty can rally toward 22,356.
Neutral Zone: If trading between 21,966 - 22,070, wait for confirmation before trading.
Bearish Scenario: Below 21,889, weakness can extend toward 21,613, where a bounce is expected.
🔹 Best Risk-Reward Trades:
Buy near 21,889 if support holds.
Sell below 21,889 for a breakdown.
Buy only on a confirmed breakout above 22,230.
⚠️ Disclaimer:
I am not a SEBI-registered analyst. This analysis is for educational purposes only. Please conduct your own research or consult a financial advisor before making any trading decisions.
NIFTY trade ideas

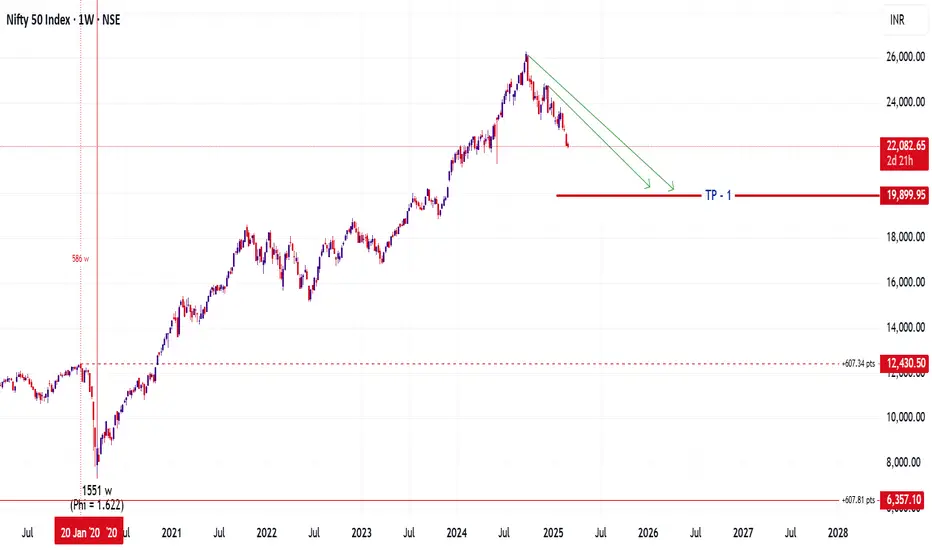
SHORTShort to target 1 level, price moving from 2.618 expansion top towards first TP level
Trade safe
Good luck
#Nifty50 5 match important level#Nifty50
99% working trading plan
Gap up open 22176 above & 15m hold after positive trade target 22236+
Gap up open 22176 below 15 m not break upside after nigetive trade target 22070,22038
Gap down open 22031 above 15m hold after positive trade target 22070, 22090+
Gap down open 22031 below 15 m not break upside after nigetive trade target 21992,
📌For education purpose I'm not responsible your trade
More education following me

nifty view hi dear, as per my view if nifty breaks 21900 level it may touch to 21500 level and there is a pending gap at downside level nearly 20400 level, in one day chart pattern its trading in channel pattern, for your clarification iam posting the chart please go through it, upside level it may bounce back to the level of 22350 which the fibonocchi level, for more info ping me.

NIFTY 50 at a Crossroad: Bullish or Bearish Path Ahead?NIFTY 50 is currently trading at 22,082.65 , facing crucial support and resistance levels. Based on technical analysis, two possible scenarios are emerging:
Bullish Case : If NIFTY breaks above 24,050 , it could see a strong uptrend, targeting 26,277 , 28,052 , and ultimately 31,996 in the long term.
Bearish Case : A breakdown below 20,285 may lead to a further decline towards 18,837 , 17,735 , and possibly 15,007 , testing previous long-term supports.
Reasons for Analysis :
Market Structure : NIFTY is in a corrective phase after a significant uptrend.
Key Levels : Identified historical support & resistance zones.
Volatility & Sentiment : Uncertain macroeconomic conditions and global market movements.
Trend Confirmation Needed : A breakout or breakdown will determine the next big move.
Conclusion
Traders should monitor 24,050 (resistance) and 20,285 (support) for confirmation of either trend. Stay cautious and manage risk accordingly! 🚀📉

Nifty Trend Direction - CUP and Saucer patternNifty 22119 -Has a CUP and Saucer pattern. Support at 22078 and if the current resistance at 22145 could get through next target is 22270-22280

levels to watch out I’ve been bearish on the market since last year, constantly warning about an impending correction. While it seems we've moved past the initial anxiety phase, retail investors are still in denial. Many are clinging to losing positions, hoping for a rally to help them average out their losses. A small 100-200 point uptick might bring temporary relief, but the real panic session is yet to come.
When that moment arrives, it’s likely to trigger a bloodbath, with the market potentially correcting deeper than anticipated, possibly even dipping below the 19,000 mark. That level, in my view, would represent an ideal opportunity for long-term accumulation. Once that floor is reached and the market stabilizes, it could set the stage for a new bull run that breaks through previous highs.


NIFTY : Analysis, levels, Prediction and next aheadThis chart provides an analysis based on Elliott Wave theory (Modified with psychological behavior), showing how the NIFTY 50 index has moved through different phases and highlighting important levels where price actions suggest significant market behavior.
Initially, prices consolidated around 21174-22469, forming the base of a larger upward move referred to as Wave C which was started from 15290 on weekly chart. This phase is significant because it shows the market finding strong support, where buyers stepped in to absorb selling pressure. This type of consolidation often indicates the foundation of a bullish rally. From here, the index began its upward journey, reaching an extended Wave C completion zone between 25,096 and 26,641 which was predicted on 30-Aug-2024 when prices were trading at 25151 .
from this range, prices started to lose strength, which is typical when markets approach exhaustion zones in an extended trend. The selling pressure increased, leading to a reversal.
charts.fyers.in
After hitting this extended resistance zone, the market entered a correction phase, forming Wave A. This phase is marked by a sharp decline, with prices finding support at 23,263, a significant 50% retracement of the previous move. Retracements like this are crucial because they represent a balance point where the market pauses to decide its next move. The 50% retracement is also a key Fibonacci level, often considered a strong resistance / support area. from retracement zone prices started decline again to complete its structure of ABC (Correction wave)
Currently, the index is trading in the first corrective Wave C zone between 22,762 and 23,061. This range is critical because it represents a decision point for the market. If prices hold here, it could signal the end of the correction and the start of a new upward wave. If the market fails to sustain this level, it could move further downward toward the extended correction zone at 21,617–21,893. This area is identified as a potential bottoming-out zone where strong support is expected. Historically, such zones offer good buying opportunities for traders looking for a trend reversal.
However, if prices fail to hold even this extended correction zone and break below 21,174, it would confirm a decisive bearish trend on both weekly and monthly charts. A breakdown like this would suggest a prolonged sideways or negative trend, meaning the market could struggle to recover for some time.
In summary, the chart highlights key areas to watch for potential market reversals. If prices hold above 22,762, there’s a good chance of a bullish recovery, and this could be a buying opportunity. On the other hand, if prices break below this level, the next significant support lies around 21,617–21,893. A failure to hold even that zone would shift the outlook to bearish, signaling the end of the bullish trend and a move toward a deeper correction. Understanding these levels and their significance helps traders and investors make informed decisions about when to enter or exit the market.

NIFTY : Is still Panic Ahead?
In Continuation of my last analysis on 27-Jan-2025
Updated on Daily Charts
Bullish Wave Completion (Wave 1):
The initial upward move saw prices reach a bullish wave completion zone between 21,179 and 22,481. This zone represents the culmination of a strong impulsive wave, with consolidation occurring around the lower band (21,179) after peaking. The support held firm, indicating potential for further upside initially.
Extended Wave C or Wave 3 Profit Booking (Wave 2):
Following the bullish peak, an extended Wave C or Wave 3 profit-booking zone was identified between 22,086 and 22,636. This zone triggered a sharp decline as prices hit the upper band, suggesting overextension and exhaustion of bullish momentum. The drop broke below the support of this zone, setting the stage for a corrective phase.
Correction Wave (Wave 3):
A corrective wave formed, confirmed by a 50% Fibonacci retracement of the prior upward move. This retracement level acted as a natural pullback point, with prices stabilizing briefly before resuming their downward trajectory. This wave indicates a healthy correction within the larger trend.
Support and Further Correction (Wave 4):
Prices found temporary support within the correction wave zone of 22,758 - 23,054. However, this support failed, leading to a further decline after the formation of Wave 4 on a minor wave. The chart marks this as part of an extended correction wave completion zone (21,613 - 21,894), where current price action is converging.
Current Market Position and Outlook:
As of the chart's context (March 2023, with the current date being March 4, 2025), prices are trading toward the extended correction zone (21,613 - 21,894). This zone represents a critical level where buyers might step in, but a break below could signal deeper losses.
Short-term resistance is noted around 23,054, while a sustained move below 21,894 could target the Primary Wave 4 bottom at 19,683. This level aligns with a significant long-term support zone, making it a key area to watch for reversal or continuation.
Trading Implications:
Bullish Case: If prices hold above 21,894 and show signs of reversal (e.g., bullish candlestick patterns or increased volume), traders might anticipate a bounce toward 23,054.
Bearish Case: A break below 21,894 with strong momentum could open the door to 19,683, especially if broader market sentiment turns negative.
Risk management is crucial, with stop-losses recommended below key support levels and targets set near resistance zones.

NIFTY 50 – Key Reversal Zones The NIFTY 50 Index is currently trading at 22,142.50, maintaining a marginal gain of +24.90 points (+0.11%) amid ongoing bearish pressure. Despite the small recovery, the overall market structure remains weak, with multiple Break of Structure (BoS) confirmations highlighting a sustained downtrend.
The price action in recent sessions has been heavily influenced by institutional liquidity sweeps. The Break of Structure (BoS) and Change of Character (CHoCH) signals indicate that sellers remain dominant, dragging the price lower into the discount zone, where potential buying interest may emerge.
Key observations:
Multiple Bearish Engulfing (BE) signals appearing at supply zones confirm that institutional sellers are actively offloading positions.
A strong downtrend with Lower Lows (LL) and Lower Highs (LH) suggests continued weakness unless a major reversal is triggered.
The 90th percentile liquidity sweep on February 28 led to a significant breakdown, taking price deeper into the discount zone, where buyers are attempting to stabilize.
Fibonacci & Equilibrium Levels:
0.236 Level (~22,142.50): Currently acting as short-term support; a breakdown here could accelerate further declines.
0.382 Level (~22,200 - 22,250): This level aligns with the area of interest and may act as a rejection point if price attempts a relief rally.
0.5 Level (~22,300): Considered an equilibrium zone; price needs to reclaim this for bullish momentum to strengthen.
0.618 - 0.786 Levels (~22,500 - 22,600): The premium zone where major supply sits. If price reaches this area, expect strong resistance.
Key Zones & Possible Scenarios:
Bearish Case: If price fails to hold 22,142, the next major support sits near 21,900 - 21,860, which aligns with strong liquidity levels. A move below this would indicate a deeper sell-off.
Bullish Case: If price sustains above 22,142 and clears 22,200, buyers could push it toward the 22,300 - 22,500 range, where a fresh supply test will determine the next trend.
The ongoing bearish trend suggests that any bounce should be viewed cautiously unless structural confirmation occurs. With price still trading within the discount zone, a liquidity grab could occur before a meaningful reversal. Monitoring key Fibonacci retracement levels and Smart Money Concepts (SMC) signals will be crucial for identifying the next major move.

#NIFTY Intraday Support and Resistance Levels - 04/03/2025Gap down opening expected in nifty near the 22050 level. After opening if nifty sustain above 22050 level then only expected upside movement in index. Upside 22300 level will act as a strong resistance for today's session. Major downside fall expected in nifty in case it's starts trading below 22000 level. This downside can goes upto 21700 level.

GLOBAL MARKET shows no RESPITE Following the global cues we can expect NIFTY to open very weak which could be followed by further weakness but the demand zone seems to be eminent hence can lead to volatility so no new longs should be made positional unless signs of REVERSAL is seen so plan your trades accordingly.

Nifty Intraday Support & Resistance Levels for 04.03.2025Monday’s session started on a positive note with a gap-up, as Nifty touched a high of 22,261.55 but failed to sustain and dropped to 22,004.70. It later recovered slightly, closing at 22,119.30, losing just 5 points from the previous close. The Weekly Trend (50 SMA) remains negative, while the Daily Trend (50 SMA) is now in oversold territory.
Demand/Support Zones
Near Support: 21,281.45 (Low of 4th June 2024)
Far Demand/Support Zone (Daily): 20,769.50 - 20,950
Supply/Resistance Zones
Near Supply/Resistance Zone (Daily): 22,508.40 - 22,625.30
Far Supply/Resistance Zone (Weekly): 22,720.30 - 23,049.95
Far Supply/Resistance Zone (Weekly): 23,222 - 23,807.30
Outlook
Nifty has declined 4,272 points (16%) in the last 5 months from its All-Time High of 26,277. The Daily 50 SMA is now oversold, which could lead to some buying near the 22,000 psychological level. However, multiple gaps and fresh supply zones on the Daily and Weekly charts indicate that any upside move is likely to face selling pressure at higher levels. A Sell-on-Rise strategy remains favorable until a strong reversal is confirmed.

#Nifty 4 march trading zone
99% working My trading plan
Gap up open 22170 above & 15m hold after positive trade target 22210,22290
Gap up open 22170 below 15 m not break upside after nigetive trade target 22083,22038, 21958
Gap down open 22082 above 15m hold after positive trade target 22170, 22210
Gap down open 22082 below 15 m not break upside after nigetive trade 22038,21958
📌For education purpose I'm not responsible your trade
More education following me

NIFTY FOR 04 MARCH 20251. Strong Resistance at 22,544.35 (Red Line)
2. Breakout Level at 22,226.10 (Black Line)
If it reclaims 22,226, we might see bullish momentum again.
3. Support Zones:
Support-1: 22,013.70
Support-2: 21,930.70
Strong Support: 21,859.50
If this level breaks, a deeper fall may happen.
Possible Scenarios:
• Bullish: If Nifty crosses above 22,226, it may test 22,317 and 22,429.
• Bearish: If it breaks 21,930, further downside to 21,859 is likely.
