NIFTY50.....Don't loose your panic!Hello Traders,
the NIFTY50 is trading within a range of 25116 to 24462 point range. This range began on May 15th and is ongoing 'til this week!
I have labelled this move as a wave 4!
Chart analysis:
If so to come, the next move should reach targets of roughly, 25574.90! Here, a wave 5 could end, or this was all of wave 1 of 5!
If the move is a wave 1 of 5, the targets are much higher for the coming 2-3 weeks ahead!
When it was all of wave 5 the next move would be a correction to the levels of 0.5 to 0.618 of the Fibo-retracements!
In any case, the advance is not over yet, and should last for a considerable amount of time!
If the index will exceed the former ATH @ 26277 points, here the risk is ascending for an end of an impulse!
But, step by step!
Due to the conflict between Israel and Iran, I recommend to step aside and wait for calm down the dispute in the coming days! Hopefully!
This conflict has the potential to set the region on fire!
In case of an escalation of this conflict, the risk would be really hard to forecast, but I guess the potential for a formidable crash is given!
Protect your tradingaccounts with suitable products to prevent the situation from escalating (sell calls, for example)!
I don't want to hear about anyone losing their entire trading account!
Have a great week.....
Ruebennase
Please ask or comment as appropriate.
Trade on this analysis at your own risk.
NIFTY trade ideas

Nifty Analysis EOD – June 13, 2025 – Friday 🟢 Nifty Analysis EOD – June 13, 2025 – Friday 🔴
🕊️ Gap-Down on Geopolitical Tension – Buyers Step In at Crucial Support
Nifty opened with a massive gap-down of 415 points at 24,473 triggered by overnight geopolitical tensions — testing a crucial swing low from May 22. Interestingly, the market formed an OL (Open = Low) pattern and staged a powerful 281-point intraday recovery, closing near the day’s high at 24,718.60.
While the adjusted close still reflects a −0.68% drop, the price action was dominantly bullish. The strong bounce from the 24,460–24,520 demand zone — a region that had acted as a reversal zone multiple times earlier — reaffirms its significance.
🧭 If global cues stabilize or turn positive, this could pave the way for a bounce back toward 25,000. But if Friday’s low is breached, sentiment damage may deepen further. For now, intraday opportunities are preferable over positional plays, as uncertainty persists.
📝 A reminder from the May 22 note:
“Is the retracement run finished? Technically, YES. A bold call, but unless global headwinds reappear, today’s low must sustain.”
Nifty has once again honored this level — but the coming sessions will determine whether this bounce was genuine or temporary.
🛡 5 Min Chart with Levels
🕯 Daily Time Frame Chart
🕯 Daily Candle Breakdown
Open: 24,473.00
High: 24,754.35
Low: 24,473.00
Close: 24,718.60
Net Change: −169.60 (−0.68%)
📊 Candle Structure Breakdown
Real Body: 245.60 pts → 🟢 Strong Green Candle
Upper Wick: 35.75 pts
Lower Wick: None (OL Formation)
🔍 Interpretation
Despite the gap-down, bulls took control right from the open.
The absence of a lower wick signals firm intraday confidence.
Closing near the high reinforces the buying strength, even on a net down day.
🔦 Candle Type
💚 Bullish Marubozu–like (OL) Candle– Represents a strong intra-session reversal, where buyers dominated from the very first tick.
📌 Key Insight
Price respected the 24,460–24,520 zone, once again validating it as key support.
If the next session crosses and sustains above 24,750–24,770, a short-term reversal confirmation could follow.
However, a breakdown below 24,473 may renew bearish pressure.
🛡 5 Min Intraday Chart
⚔️ Gladiator Strategy Update
ATR: 269.05
IB Range: 145.05 → Medium IB
Market Structure: Balanced
Trades:✅ 10:20 AM – Long Triggered → Target Achieved, Trailing SL Hit (RR: 1:1.7)
📌 Support & Resistance Zones
Resistance Levels
24,725 ~ 24,735
24,825 ~ 24,847 (Fibonacci 0.5 retracement level)
24,882 ~ 24,894
24,972 ~ 25,000
25,060 ~ 25,080
Support Levels
24,660
24,640 ~ 24,625
24,420
24,365 ~ 24,330
24,245 ~ 24,220
💭 Final Thoughts
Friday’s session was a battle between fear and resilience — and bulls showed up just in time. The key test ahead: can the index reclaim 25K or will the bounce fade away?
🧠 “Great rebounds are born from great fear — but follow-through is what separates noise from reversal.”
✏️ Disclaimer
This is just my personal viewpoint. Always consult your financial advisor before taking any action.

Market Recap & Outlook – Nifty and S&P 500, Bulls coming?The Indian stock market witnessed a volatile week, with the Nifty 50 closing at 24,718, down nearly 300 points from the previous week's close. The index hit a high of 25,222 and a low of 24,473, moving precisely within the range of 25,500–24,500 that I highlighted last week. I hope some of you took advantage of the cautionary signal!
Key Support Zone in Focus
The 24,400 level continues to act as a strong support—bulls have fiercely defended this zone for the past five weeks. However, if this level cracks, we could see Nifty test deeper supports at 23,900 and 23,700.
Geopolitical Overhang
The ongoing Iran-Israel tensions remain a wildcard. Unless the situation escalates significantly, I expect Nifty to trade in the 24,400–25,200 range this week.
Short-Term Strategy
I believe the current selling pressure might persist for 2–3 more sessions before the bulls regain control. Historically, Nifty tends to stay under pressure until mid-June, followed by a bullish phase leading into mid-July. If we get more dips, I’ll be looking to accumulate quality mid-cap and small-cap stocks for potential short-term gains.
S&P 500 Update
The S&P 500 closed at 5,976, down just 25 points from the previous week. The index made a high of 6,059 and a low of 5,963, forming a bearish candle on the weekly chart.
Watch These Levels
If 5,963 breaks, expect further downside towards 5,899 and 5,875. On the flip side, a sustained move above 6,030 could ignite bullish momentum, targeting resistance zones at 6,090 and 6,142.
Final Take – Bulls Gearing Up?
The broader trend still favors bulls, especially if key support levels hold. Watch for a turnaround by mid-week—"Bulls may soon reclaim the throne!"

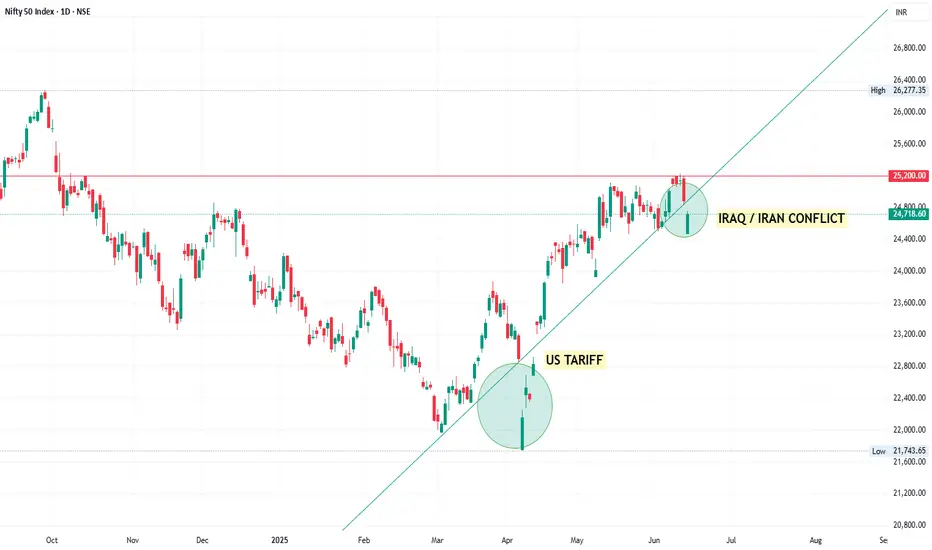
Buy on Dips is evident Uptrend Post-March 2025
The US Tariff news, though causing a temporary dip, didn’t break the trendline, indicating strong buying interest on dips.
Event-Driven Dips
US Tariff News (Early April):
Caused a sharp red candle, but was quickly bought into, forming a bullish pattern — often a sign of trend continuation.
Iraq/Iran Conflict (Early June):
Another dip occurred, briefly violating the trendline but closing with a large green candle — market resilience noted again.
Market Psychology & Sentiment
Buy-on-dips Strategy seems to dominate.
Events like tariffs or geopolitical tensions are triggering knee-jerk reactions, but institutional support is evident.
Technical Takeaways:
Trendline Support (starting from March low) remains valid; multiple touches confirm its strength.
25,200 is a key horizontal resistance; a decisive breakout above this may fuel fresh highs.
Watch for:
Break above 25,200: likely continuation toward 26,000+
Breakdown below 24,200: could test 23,600 and then 22,800
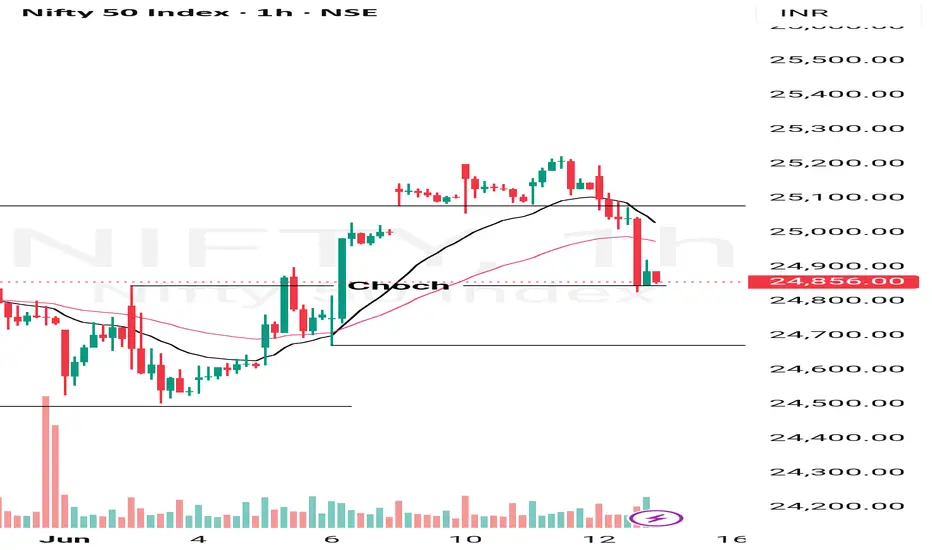
Nifty June 3rd Week Analysis Nifty is looking uncertain due to global uncertainties, and we need to track and expect moves through levels as there is no trend present on the chart right now . Upside is expected only if Nifty crosses and sustains above the 24850-950 range, and then it will face resistance at 25084. Upon crossing that, we can expect good short cover in Nifty. While if Nifty breaches 24600 on the downside, then it can slip up to levels of 24400-250.
All levels are marked in the chart posted.

Uptrending Nifty is consolidating near major support.Uptrending Nifty is consolidating near major support. If it breaks this support due to extenal factors. It will fall to next supportof 24K

Tensions in the Middle East. (Levels to watch, things to do). Iran and Israel situation is tense. Lot of investors have lot of questions in mind. I am trying to provide my opinion for the same in the video. I am trying to give my Technical and Political commentary on the situation in this educational video. The political commentary is based on my 15+ years of experience in the Middle East and is my personal opinion. I hope this will answer a lot of questions for you. I have also tried to give Techincal support and resistance levels for Nifty. In the 10 minute I have tried to cover as many points as I can. Along with the list of things to do as an investor. I hope this will help many of you.
As it was expected there was a deep fall in the market due to Israel Vs Iran tensions. US is also a direct or indirect party to the situation and if there is further escalation other global powers will mostly get involved. Due to the this situation market opened gap down at 24473. What we saw post that is Indian market recovered smartly from that situation to close at 24718. That is a huge 245 point recovery to end the day. This is why colour of the candles throughout the day (As this is an hourly chart are green despite we ended in red. (That is a classic Technical lesson for understanding candle sticks analytics). The closing is above the father line support of 24674 which is a good sign as this will be our support (Strong support for Monday.) I have spent more than 15 years in the Middle East and happen to know a little bit out of my personal experience, having interacted with a lot of locals. Thus I am trying to answer a few questions that might be coming in the minds of may investors including myself.
Q&A
The Question now are we out of danger?
Answer: Not yet.
Question 2: Why we are not out of danger?
Ans: The geo-political situation is very tense. The scale of Israeli attack was massive and there are clear and present chances of Iran counter attack which has already begun. Israel will respond again and Trump has already said that the next attacks by Israel will be even more fierce. No Iran is no palestine and there would be many countries that might support Iran. Specially China has already hinted support. Russia another ally is busy with Ukraine but you never know.
Question 3: How it goes for the other Middle Eastern countries?
Ans: There are lot of countries with US and Western bases on them. If Iran attacks them there are chances of other Western countries getting into the act too. In addition to some Middle Eastern countries getting into the act for the purpose of self defence. Thus over the weekend the things can get either very tense.
Question 4: What happens to India and Indian markets?
Ans: Today Indian markets have shown a lot of resilience. Global meltdown can affect us to for sure. But as we are neutral (As of now as it seems). The damage to our market hopefully will be minimal. Moreover recovery will be swift once the situation becomes less tense.
Question 5: What should investors do?
Ans: Long term investors can hold on to their long term positions in blue chip stocks. Keep stop losses and trailing stop losses in place for the mid-cap and small cap stocks. If some stop losses are hit or trailing stop losses are hit, you can always buy again as market is not going anywhere. The dip that we might potentially see can be an opportunity for long term investors for bottom fishing again and recalibrating their portfolios. (You can use the current situation to realign your portfolio for buying the trending stocks which have giving good results this quarter or have been giving good results since last few quarters.) Get rid of the stocks that have been dragging your portfolio down. Market has provided another opportunity for a fresh start.
Things you can do:
1) Gold and Silver are always a great option when it comes to uncertain times.
2) Do not give a knee jerk reaction in selling off your winners.
3) Watch the global updates and keep stop losses and trailing stop losses accordingly.
4) Re-calibrate your portfolio
5) If you are sitting on cash use the dip for investing in stocks with long term perspective.
The support for Nifty Remain at: 24674 (Father line support), 24640 (Mid-channel support), 24492 (Trend line support), 24382, 24208 and finally 24077 (Channel Bottom Support). a closing below 24077 will enable and empower bears to Pull Nifty further down.
Resistances for Nifty remain at: 24752, 24818, 24906 (Mother line Resistance), 25043, 25138 and finally 25223 (Channel top Resistnace). Above 25223 Bulls will potentially take over the market.
To know more about Mother Father and Small Child theory, Parallel Channel, Technical and Fundamental analysis and to learn it to master it. Read my book. The Happy Candles Way To Wealth Creation available on Amazon in Paperback and Kindle version. The book is one of the highest rated books in the category and many readers consider it as a Hand Book for Equity investment.
Disclaimer: The above information is provided for educational purpose, analysis and paper trading only. The political commentary is based on personal views and analysis. Please don't treat this as a buy or sell recommendation for the stock or index. The Techno-Funda analysis is based on data that is more than 3 months old. Supports and Resistances are determined by historic past peaks and Valley in the chart. Many other indicators and patterns like EMA, RSI, MACD, Volumes, Fibonacci, parallel channel etc. use historic data which is 3 months or older cyclical points. There is no guarantee they will work in future as markets are highly volatile and swings in prices are also due to macro and micro factors based on actions taken by the company as well as region and global events. Equity investment is subject to risks. I or my clients or family members might have positions in the stocks that we mention in our educational posts. We will not be responsible for any Profit or loss that may occur due to any financial decision taken based on any data provided in this message. Do consult your investment advisor before taking any financial decisions. Stop losses should be an important part of any investment in equity.

Tensions in the Middle East.(Geopolitical and Technical updates)As it was expected there was a deep fall in the market due to Israel Vs Iran tensions. US is also a direct or indirect party to the situation and if there is further escalation other global powers will mostly get involved. Due to the this situation market opened gap down at 24473. What we saw post that is Indian market recovered smartly from that situation to close at 24718. That is a huge 245 point recovery to end the day. This is why colour of the candles throughout the day (As this is an hourly chart are green despite we ended in red. (That is a classic Technical lesson for understanding candle sticks analytics). The closing is above the father line support of 24674 which is a good sign as this will be our support (Strong support for Monday.) I have spent more than 15 years in the Middle East and happen to know a little bit out of my personal experience, having interacted with a lot of locals. Thus I am trying to answer a few questions that might be coming in the minds of may investors including myself.
The Question now are we out of danger?
Answer: Not yet.
Question 2: Why we are not out of danger?
Ans: The geo-political situation is very tense. The scale of Israeli attack was massive and there are clear and present chances of Iran counter attack which has already begun. Israel will respond again and Trump has already said that the next attacks by Israel will be even more fierce. No Iran is no palestine and there would be many countries that might support Iran. Specially China has already hinted support. Russia another ally is busy with Ukraine but you never know.
Question 3: How it goes for the other Middle Eastern countries?
Ans: There are lot of countries with US and Western bases on them. If Iran attacks them there are chances of other Western countries getting into the act too. In addition to some Middle Eastern countries getting into the act for the purpose of self defence. Thus over the weekend the things can get either very tense.
Question 4: What happens to India and Indian markets?
Ans: Today Indian markets have shown a lot of resilience. Global meltdown can affect us to for sure. But as we are neutral (As of now as it seems). The damage to our market hopefully will be minimal. Moreover recovery will be swift once the situation becomes less tense.
Question 5: What should investors do?
Ans: Long term investors can hold on to their long term positions in blue chip stocks. Keep stop losses and trailing stop losses in place for the mid-cap and small cap stocks. If some stop losses are hit or trailing stop losses are hit, you can always buy again as market is not going anywhere. The dip that we might potentially see can be an opportunity for long term investors for bottom fishing again and recalibrating their portfolios. (You can use the current situation to realign your portfolio for buying the trending stocks which have giving good results this quarter or have been giving good results since last few quarters.) Get rid of the stocks that have been dragging your portfolio down. Market has provided another opportunity for a fresh start.
Things you can do:
1) Gold and Silver are always a great option when it comes to uncertain times.
2) Do not give a knee jerk reaction in selling off your winners.
3) Watch the global updates and keep stop losses and trailing stop losses accordingly.
4) Re-calibrate your portfolio
5) If you are sitting on cash use the dip for investing in stocks with long term perspective.
The support for Nifty Remain at: 24674 (Father line support), 24640 (Mid-channel support), 24492 (Trend line support), 24382, 24208 and finally 24077 (Channel Bottom Support). a closing below 24077 will enable and empower bears to Pull Nifty further down.
Resistances for Nifty remain at: 24752, 24818, 24906 (Mother line Resistance), 25043, 25138 and finally 25223 (Channel top Resistnace). Above 25223 Bulls will potentially take over the market.
To know more about Mother Father and Small Child theory, Parallel Channel, Technical and Fundamental analysis and to learn it to master it. Read my book. The Happy Candles Way To Wealth Creation available on Amazon in Paperback and Kindle version. The book is one of the highest rated books in the category and many readers consider it as a Hand Book for Equity investment.
Disclaimer: The above information is provided for educational purpose, analysis and paper trading only. The political commentary is based on personal views and analysis. Please don't treat this as a buy or sell recommendation for the stock or index. The Techno-Funda analysis is based on data that is more than 3 months old. Supports and Resistances are determined by historic past peaks and Valley in the chart. Many other indicators and patterns like EMA, RSI, MACD, Volumes, Fibonacci, parallel channel etc. use historic data which is 3 months or older cyclical points. There is no guarantee they will work in future as markets are highly volatile and swings in prices are also due to macro and micro factors based on actions taken by the company as well as region and global events. Equity investment is subject to risks. I or my clients or family members might have positions in the stocks that we mention in our educational posts. We will not be responsible for any Profit or loss that may occur due to any financial decision taken based on any data provided in this message. Do consult your investment advisor before taking any financial decisions. Stop losses should be an important part of any investment in equity.

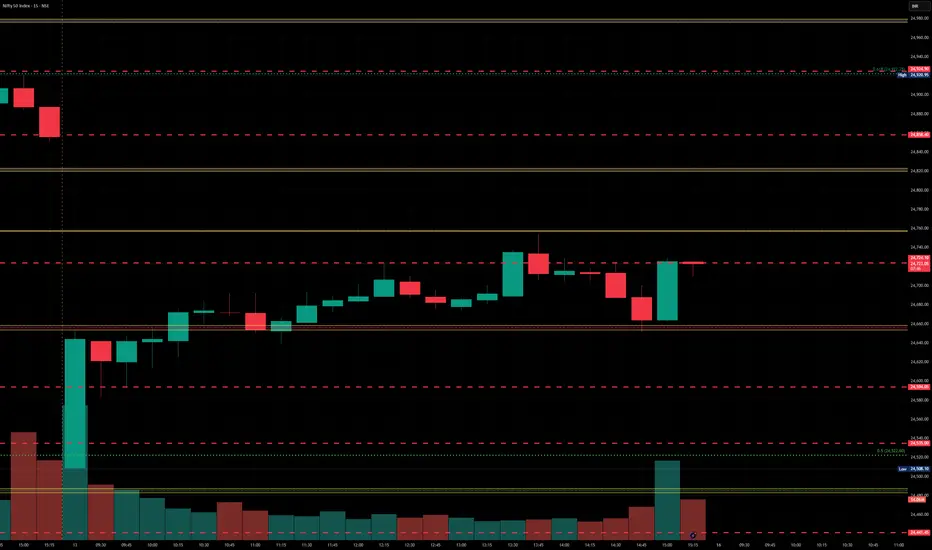
Nifty levels - Jun 16, 2025Nifty support and resistance levels are valuable tools for making informed trading decisions, specifically when combined with the analysis of 5-minute timeframe candlesticks and VWAP. By closely monitoring these levels and observing the price movements within this timeframe, traders can enhance the accuracy of their entry and exit points. It is important to bear in mind that support and resistance levels are not fixed, and they can change over time as market conditions evolve.
The dashed lines on the chart indicate the reaction levels, serving as additional points of significance to consider. Furthermore, take note of the response at the levels of the High, Low, and Close values from the day prior.
We hope you find this information beneficial in your trading endeavors.
* If you found the idea appealing, kindly tap the Boost icon located below the chart. We encourage you to share your thoughts and comments regarding it.
Wishing you success in your trading activities!


Will Nifty give breakoutNifty 24688 is in a verge to breakout..But Momentum is reducing.. Will it breakout ?

Nifty 23500 Either buying opportunity or just short covering !today on 13 June nifty again support on 23500 which is talking by us very important support level, look at here ultra-high volume appear on 9.15 candle, and we are seeing bounce back from here. it could become a good opportunity buy on dips but if really smart money pending order near 23500 so why this bounce back come with falling volume, I cleared on chart it might be just short covering. what is your opinion comment please.

#NIFTY Intraday Support and Resistance Levels - 13/06/2025Today, a gap-down opening is expected in Nifty near the 24,700 level. If Nifty sustains below the 24,700 mark after opening, a continuation of the bearish trend may take place with potential downside targets at 24,650, 24,600, and even 24,550+.
On the other hand, if Nifty manages to reclaim the 24,750–24,800 zone and starts trading above it, we could see a short-term pullback or recovery rally towards 24,850, 24,900, and 24,950+ levels.
However, the 24,950 level will act as a strong resistance for today’s session — any upside attempt may see rejection or profit booking from this zone.

Nifty 12-JUNE-25 VIEW Everything is on chart for SWING view
AREA UP AREA LOW SPACE
AND MY VIEW FOR LONGTERM IS SAME

Nifty Bearish . Trend directionNifty 24888 has formed an UT and has fallen. Trend is bearish.
Efforts were average but results were high due to fear factor. Some short covering pushed Nifty from low 24844 to 24888. Support at 24742,24540 and resistance at 24954.
We expect a fair chance will be given to bulls if they could move Nifty above 24888 to take nifty to resistance before moving to support. If gap down, panic will drive to 24540 and further,

Things heating up between Iran and US. Market takes a nose dive.There is a news of things heating up between Iran and US with regards to Nuclear negotiations. It seems US has asked for reduction of staff at few embassies across the Middle East. In addition to the tragic plane crash in Ahmedabad also might have affected the sentiment. Market had already nosedived before the tragedy struck so it is hard to say it had any effect. Only logical explanation seems to be the Iran related escalation. On the technical Nifty was not able to hold above 25200 levels even after multiple attempts. This suggests upside-down there were currently no takes for the upside such scenario only leads to a correction and market diving to find a concrete bottom before beginning the next upward movement. The geo-political developments should be closely watched to speculate about further moves of market.
The zone between 24818 to 24672 has multiple supports including trend line support and mid-channel support and Father line support at 24672 as it can be seen in the chart. A closing below 24672 will only give the advantage to the bears who can further drag the Nifty towards 24492, 24382 or 24208 (Channel bottom support). Things get worse beyond this point but we will only talk about it if we get a closing below this level.
Resistance on the upside remain at 24902, 24974 (Mother line Resistance), 25043, 25138 and 25223. If we get a closing above 25223 then the channel top will be around 25337. Regarding the levels above 25337 we will post once we reach that stage.
Disclaimer: The above information is provided for educational purpose, analysis and paper trading only. Please don't treat this as a buy or sell recommendation for the stock or index. The Techno-Funda analysis is based on data that is more than 3 months old. Supports and Resistances are determined by historic past peaks and Valley in the chart. Many other indicators and patterns like EMA, RSI, MACD, Volumes, Fibonacci, parallel channel etc. use historic data which is 3 months or older cyclical points. There is no guarantee they will work in future as markets are highly volatile and swings in prices are also due to macro and micro factors based on actions taken by the company as well as region and global events. Equity investment is subject to risks. I or my clients or family members might have positions in the stocks that we mention in our educational posts. We will not be responsible for any Profit or loss that may occur due to any financial decision taken based on any data provided in this message. Do consult your investment advisor before taking any financial decisions. Stop losses should be an important part of any investment in equity.

13june Nifty50 brekout and Breakdown leval✅ Bullish (Buy/Call - CE) Zones:
24628–Above 10m hold CE by zone
24788 –Above 10m hold CE by zone
24970 –Above 10m hold CE by zone
25170 –Above 10m hold CE by zone
25388 - Above 10m Closing: Shot Cover Possible
24488 -Above 10m hold CE By Safe Zone
Bearish (Buy/Put - PE) Zones:
25388 -Below 10m hold PE by zone
25170 –Below 10m hold PE by zone
24970 -Below 10m PE By Risky Zone
24628 -Below 10m Hold PE by Risky Zone
24488. BELOW UNWINDING POSSIBLE

Nifty Analysis EOD – June 12, 2025 – Thursday🟢 Nifty Analysis EOD – June 12, 2025 – Thursday 🔴
📉 Range Breakout on Expiry – Bears Steal the Show
As highlighted in yesterday’s note — “Watch 25,222 on the upside and 25,080 on the downside for breakout” — Thursday’s expiry session decisively broke the range to the downside, unleashing a sharp bearish move.
Nifty opened strong at 25,164.45, briefly tested 25,196, but once again failed to challenge 25,200. The rejection triggered a slide to 25,083, and shortly after, the critical support of 25,080 gave way. This breakdown triggered long unwinding and fresh shorts, accelerating the fall all the way to 24,825.90 — a sharp 197-point drop.
Though there was a brief 90-point retracement, that too was sold into, and the index closed at 24,888.20 (adjusted), very close to the day’s low. This fall filled the Gaps created on June 6 and 9, and settled around the 0.5 Fibonacci retracement level (based on June 3 low to June 11 high).
With such a close, the market signals a strong shift in sentiment. Going ahead, 24800–24768 becomes a critical support zone. Bulls now need to reclaim and close above 25,020 to regain any strength. Until then, bias remains bearish.
🛡 5 Min Chart with Levels
🕯 Daily Time Frame Chart
🕯 Daily Candle Breakdown
Open: 25,164.45
High: 25,196.20
Low: 24,825.90
Close: 24,888.20
Net Change: −253.20 (−1.01%)
📊 Candle Structure Breakdown
Real Body: 276.25 pts → 🔴 Strong Red Candle
Upper Wick: 31.75 pts
Lower Wick: 62.30 pts
🔍 Interpretation
Bears dominated from start to finish, with hardly any resistance from the bulls.
The close near the day’s low reinforces strong bearish sentiment.
The lower wick is minimal — buying interest was absent post-selloff.
🔦 Candle Type
🔥 Bearish Marubozu–like Candle– Reflects powerful downside momentum and strong seller conviction.
📌 Key Insight
The candle wipes out 3 sessions of buildup — textbook bearish breakdown.
Support at 24,820–24,850 is critical. A breakdown from here could invite deeper correction.
Only a close above 25,020 can negate this bearish tone. Otherwise, weakness may persist.
🛡 5 Min Intraday Chart
⚔️ Gladiator Strategy Update
ATR: 252.81
IB Range: 131.4 → Medium IB
Market Structure: Balanced
Trades:✅ 11:10 AM – Short Triggered → Target Achieved, Trailing SL Hit (RR: 1:4.65)
📌 Support & Resistance Zones
Resistance Levels
24,920
24,972 ~ 25,000
25,060 ~ 25,080
25,102
25,125
25,180 ~ 25,212
Support Levels
24,820
24,800 ~ 24,768
24,735 ~ 24,725
24,660
24,640 ~ 24,625
💭 Final Thoughts
With a decisive range breakdown and expiry volatility behind us, the battle zone shifts to 24,800–25,000. Expect more pressure if bulls fail to reclaim 25,020.
🧠 “Markets don’t wait forever at the edge of range—they break, and break hard.”
✏️ Disclaimer
This is just my personal viewpoint. Always consult your financial advisor before taking any action.

Nifty levels - Jun 13, 2025Nifty support and resistance levels are valuable tools for making informed trading decisions, specifically when combined with the analysis of 5-minute timeframe candlesticks and VWAP. By closely monitoring these levels and observing the price movements within this timeframe, traders can enhance the accuracy of their entry and exit points. It is important to bear in mind that support and resistance levels are not fixed, and they can change over time as market conditions evolve.
The dashed lines on the chart indicate the reaction levels, serving as additional points of significance to consider. Furthermore, take note of the response at the levels of the High, Low, and Close values from the day prior.
We hope you find this information beneficial in your trading endeavors.
* If you found the idea appealing, kindly tap the Boost icon located below the chart. We encourage you to share your thoughts and comments regarding it.
Wishing you success in your trading activities!

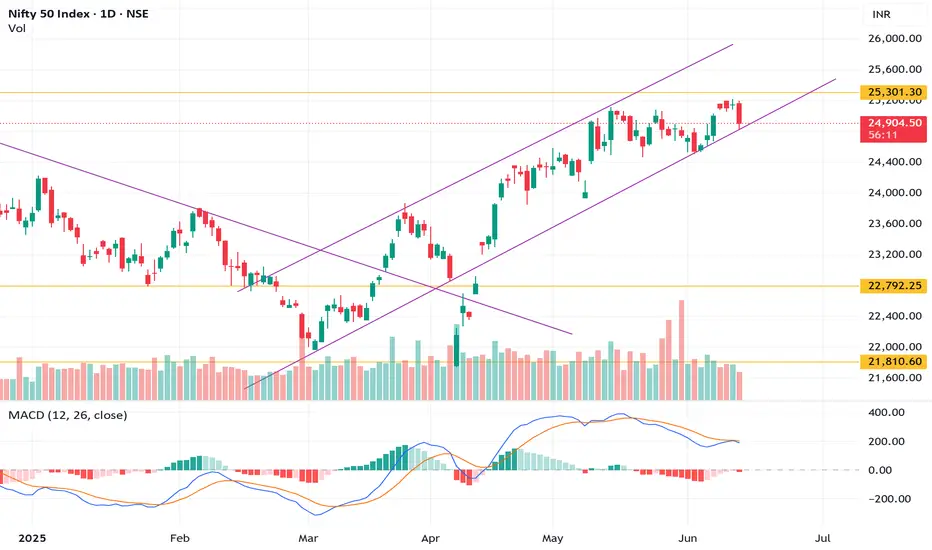
Nifty 50 At Key Resistance– Trendline Retest or Bullish BreakoutChart Type: Daily (1D)
Index: Nifty 50 (NSE)
Current Price: ₹24,866
Date: June 12, 2025
🔍 Technical Analysis:
Rising Channel:
Nifty 50 is trading within a well-defined ascending channel. The recent price action shows a strong bounce from the lower channel trendline, but today's candle indicates rejection near the upper boundary around ₹25,300.
Resistance Zone:
The level ₹25,301 is acting as a major resistance zone. A decisive close above this could push Nifty towards ₹25,600–25,800.
Support Levels:
Immediate support rests around ₹24,600 (channel midline) and stronger support near ₹24,250–24,100 (aligned with moving averages).
Moving Averages:
Price is comfortably above both the 50 EMA and 200 EMA, indicating a bullish medium-to-long term trend.
50 EMA ≈ ₹24,253
200 EMA ≈ ₹24,083
MACD Indicator:
MACD line is above the signal line but showing signs of a potential bearish crossover. Momentum is slowing, so short-term caution is advised.
Volume:
Selling volume is picking up—watch for confirmation. If accompanied by a breakdown below ₹24,600, a short-term correction could begin.
📌 Trade Plan:
Bullish Bias:
If Nifty breaks and sustains above ₹25,301 with strong volume, expect upside towards ₹25,600–₹25,800.
Bearish Bias:
Rejection at resistance and break below ₹24,600 could lead to a fall toward ₹24,250, and even ₹23,800 in the short term.
NIFTY ZONE OF UNCERTAINITY NIFTY ZONE OF UNCERTAINITY . Know what to expect and plan accordingly to Buy or Sell
Regards
Psycho Trader
