Nifty Facing resistnace above 25200 zoneToday Nifty closing above 25141 is a positive sign but it is evidently facing resistnace above 25200 zone. Nifty made a high of 25222 today but could not sustain at those levels and fell but eventually closed in the positive. The daily candle formed is an indecisive Doji.
IT Sector seems to be on the verge of a Reverse Head and Shoulder Breakout. If this breakout happens and Nifty gets support from other heavy weights we can see it growing further.
The resistances for Nifty now are at 25222, 25270 and 25310.
The supports for Nifty are at 25104, 25044, 24977 (Mother line support of Daily chart and 24953 Channel bottom. Things are in balance with shadow of the candle slightly positive.
Disclaimer: The above information is provided for educational purpose, analysis and paper trading only. Please don't treat this as a buy or sell recommendation for the stock or index. The Techno-Funda analysis is based on data that is more than 3 months old. Supports and Resistances are determined by historic past peaks and Valley in the chart. Many other indicators and patterns like EMA, RSI, MACD, Volumes, Fibonacci, parallel channel etc. use historic data which is 3 months or older cyclical points. There is no guarantee they will work in future as markets are highly volatile and swings in prices are also due to macro and micro factors based on actions taken by the company as well as region and global events. Equity investment is subject to risks. I or my clients or family members might have positions in the stocks that we mention in our educational posts. We will not be responsible for any Profit or loss that may occur due to any financial decision taken based on any data provided in this message. Do consult your investment advisor before taking any financial decisions. Stop losses should be an important part of any investment in equity.
NIFTY trade ideas
Nifty Analysis EOD – June 11, 2025 – Wednesday🟢 Nifty Analysis EOD – June 11, 2025 – Wednesday 🔴
♻️ Déjà vu Day – Bulls Attempt, Bears Resist
For the third consecutive session, Nifty started on a positive note with a 45-point gap-up at 25,134.15, but as has been the pattern lately, early optimism was wiped out instantly, with the index hitting the day’s low of 25,081 within the first 5 minutes.
What followed was a gradual climb as bulls gained some momentum, pushing Nifty to test the 25,200 zone. However, resistance in the 25,200–25,222 band proved too strong. Despite multiple attempts, bulls gave up the level around 13:20, triggering a sharp fall to 25,100.
Post-fall, the market struggled to recover and closed at 25,141.40, up just 37 points from the previous close. It was yet another rangebound, indecisive session, showing that the index is coiling for a potential breakout—but the direction remains uncertain.
🛡 5 Min Chart with Levels
🕯 Daily Time Frame Chart
🕯 Daily Candle Breakdown
Open: 25,134.15
High: 25,222.40
Low: 25,081.30
Close: 25,141.40
Net Change: +37.15 (+0.15%)
📊 Candle Structure Breakdown
Real Body: 7.25 pts → 🟢 Small Green Candle
Upper Wick: 81.00 pts
Lower Wick: 52.85 pts
🔍 Interpretation
Strong intra-day swings in both directions signal high volatility with no control on either side.
Bulls failed at resistance (25,222); bears couldn’t break support (25,081).
The tiny real body with long shadows reflects market indecision.
🔦 Candle Type
⚖️ Spinning Top– Neutral structure with no clear directional conviction.
📌 Key Insight
The market is clearly taking a breather after recent moves.
Watch 25,222 on the upside and 25,080 on the downside — a breakout from either could set the next directional tone.
Bias stays mildly bullish as long as 25,080 holds, but it’s hanging by a thread.
🛡 5 Min Intraday Chart
⚔️ Gladiator Strategy Update
ATR: 239.75
IB Range: 72.9 → Small IB
Market Structure: Balanced
Trades:✅ 10:30 AM – Long Triggered → Target Achieved, Trailing SL Hit (RR: 1:1.65)
📌 Support & Resistance Zones
Resistance Levels
25,116 ~ 25,128
25,180 ~ 25,222
25,285
Support Levels
25,062 ~ 25,070
24,972
24,920 ~ 24,894
24,800 ~ 24,768
💭 Final Thoughts
Market is in a tight tug-of-war. No clear winner yet, but momentum can build quickly once a side gives in.Patience will pay—wait for the range breakout.
🧠 "Pressure builds silently before an explosion—so does the market before a breakout."
✏️ Disclaimer
This is just my personal viewpoint. Always consult your financial advisor before taking any action.

Nifty levels - Jun 12, 2025Nifty support and resistance levels are valuable tools for making informed trading decisions, specifically when combined with the analysis of 5-minute timeframe candlesticks and VWAP. By closely monitoring these levels and observing the price movements within this timeframe, traders can enhance the accuracy of their entry and exit points. It is important to bear in mind that support and resistance levels are not fixed, and they can change over time as market conditions evolve.
The dashed lines on the chart indicate the reaction levels, serving as additional points of significance to consider. Furthermore, take note of the response at the levels of the High, Low, and Close values from the day prior.
We hope you find this information beneficial in your trading endeavors.
* If you found the idea appealing, kindly tap the Boost icon located below the chart. We encourage you to share your thoughts and comments regarding it.
Wishing you success in your trading activities!

3rd day, and price still hovering within the same range! 📍 Nifty (TF : 1D)
3rd day, and price still hovering within the same range!
Next Hurdle for Nifty @ 25210 / 25325 above this price action indication a stable drive towards 26000 & above
📌 Major Data : US CPI (IST 6:00 PM)

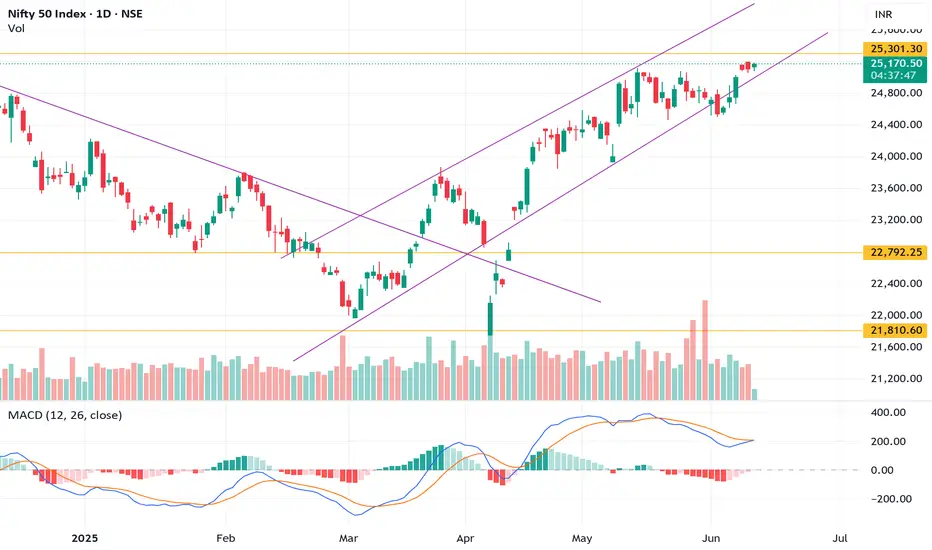
NIFTY 50 Approaching Resistance – Watch for Breakout or ReversalNifty 50 is trading at 25,175, staying strong inside a rising parallel channel since early April. Price action is consolidating just below the key resistance zone at 25,301, which is also the upper boundary of the channel.
Key Levels:
🔼 Resistance Levels:
25,301 – Immediate resistance (channel top)
25,500+ – Possible breakout target if channel is breached
🔽 Support Levels:
24,700 – Channel midline and recent support
24,080 – 50-day moving average
22,792 – Previous major swing low
21,810 – Strong horizontal support zone
Indicators:
MACD is turning bullish again after a minor pullback, hinting at a possible continuation.
Volume has slightly decreased, signaling caution near the top.
Price is above both the 50-day and 200-day moving averages, supporting the bullish structure.
Conclusion:
Nifty is at a crucial juncture. A breakout above 25,301 could trigger further upside momentum, while failure to break may lead to a healthy pullback toward support zones. Keep a close eye on price action near the channel resistance for confirmation.
MARKET DIRECTIONPosiible path of Nifty looking strong after sustain last CHOCH and BOS confirmation looking for top 25750 order block of larg selling orders here seller can not holding to bear the market they need mor order to sell those are present at 25750 only

#NIFTY Intraday Support and Resistance Levels - 11/06/2025Nifty opened with a slight gap-up near the 25100 level, continuing its recent pattern of consolidation. Despite the positive opening, the index remains well within its established range, suggesting that market participants are still awaiting a decisive breakout. There are no major changes observed in key support or resistance levels compared to the previous sessions, reinforcing the view that the market is currently lacking strong directional momentum.
On the upside, if Nifty sustains above the 25100–25250 zone, it could attempt a move toward 25350, followed by 25400 and potentially 25450+. However, this upward move will require strong follow-through buying to break the current consolidation zone. Until then, any intraday rallies may face resistance near the 25250 mark, making it a crucial level to watch for bulls.
Conversely, failure to hold above the 25200–25250 region could lead to a reversal toward 25150, and if selling pressure intensifies, a further decline toward 25100 and 25050 may unfold. These levels are important short-term supports and have previously acted as buying zones. A break below 25050 may open the gates for deeper cuts, though that remains unlikely unless broader market sentiment weakens.

11 june Nifty50 brekout and Breakdown leval Nifty 50 Index, here's a breakdown of the "Sell Levels" from a trading strategy point of view:
📉 Key Sell (Put Entry / PE) Zones:
25,140 – Below this level:
Tagged as "Below nigetive trade view"
This suggests initiating bearish positions (sell or buy PE) if price falls below this
25,040 – Opening Support / Resistance:
If price breaks below this with volume, it's a confirmed breakdown, suitable for short trades.
24,980 – above 10m hold CE by RISKY ZONE:
Below this, call options (CE) become risky. Could start unwinding.
24,980 – Below 10m hold PE By Zone:
Strong confirmation to hold PE positions.
24,908 – CE By Safe Zone:
A very strong bearish confirmation if price dips below this.

Nifty Analysis EOD – June 10, 2025 – Monday🟢 Nifty Analysis EOD – June 10, 2025 – Monday 🔴
🔄 Fallback From the Top – Another Rangebound Day
Nifty began the session on a bullish note with a Gap-Up of 97 points at 25,199.30, but that turned out to be both the Open and High of the day.
Within the first 20 minutes, the index plunged 144 points, even breaking below the previous day’s low, signaling a swift sentiment shift. However, just a few minutes later, it rebounded sharply and tested the previous day’s high — not surprising, given the narrow range of the prior session.
But after 11:00 AM, the action dried up. The rest of the day saw tight, sideways movement within just 35 points, eventually closing at 25,104.25, barely 1 point above the previous close.
On paper, it looks like a neutral session, but price action reveals weakness and distribution near the top. Bulls need to reclaim control quickly, or the door opens for a short-term dip.
🛡 5 Min Chart with Levels
🕯 Daily Time Frame Chart
🕯 Daily Candle Breakdown
Open: 25,196.05
High: 25,199.30
Low: 25,055.45
Close: 25,104.25
Net Change: +1.05 (0.00%)
📊 Candle Structure Breakdown
Real Body: 91.80 pts → 🔴 Red Candle (Close < Open)
Upper Wick: 3.25 pts (Very Small)
Lower Wick: 48.80 pts
🔍 Interpretation
Price opened at the top, immediately reversed, and closed near the lower end of the day’s range.
Despite the flat close, the intraday structure is weak, showing signs of profit booking or early distribution.
The small upper wick reflects no follow-through buying.
🔦 Candle Type
🟥 Bearish Candle with Long Body and Lower Wick– Often seen during pullbacks or trend pauses.
📌 Key Insight
Support near 25,050–25,070 is critical—if it breaks, expect further downside pressure.
Bulls must reclaim 25,200 to keep the uptrend intact.
🛡 5 Min Intraday Chart
⚔️ Gladiator Strategy Update
ATR: 250.71
IB Range: 143.85 → Medium IB
Market Structure: Balanced
Trades:❌ No Trade Triggered by the system
📌 Support & Resistance Zones
Resistance Levels
25,116 ~ 25,128
25,180 ~ 25,212
25,285
Support Levels
25,062 ~ 25,070
24,972
24,920 ~ 24,894
24,800 ~ 24,768
💭 Final Thoughts
Market is playing inside a box, testing patience on both sides.Expansion is near, but which way? Keep risk defined and emotions in check.
🧠 “Don't mistake silence for weakness. The market is coiling—ready to snap.”
✏️ Disclaimer
This is just my personal viewpoint. Always consult your financial advisor before taking any action.

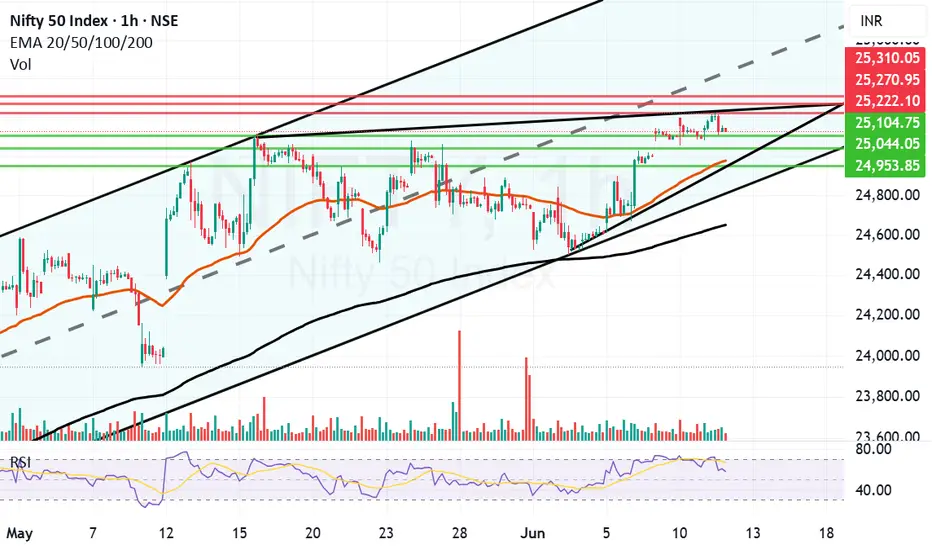
Nifty facing trendline resistance and RSI cooling down. Nifty had come close to overbought zone. Not that it was immensely overbought. It is also facing a trendline resistance which is hampering it's further progress. Bears are trying their best to bring it down while Bulls are trying to pull it above the trend line. The trade is in perfect balance right now. Once during the day Nifty had broken the trendline resistnace too as it made a high of 25199 but could not sustain the levels and was pulled down immediately. 25055 provided support and kept it Flat.
Supports for Nifty now remain at 25052, 24957, 24917 (Mother line of hourly chart), 24846 is another trend line support. Father line support is at 24614. Below this level bears will take over.
Resistances for Nifty remain at 25118, 25199 (Trend line resistance), A closing above 25199 will enable and empower bears as this will be a closing above mid channel resistance too. In such a scenario Bulls can further full Nifty upwards towards 25298 and 25387 levels.
Disclaimer: The above information is provided for educational purpose, analysis and paper trading only. Please don't treat this as a buy or sell recommendation for the stock or index. The Techno-Funda analysis is based on data that is more than 3 months old. Supports and Resistances are determined by historic past peaks and Valley in the chart. Many other indicators and patterns like EMA, RSI, MACD, Volumes, Fibonacci, parallel channel etc. use historic data which is 3 months or older cyclical points. There is no guarantee they will work in future as markets are highly volatile and swings in prices are also due to macro and micro factors based on actions taken by the company as well as region and global events. Equity investment is subject to risks. I or my clients or family members might have positions in the stocks that we mention in our educational posts. We will not be responsible for any Profit or loss that may occur due to any financial decision taken based on any data provided in this message. Do consult your investment advisor before taking any financial decisions. Stop losses should be an important part of any investment in equity.

Nifty levels - Jun 11, 2025Nifty support and resistance levels are valuable tools for making informed trading decisions, specifically when combined with the analysis of 5-minute timeframe candlesticks and VWAP. By closely monitoring these levels and observing the price movements within this timeframe, traders can enhance the accuracy of their entry and exit points. It is important to bear in mind that support and resistance levels are not fixed, and they can change over time as market conditions evolve.
The dashed lines on the chart indicate the reaction levels, serving as additional points of significance to consider. Furthermore, take note of the response at the levels of the High, Low, and Close values from the day prior.
We hope you find this information beneficial in your trading endeavors.
* If you found the idea appealing, kindly tap the Boost icon located below the chart. We encourage you to share your thoughts and comments regarding it.
Wishing you success in your trading activities!

NIFTY S/R Support and Resistance Levels:
Support Levels: These are price points (green line/shade) where a downward trend may be halted due to a concentration of buying interest. Imagine them as a safety net where buyers step in, preventing further decline.
Resistance Levels: Conversely, resistance levels (red line/shade) are where upward trends might stall due to increased selling interest. They act like a ceiling where sellers come in to push prices down.
Breakouts:
Bullish Breakout: When the price moves above resistance, it often indicates strong buying interest and the potential for a continued uptrend. Traders may view this as a signal to buy or hold.
Bearish Breakout: When the price falls below support, it can signal strong selling interest and the potential for a continued downtrend. Traders might see this as a cue to sell or avoid buying.
MA Ribbon (EMA 20, EMA 50, EMA 100, EMA 200) :
Above EMA: If the stock price is above the EMA, it suggests a potential uptrend or bullish momentum.
Below EMA: If the stock price is below the EMA, it indicates a potential downtrend or bearish momentum.
Trendline: A trendline is a straight line drawn on a chart to represent the general direction of a data point set.
Uptrend Line: Drawn by connecting the lows in an upward trend. Indicates that the price is moving higher over time. Acts as a support level, where prices tend to bounce upward.
Downtrend Line: Drawn by connecting the highs in a downward trend. Indicates that the price is moving lower over time. It acts as a resistance level, where prices tend to drop.
Disclaimer:
I am not a SEBI registered. The information provided here is for learning purposes only and should not be interpreted as financial advice. Consider the broader market context and consult with a qualified financial advisor before making investment decisions.

#NIFTY Intraday Support and Resistance Levels - 10/06/2025Nifty is opening with a gap-up near the 25250 level, approaching a crucial resistance zone. This area has previously acted as a turning point, and today's opening could define whether bulls retain control or face exhaustion.
If Nifty sustains above 25250, we can expect further upside momentum toward 25350, 25400, and 25450+. A clean breakout above this level could open the path to short-term bullish continuation.
However, if the index struggles to hold above 25250 and reverses, profit booking may kick in, pulling the index back toward 25150, 25100, and even 25050.
Holding above 25050–25100 will be key for maintaining a positive structure. A breakdown below this zone may shift sentiment in favor of bears.

Nifty trend directionNifty 25103 has still positive momentum. Yesterday after 14:00 hrs, buyers step in and shown buying interest. FII's have sold 380 contracts. Hence a Close above 25124, We expect Nifty will be moved higher further. Resistance at 25340

#Nifty - DailyDate: 06-06-2025
Nifty -
Pivot Point: 24744.26 Support: 24548.05 Resistance: 24941.19
Upside Targets:
Target 1: 24988.41
Target 2: 25035.64
Target 3: 25144.90
Target 4: 25254.17
Downside Targets:
Target 1: 24500.46
Target 2: 24452.875
Target 3: 24343.6075
Target 4: 24234.34

10 june Nifty50 brekout and Breakdown leval
🔼 Call Option (CE) Buy Levels:
Above 25,030 (Risky Zone)
"10m hold CE by RISKY ZONE"
Above 25,190 (Positive Trade View Zone)
Confirm bullishness and enter CE trades cautiously.
25,270"Above 10m hold CE by zone" – Strong confirmation.
25,390"Above 10m Closing Shot cover Possible" – Higher breakout level.
🔽 Put Option (PE) Buy Levels:
Below 25,030
"Below 10m hold PE by Zone"
Below 25,190
"Below nigetive trade view" – Sentiment turning bearish.
25,270 Below 10m PE by Risky Zone" – Confirmation of downward pressure.
Below 25,390 10m PE By Safe Zone" – Strong PE entry.
✅ Extra Key Zones:
Opening Support: 25,070
Opening Resistance: 25,030
CE Safe Zone: Above 24,970
Below 24,970: Possible unwinding (strong downside)

Nifty Analysis EOD – June 9, 2025 – Monday🟢 Nifty Analysis EOD – June 9, 2025 – Monday 🔴
🎯 Stuck at the Top – Expansion Coming Soon?
Nifty opened with a strong Gap-Up of 127 points at 25,127, landing right at the upper resistance cap. But from the very first candle, it was clear that the market was unsure—price action showed indecision, and the index could barely add another 16 points before hitting the day’s high of 25,143.45.
From there, the index retraced about 66 points, marking a low at 25,077.15, before attempting a gradual recovery toward the high. But that breakout attempt was unsuccessful, and Nifty drifted back to the mean and closed the day at 25,103.20—essentially wrapping the entire session within a tight 65-point range.
Buyers fought hard to defend 25,100, while sellers tried to fill the morning gap. The narrow range and mean reversion hint at consolidation, setting the stage for a possible expansion in the coming sessions. Stay patient—the coil is tightening.
🛡 5 Min Chart with Levels
🕯 Daily Time Frame Chart
🕯 Daily Candle Breakdown
Open: 25,160.10
High: 25,160.10
Low: 25,077.15
Close: 25,103.20
Net Change: +100.15 (+0.40%)
📊 Candle Structure Breakdown
Real Body: 56.90 pts → 🔴 Red candle (Close < Open)
Upper Wick: 0 pts (Open = High)
Lower Wick: 26.05 pts
🔍 Interpretation
Price opened at the high and failed to push any higher – showing no strength above the open.
Despite a positive close versus the previous session, the candle is bearish intraday.
The lower wick shows some support, but not enough to flip the bias.
🔦 Candle Type
🟥 Red Inverted Hammer / Bearish Pin Bar– Typically signals weakness or potential reversal, especially when forming near resistance zones.
📌 Key Insight
The structure shows exhaustion or profit booking.
A move below 25,077 could open the door to further downside.
However, holding above 25,100–25,130 will keep bullish hopes alive.
🛡 5 Min Intraday Chart
⚔️ Gladiator Strategy Update
ATR: 262.59
IB Range: 66.3 → Small IB
Market Structure: imBalanced
Trades:❌ No Trade Triggered by the system
📌 Support & Resistance Zones
Resistance Levels
25,116 ~ 25,128
25,180 ~ 25,212
25,285
Support Levels
25,062 ~ 25,070
24,972
24,920 ~ 24,894
24,800 ~ 24,768
💭 Final Thoughts
Today was a pause, not a pullback—yet.With price compressed in a tight band, volatility expansion is likely ahead.
🧠 “Markets don't stay quiet for long. Silence often precedes a scream—watch which direction the breakout takes.”
✏️ Disclaimer
This is just my personal viewpoint. Always consult your financial advisor before taking any action.

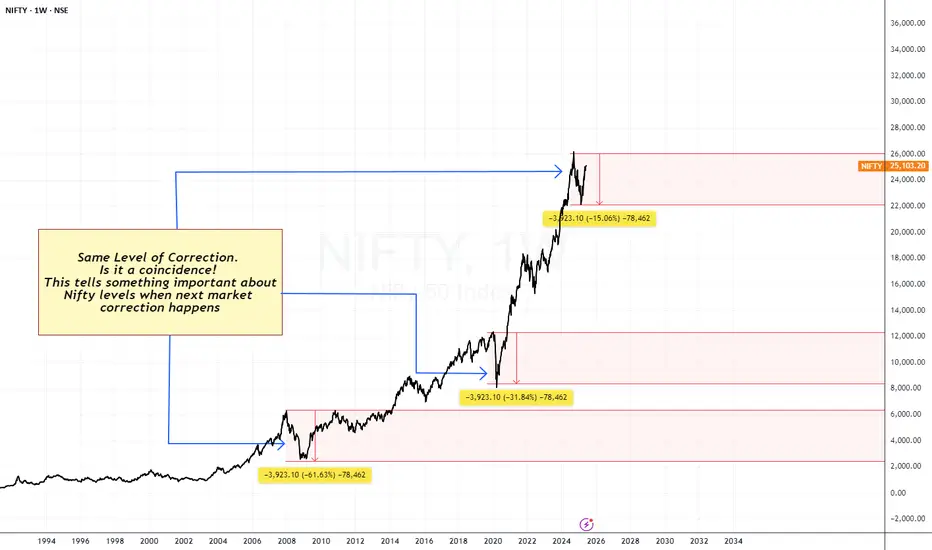
NIFTY PREDICTIONThis could play a crucial role in planning strategic entries and understanding when heavy accumulation is likely to begin.
Nifty levels - Jun 10, 2025Nifty support and resistance levels are valuable tools for making informed trading decisions, specifically when combined with the analysis of 5-minute timeframe candlesticks and VWAP. By closely monitoring these levels and observing the price movements within this timeframe, traders can enhance the accuracy of their entry and exit points. It is important to bear in mind that support and resistance levels are not fixed, and they can change over time as market conditions evolve.
The dashed lines on the chart indicate the reaction levels, serving as additional points of significance to consider. Furthermore, take note of the response at the levels of the High, Low, and Close values from the day prior.
We hope you find this information beneficial in your trading endeavors.
* If you found the idea appealing, kindly tap the Boost icon located below the chart. We encourage you to share your thoughts and comments regarding it.
Wishing you success in your trading activities!

Nifty Daily Trend AnaysisMy Observation:
Nifty Spot had been consolidating within a range for 16 consecutive trading sessions. Today, it broke out decisively and is now trading above that range. If it sustains this breakout, it indicates bullish momentum and the index could potentially rally towards the targets of 25,800 and 26,500.
However, if the market slips back into the previous range, I anticipate support around 24,600—although this scenario seems less likely given the strength of today’s breakout.
Disclaimer: This is purely my personal view and is shared for educational purposes only. Please do your own analysis before making any trading decisions.

#nifty - 1 hour time frameAll these arrows show strong buyer reactions from support zones (mostly around 24,430–24,590).
The chart indicates a bullish bias at lower levels, but the price is still struggling to break the falling channel trendline (which acts as resistance).
A break above the purple line (24,760) and the upper trendline would confirm a trend reversal or breakout.
NSE:NIFTY
Only for educational purposes.
This content is not a recommendation to buy and sell.
Not SEBI REGISTRAR.
@Tradeforecast
#NIFTY #BANKNIFTY #SENSEX #STOCKMARKET

Nifty Gave Breakaway Gap Strong Bullish SignalWhat is Breakaway GAP?
A breakaway gap refers to the situation in the market where there is a strong price movement that crosses support or resistance. Breakaway gaps are formed after substantial periods of consolidation of prices in the market. It signifies a break from the previous trading range or pattern, and it suggests that a new trend or direction is emerging.
Nifty was trading in a range for 5 days and today 6/09/2025 it gap up and sustained above 25000 crucial level, the importance of break-away gap is that it's very strong sign of bullishness in market this also strong support too so if nifty come to retrace it would become support around 25000 level,
if nifty break today opening rang then it's very likely that it will go further so there are possibly Two entry Sign for Long: - first, OR breakout, second: -retracement on 15 Min chart near 20 Ema -50 Ema. Thats My opinion

#NIFTY Intraday Support and Resistance Levels - 09/06/2025Nifty is opening with a gap-up above the 25050 level, continuing the recent bullish momentum. The index has broken out of its previous range and is now hovering near a key breakout zone.
If Nifty sustains above 25050–25100, we could see further upside toward 25150, 25200, and 25250+. A clean breakout above 25250 may unlock extended targets at 25350, 25400, and 25450+.
However, if the index fails to hold above 25000 and slips back below 24950, it could lead to a short-term pullback. In that case, expect downside toward 24850, 24800, and 24750.
