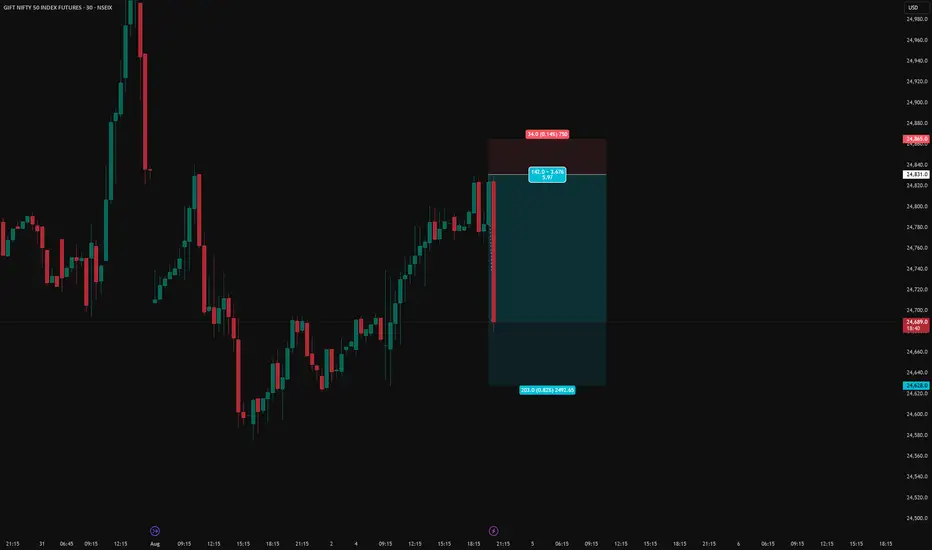
GIFT NIFTY long setupGift NIFTY long setup
Entry price - 24425.5
Stop loss - 24375
Target - 24912
Risk Reward - 1:9.6
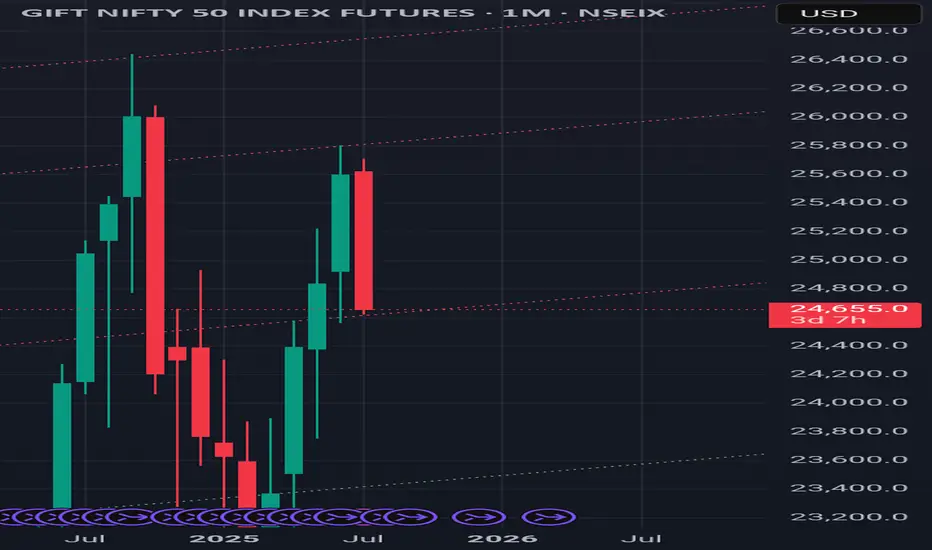
NIFTYV2025 trade ideas
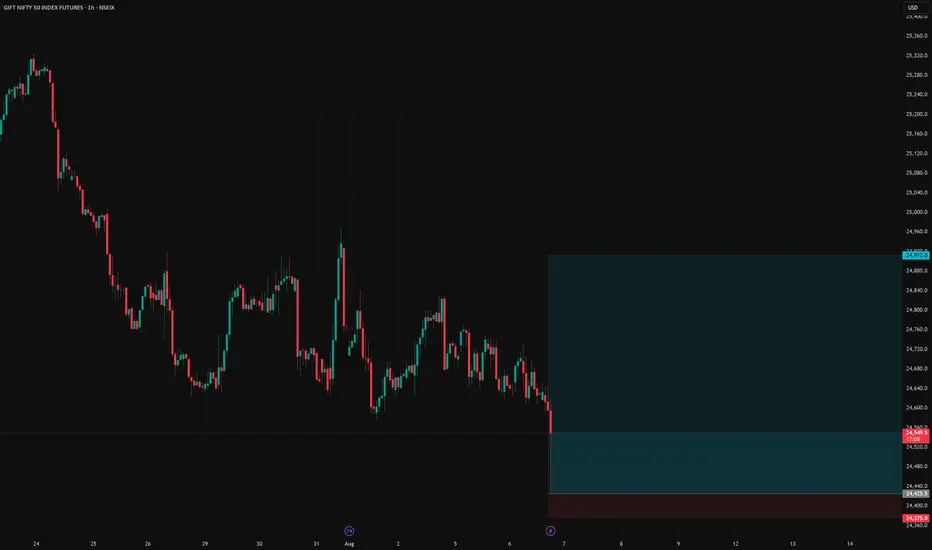
GIFT NIFTY short setupGIFT NIFTY short setup
Entry - 24831
SL - 24865
Target - 24628.0
Risk Reward - Approx 1:6
Intraday set up for 7th August 2025 Nifty future and banknifty future analysis and intraday plan.
Quarterly results.
This video is for information/education purpose only. you are 100% responsible for any actions you take by reading/viewing this post.
please consult your financial advisor before taking any action.
----Vinaykumar hiremath, CMT


"Nifty # Stock Market # Bullish View""Nifty’s bearish move looks like a time correction — gearing up for a powerful rally towards 27,000! 📈🚀 #Nifty #StockMarket #BullishView"
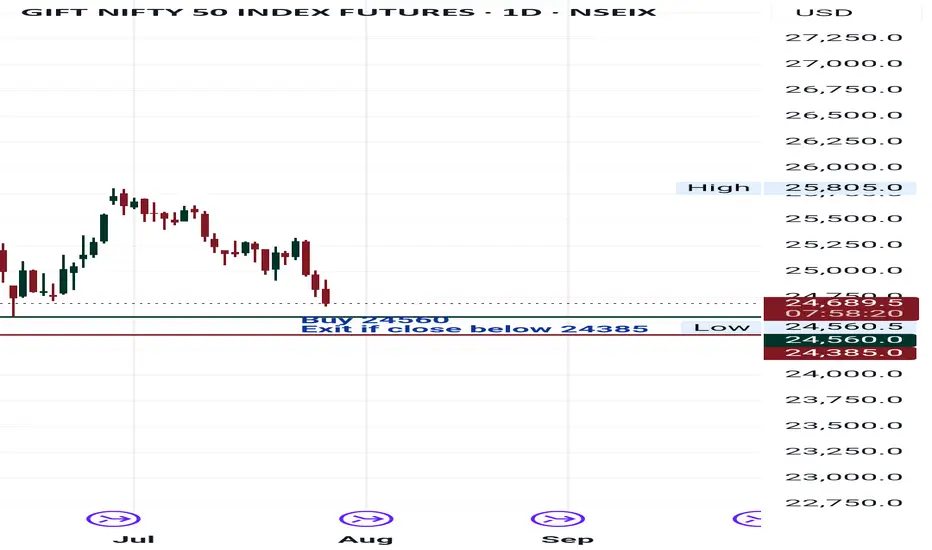
Buy gift nifty at support levelBuy at 24560 (many times support range), calculation point also with wave pattern.
Try to exit, if close below 24385.
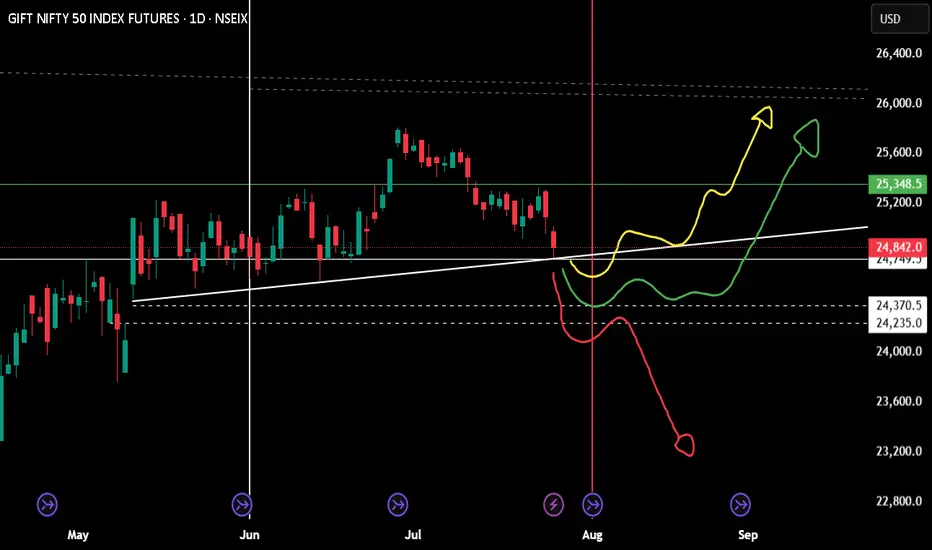
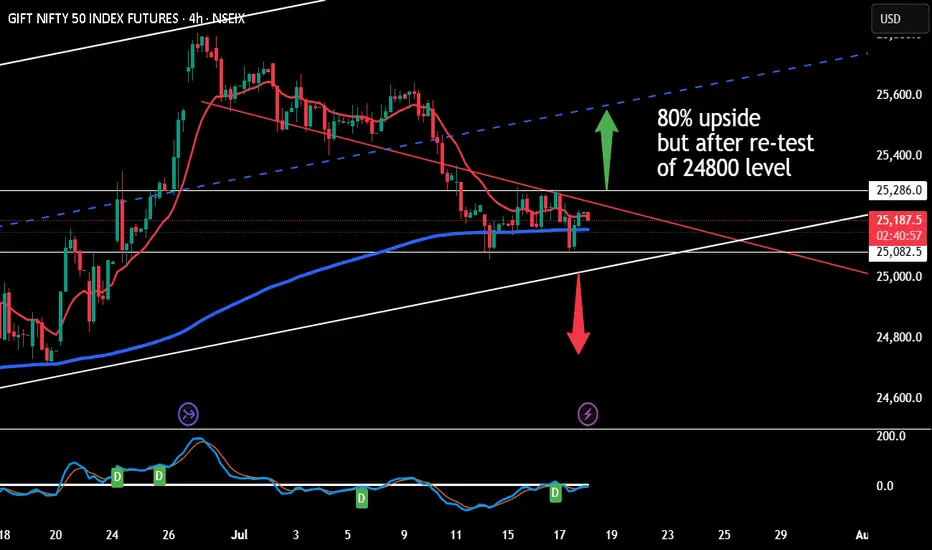
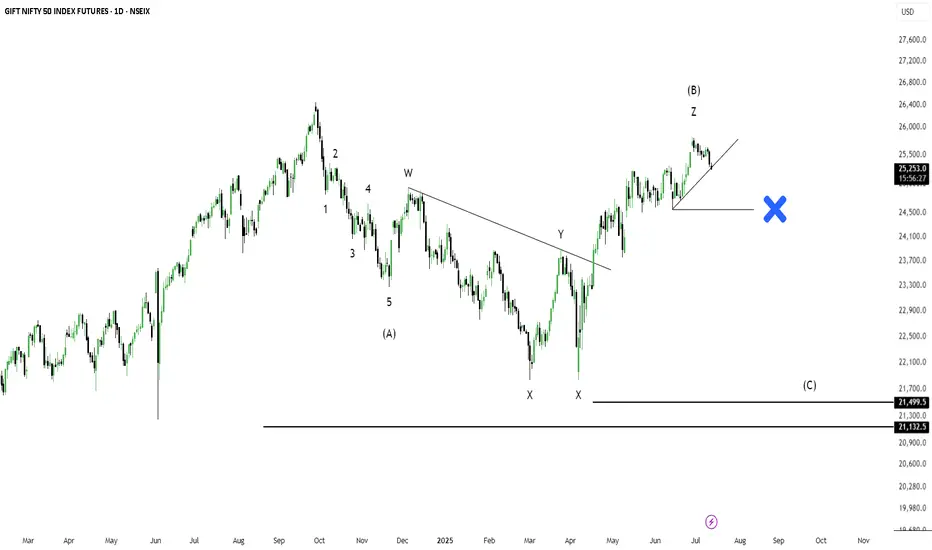
I think it's today.I admit that today's Nifty surpassed below yesterday's 24800 level, and my rash assumption that this level would act as a strong reversal support was wrong. But my overall opinion hasn't changed: there's a good chance the market will correct this whole wave 1 decline if the GIFT Nifty support level of 25620 isn't broken by tomorrow.
Monthly position for niftyExpecting a reversal, yes geo political and 1st August announcement will play a major role.
just wait for one day candle closing on your area.
If you wish to be on buying side (buy nifty future) a positive candle on top of the trend line.
Selling future for the month is only wise if 24k is crossed. Technically a bounce is expected and hopefully a green candle for August month.
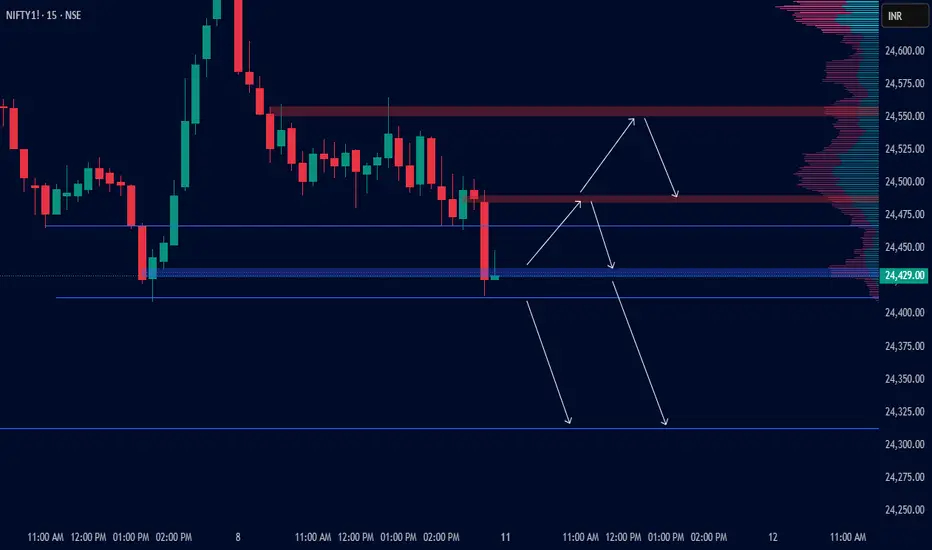
Intraday Plan for Monday 11 AugustTrade Plan – NIFTY FUTURE 15-Min Chart
Current Context:
Price is trading near a key demand/support zone around 24,400 -24,420. (blue zone)
There’s visible selling pressure from the recent swing high, but we’re at an important decision area where a bounce or breakdown can occur.
Volume profile shows high activity near 24,500 and 24,440 zones.
Possible Scenarios:
Bullish Scenario (Reversal / Pullback Play)
If price holds above 24,420 and shows strong bullish candles, look for a pullback entry toward 24,440.
First target: 24,480 supply zone
Second target: 24,500–24,520 high volume node / strong resistance
Watch for rejection at these levels for profit booking.
Alternate Bullish Continuation
If price quickly reclaims 24,480 supply zone with momentum, expect a rally toward 24,520–24,560.
This would require strong buying interest.
Bearish Scenario (Breakdown Play)
If price breaks below 24,400/420 with strong volume, expect a continuation toward 24,380, then 24,340–24,320.
Look for short entries on pullbacks to broken support.
Key Levels
Support: 24,420 → 24,380 → 24,340–24,320
Resistance: 24,440 → 24,480 → 24,500–24,520
Scenarios
Bullish Bounce – Hold above 24,420 → Target 24,480 / 24,520
Bearish Breakdown – Break below 24,420 → Target 24,380 / 24,340 / 24,320
Strong Bullish Continuation – Break & sustain above 24,480 → Target 24,520–24,560
Disclaimer:
This trade plan is for educational purposes only and does not constitute financial or investment advice. Trading in the stock market involves substantial risk, including the risk of loss. Always conduct your own research and consult with a qualified financial advisor before making trading decisions. You are solely responsible for your own trades and risk management.
GIFT NIFTY @ 24683 ANALYSIS 04-AUG-2025: BIGGER PICTURESupports: 24577/24421/24234
Resistances: 24970/25325/24639/24800
As long as the above support levels hold, we can see big bull run towards 27500 first.
Targets: 25855, 26655, 27577
27934-28770
29234
30000-30500-31350
On the downside, if break 24421/24234, we can see 23800, 23355, 23000.

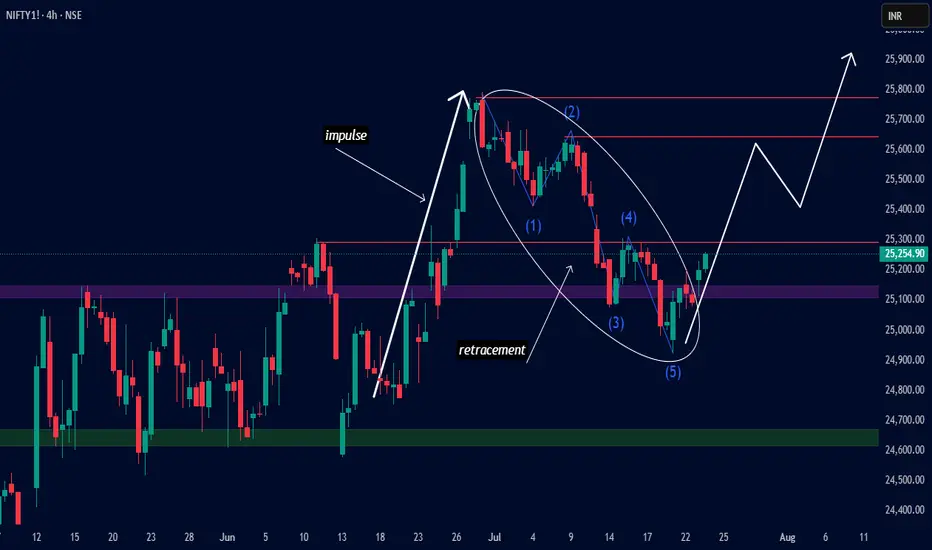
NIFTY 4H – Impulse & Retracement Complete | Bullish Move Ahead?Hello friends this is nifty futures chart
The recent 5-wave corrective structure (Elliott Wave) seems to have completed near the Flip Zone, with Wave (5) marking a potential bullish reversal point.
Key Observations:
Strong impulse move followed by a 5-wave retracement
Price reversed from previous accumulation zone
Structure suggests a potential bullish continuation
Targeting zone near 25,800–25,900
Let’s see if the bulls can take control from here! 🐂
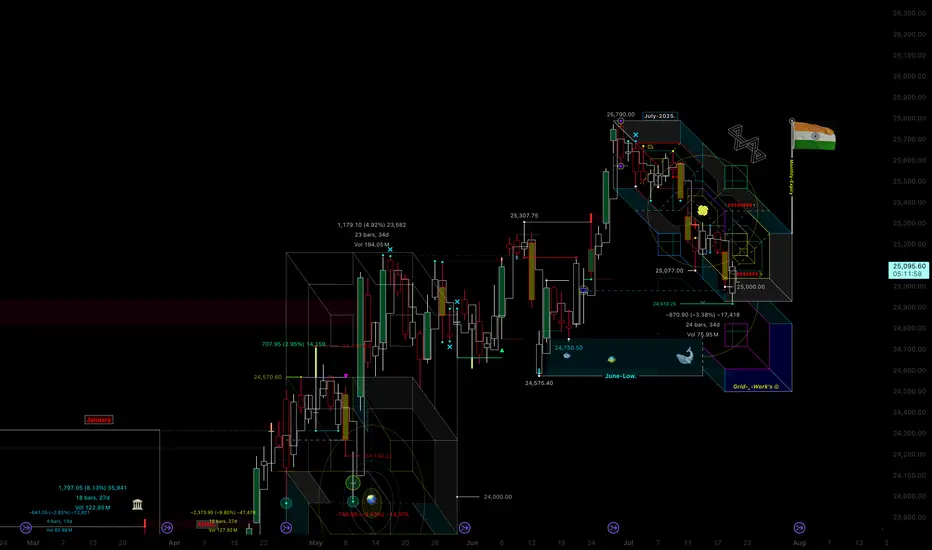
Monthly Projection & structures for Nifty Daily chart Hi Everyone !
Welcome to monthly projection for nifty Fut.
this is an example how we can come up with this kind of box, where it gives you the
levels and shows you the angle and also is shows you where the big stop zones are
and how we cam time the market for various kinds of trades
also it shows you the gaps/imbalances/speed zones/cave fill/repair zones and so on.....
Directional, non-directional -spreads-intraday/longterm
also this technology not only shows you where market is going
but it also shows you how it will go there so you can time it with various
execution strategies
hope you like it
power to the people !
Grid-_-Work's
This is idea for positional trading in niftyBased on a confluence of Technical Analysis, Gann theory, and Astro-cycle studies, the market continues to experience downside pressure. This phase is likely a volume accumulation zone, which could set the stage for a stronger uptrend in the coming weeks.
The current bearish undertone is expected to gradually shift, with potential positive momentum emerging around August 5, 2025.
Scenario 1: Buy on Dip (Accumulation Zone)
Entry: Buy Nifty Futures in the 24,850 – 24,900 range
Stop Loss: 50 points
Target: 25,200 – 25,800
Note: This setup is valid only if the price retraces to this support zone, or halt before breaking out above 25,300.
Scenario 2: Breakout Buy
Entry: Buy Nifty Futures above 25,300
Stop Loss: 30 points
Target: 25,800
Note: This is a momentum-based entry upon confirmed breakout.
Nifty on high alert Due next crypto run, and crypto ETF anounce by Donald Trump. It's been clear that it's possible hedge funds may see oppertunity in crypto rather than indices stocks.
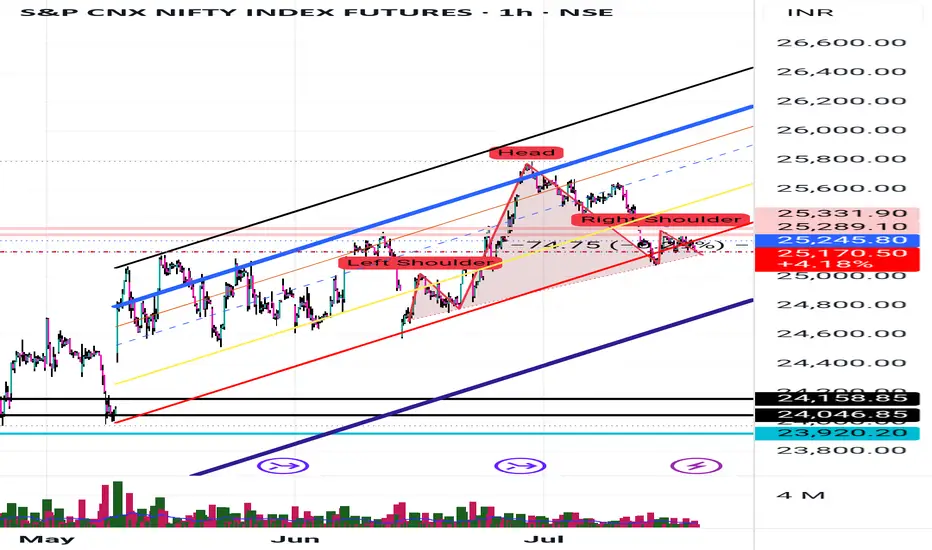
A clear formation of Head and Shoulder
On hourly chart.
16th-July-Wed-Nifty Projection and grid system Hello Everyone
This is the projection for 16th-Wed Grid System
depending on the price action we see that market has opened and is bearish range
will be interesting to see where the close will be for the day
Grid-_-Work's
thank you for your time

Nifty 15th-July-Trend day projection Hello everyone !!!
This is the geometric projection and price action with marked up chart for nifty
trend day
Grid-_-Work's production ©
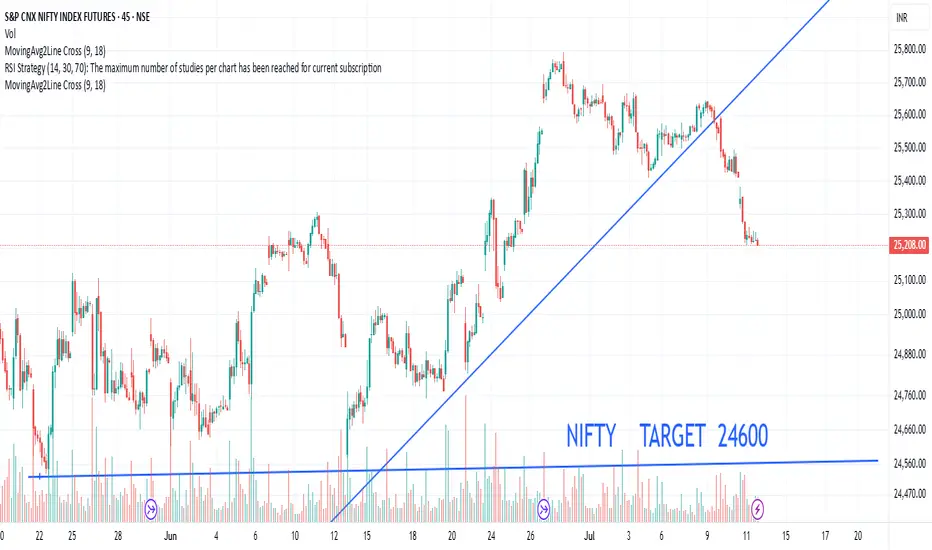
NIFTY TARGET 24600 NIFTY 50's Current Status and Short-Term Outlook (as of July 11, 2025)
As of its last close on July 11, 2025, the NIFTY 50 index concluded at 25,149.85. The index is currently exhibiting a bearish trend in the short term, having closed below its 20-day moving average (20-DMA). This breach suggests potential further downside, with immediate support levels identified around 25,000, followed by 24,900. Conversely, immediate resistance is anticipated in the 25,300–25,350 range.
Factors Influencing NIFTY 50's Recent Performance
The recent decline in NIFTY 50's performance can be attributed to a combination of factors:
Weakness in IT and Auto Sectors: Notably, the IT and auto sectors have experienced significant declines. This downturn was partly triggered by disappointing Q1FY26 earnings from TCS, which dampened investor sentiment.
Global Market Sentiment: Global cues have been mixed, with US markets showing strength while Asian markets exhibit a more cautious trend. This divergence, coupled with ongoing geopolitical uncertainties, has contributed to market volatility.
Trade Deal Jitters: Uncertainty surrounding the India-US trade deal and the potential impact of new tariffs announced by the US have also weighed on investor sentiment.
Expert Predictions and Targets for NIFTY 50
Several experts have weighed in on NIFTY 50's potential trajectory:
Short-Term Bearish Outlook: Many experts anticipate continued weakness in the short term, with potential downside targets around 25,000 and 24,900.
August Target of 25,800: Despite the current bearish trend, some experts, like I-Sec's Dharmesh Shah, maintain a positive outlook, expecting the index to reach 25,800 in August.
Long-Term Bullish Scenario: Looking further ahead, JPMorgan projects a potential bull case scenario where NIFTY 50 could reach 30,000 by April 2026, driven by an anticipated earnings boost.
gift nifty new report After successful down fall in gift nifty, we can full profit book and also fresh buy at support point 25150, with exit , if close below 25000. Also try to exit, if continues run lose below 25118 only.

gift nifty analysis on price actionNSEIX:NIFTY1!
Please find all over all analysis details on chart clearly.

NIFTY Eyes 25,410: Setup in ActionIn this update, I’m revisiting the setup I shared earlier that points towards NIFTY’s next potential target at 25,410. The analysis covers the key levels, price action structure, and the factors supporting this move. This setup is based on clear technical confirmations and disciplined risk management — not just speculation.
Please remember to follow your own plan and manage your trades responsibly. This is for educational purposes and not financial advice. Let’s see how the price action unfolds!

Review and plan for 9th July 2025Nifty future and banknifty future analysis and intraday plan.
This video is for information/education purpose only. you are 100% responsible for any actions you take by reading/viewing this post.
please consult your financial advisor before taking any action.
----Vinaykumar hiremath, CMT

Nifty master chartlong back i post ,aster chart
Insitutation level more pannic for every level .but they reached Goal market now trending
