NIFTYNIFTY closed above va
1. gapup 19850 can long till 19920
2. 19850-19800 trade breakout
3. gapdown 19750 look for longs shorts only below19680
NIFTY1! trade ideas
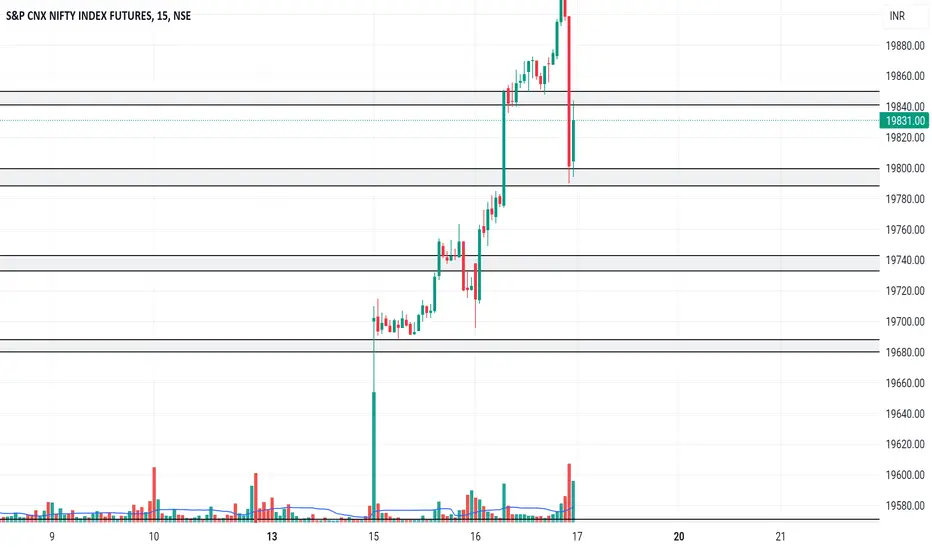
Day Trader’s Post Market Analysis - Nifty BankNifty-16th Nov ’23Below mentioned points are discussed in my post analysis video(Fast forward to 0:52 for Hindi Audio)
-No Trades in the morning
-Sold Nifty near yesterday high and sl was hit
-19750-19770 in nifty future is a good level to watch
-How will i trade when market opens tom

Day Trader’s Post Market Analysis - Nifty BankNifty-15th Nov ’23Below mentioned points are discussed in my post analysis video(Fast forward to 0:40 for Hindi Audio)
-No Trades in the morning
-A 1% gap up in Nifty wasn't expected.
-Target was a break above 19700 in Nifty Spot, but it was sideways.
-How will i trade when market opens tom

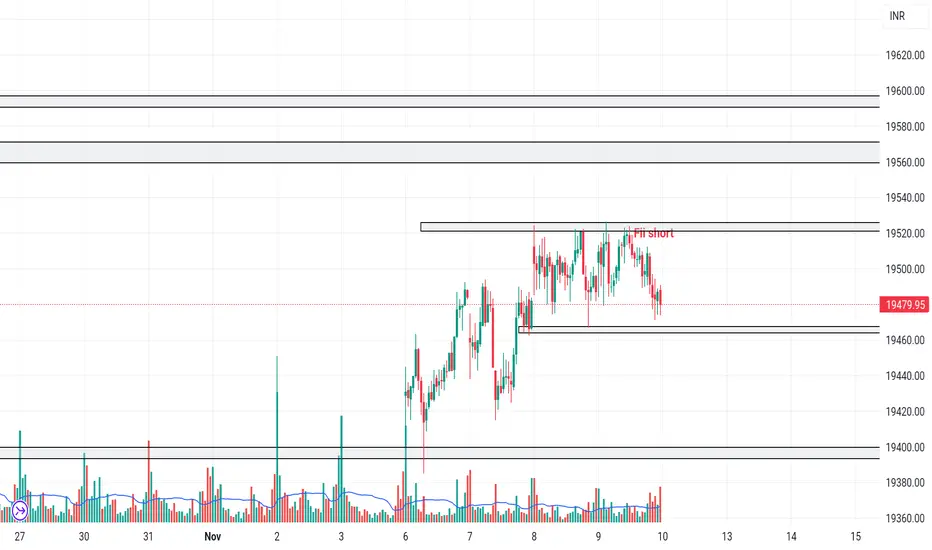
Nifty short below 19540Nifty below 19580,good for short as this level on a daily timeframe is@50% fibbo resistance.
Near sell side tgt 19375-19175.
On d upside above 19540,tgt 19700-19930.

NIFTYNIFTY closed inside va
1. gapup 19530 longh till 19600
2. 19530-19480 trade breakout
3. gapdown 19480 short till 19400

Day Trader’s Post Market Analysis - Nifty BankNifty-13th Nov ’23Below mentioned points are discussed in my post analysis video(Fast forward to 1:01 for Hindi Audio)
-No Trades in the morning
-Broing Day For Nifty Traders
-Shorted Nifty at VWAP; could have gone long on BankNifty instead.
-How will i trade when market opens tom

Day Trader’s Post Market Analysis - Nifty BankNifty-10th Nov ’23Below mentioned points are discussed in my post analysis video(Fast forward to 0:50 for Hindi Audio)
-No Trades in the morning
-In Nifty Did not get a follow up on gap down
-Trailing Sl in Nifty Saved me from the up move in the last 1 hour
-How will i trade when market opens on Monday

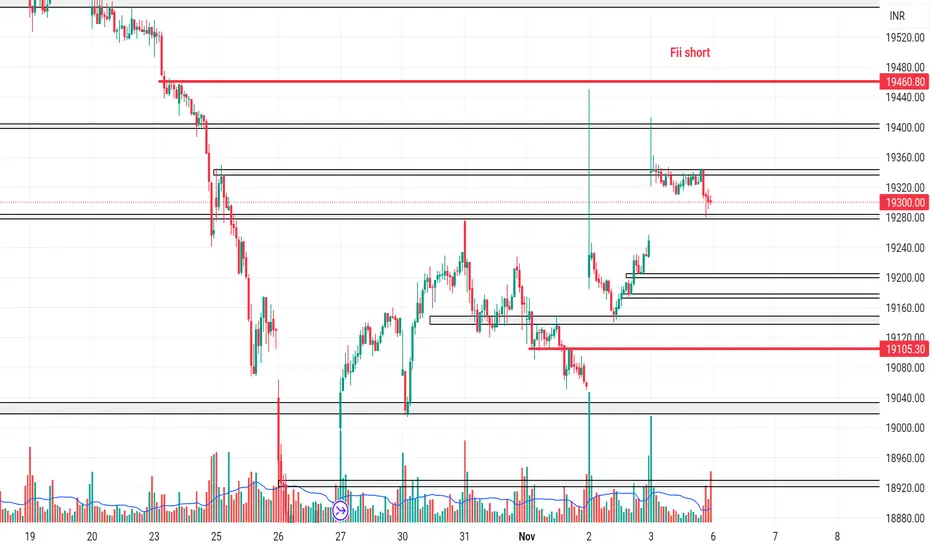
Nifty Trend#Nifty f Friday Trigger/Stop 19530.
Today can be day 1 of this short term downtrend.
There is moderate possibility of testing/breaking 26 Oct low.

NIFTYNIFTY closed inside va
1. gapup 19530 long till 19550
2. 19530-19470 trade breakout
3. gapdown 19470 short till 19425
Day Trader’s Post Market Analysis - Nifty BankNifty-9th Nov ’23Below mentioned points are discussed in my post analysis video(Fast forward to 0:30 for Hindi Audio)
-No Trades in the morning
-No Moves in either side
-Nifty Breaking day low in first half after 10 would be a good shorting opp.
-How will i trade when market opens tom

NIFTYNIFTY closed inside va
1. gapup 19520 long till 19560
2. 19520-19460 trade breakout
3. gapdown 19460 short till 19400

Day Trader’s Post Market Analysis - Nifty BankNifty-8th Nov ’23Below mentioned points are discussed in my post analysis video(Fast forward to 0:45 for Hindi Audio)
-No Trades in the morning
-Sideways day with both sell and buy opp.
-Hey Nifty, can we fill Monday's Gap?- My Positional PE's
-How will i trade when market opens tom

NIFTYNIFTY closed above va
1. gapup 19500 can long till 19550
2. 19500-19450 trade breakout
3. 19450 short till 19420-19400

Niftyc1On the daily chart, if pull back is to continue then must rise and close above 19500.
Currently in pullback mode of the fall from the fall from lower to 19884 to 18884.

Nifty hourly chartCurrently in retracement mode as shown in chart.
Can test retracement.
Hourly chart exiting overbought zone on RSI
Macd trigger it's average
Upside can continue above 19500
23.6% and 38.6%
Retracement as shown in chart

NIFTYNIFTY closed above va
1. gapup 19500 long till 19540
2. 19480-19440 trade breakout
3. gap down 19440 short till 19400

Day Trader’s Post Market Analysis - Nifty BankNifty-6th Nov ’23Below mentioned points are discussed in my post analysis video(Fast forward to 0:36 for Hindi Audio)
-No Trades in the morning
-Poor Volumes in both Nifty & Banknifty
-Was Looking for Scalp Buys Above Day High in Nifty After 12
-How will i trade when market opens tom

Nifty Volume highest at the bottom. The high of volume bar is crossed for swing bottom.
Resistances are being crossed. Expect next resistance to be tested.
Retracement 61.8% is likely 19600 to 19800

NIFTYNIFTY closed below va
1. gapup 19350 long till 19400
2. 19350-19280 trade breakout
3. gap down 19280 short 19200
NIFTYNIFTY closed above va
1. gapup 19250 can long till 19350
2. 19250-19200 trade breakout
3. gapdown 19180 look for longs

Day Trader’s Post Market Analysis - Nifty BankNifty-2nd Nov ’23Below mentioned points are discussed in my post analysis video(Fast forward to 0:33 for Hindi Audio)
-No Trades in the morning
-Tricky structures bec of Futures High Formed at open
-Bought Nifty above 19200 After 12 But my trail sl was hit
-How will i trade when market opens tom


NIFTYNIFTY closed below va
1. gapup 19100 can long till 19180-19250
2. 19100-19000 trade breakout
3. gap down 19000 short till 18900
