NIFTY SMALLCAP250 - LONG SET-UP (2025-26 Target)NSE:NIFTYSMLCAP250
📊𝐂𝐡𝐚𝐫𝐭 𝐀𝐧𝐚𝐥𝐲𝐬𝐢𝐬 – 𝐍𝐢𝐟𝐭𝐲 𝐒𝐦𝐚𝐥𝐥𝐂𝐚𝐩 𝟐𝟓𝟎 (𝐌𝐨𝐧𝐭𝐡𝐥𝐲 𝐓𝐅)
The index is approaching a crucial resistance zone between 20,045 – 20,795, projected to be tested around 2025–26. This area aligns with the previous bullish expansion's Fibonacci extension and also shows a 21.13% upside move from current levels—highlighting a final exhaustion zone before a potential reversal
The marked red zone (similar to the 2021-22 range) suggests a possible distribution phase or topping structure. If price faces rejection there, a corrective wave could follow—targeting the 14,450 level, which coincides with the trendline retest and a high-volume area
𝐊𝐞𝐲 𝐒𝐮𝐩𝐩𝐨𝐫𝐭 𝐙𝐨𝐧𝐞𝐬:
14,450 – Trendline + structure confluence
13,292.60 – Prior base and horizontal support
10,495.85 – Major long-term demand zone
💡 𝐄𝐱𝐭𝐫𝐚 𝐈𝐧𝐬𝐢𝐠𝐡𝐭𝐬
You’ve rightly anticipated a multi-leg rally followed by correction—smart play on cycles and exhaustion
Watch for volume divergence or momentum slowdown (RSI, MACD) near the 20.8K mark as confirmation
This wave could be the last leg (Wave 5) in Elliott structure, after which a larger ABC correction is possible
If 14,450 breaks, it could trigger a steeper correction—possibly toward the 10.5K demand zone, offering long-term entries
NIFTYSMLCAP250 trade ideas

nifty smallcap index............expect good upmove from todaynifty smallcap index.....
is at confluence support of...
1.green horizontal support line
2. green trend line
3.50% fib.level
expect good up move starting today

Weekly Analysis 29th Dec 2024 | Nifty | Bank Nifty Weekly Analysis 29th Dec 2024 | Nifty | Bank Nifty | Nifty Midcap | Nifty Smallcap


possible Head & shoulder patternthere is a possibility that nifty smallcap 250 can for a head and shoulder pattern here, which can bring it down by total of 11%, and 7.7% after the formation gets completed. It is very likely that the market will not complete this pattern, but just for awareness and availability of different perspective I wanted to post about it.
also, please do not take any decisions too quickly based on this as patterns are for very short term but in the long term I'm still very bullish on the midcap and smallcap index.

niftysmallcapAs you can see, whenever the Nifty Smallcap Index has come near the 50 EMA, we have seen a buying opportunity. This is a crucial level

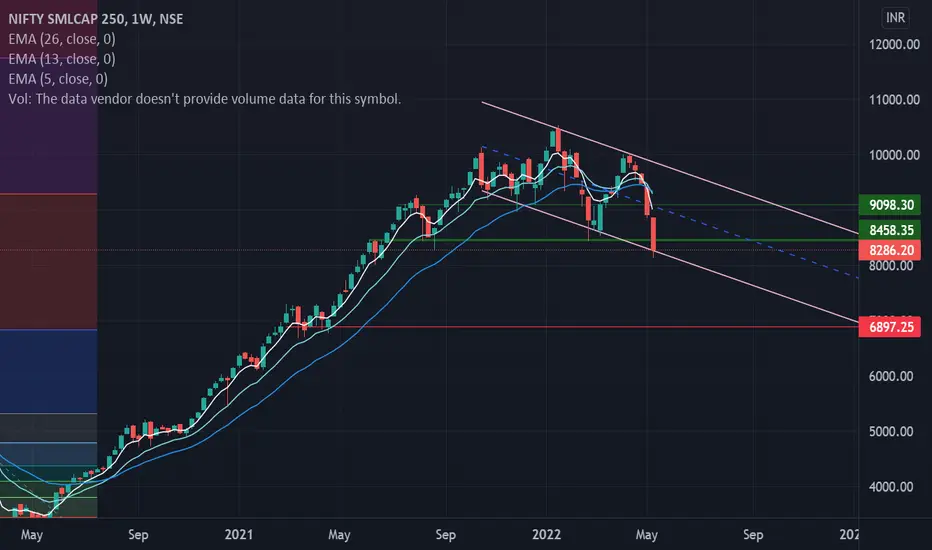
NiftySmall Cap 250I personally find this chart very interesting.
Once 9100 crosses i expect small caps 250 to do well.
Looks like this year is for them.

Mindful of NIFTY Small Cap!Nifty has around 50 stocks, Nifty Mid cap has around 150-200 stocks and rest are Nifty small cap. Nifty small cap consists of 90% stock in Indian stock market. As per the weekly price pattern, small cap index has strong support at 8500 and it is broken this week. This chart pattern is confusing me as one way we can see a downward slopping parallel channel . But on the other hand, we can see a breakdown of head and shoulder trend reversal pattern too. If we make a strong red candle next week and breach the channel then be very cautious and put a strict stop losses to your portfolio. Head and shoulder breakdown on weekly chart suggests we can go in medium term down trend ( may be for couple of years). This will bleed your capital. In stock market up or down trends are common but for investor saving the capital is utmost priority. We will once again review this position next weekend.
NIFTY SMALL CAP - MAKE OR BREAKSince long we have been observing that the small and madcap indices were outperforming the large caps. This trend seems to be showing a reversal.
Nifty Small Cap 250 Index is approaching its support ...lets see if this breaks or holds.


IndexLooks tooo weak no support for nifty small cap 250. Compared to nifty its fall is milder. For me to get back to full position in stocks want to see some strength, before i go long again

smallcap 250 have little fuel try to hit 5500 level in coming dasmallcap 250 have little fuel try to hit 5500 level in coming day.
