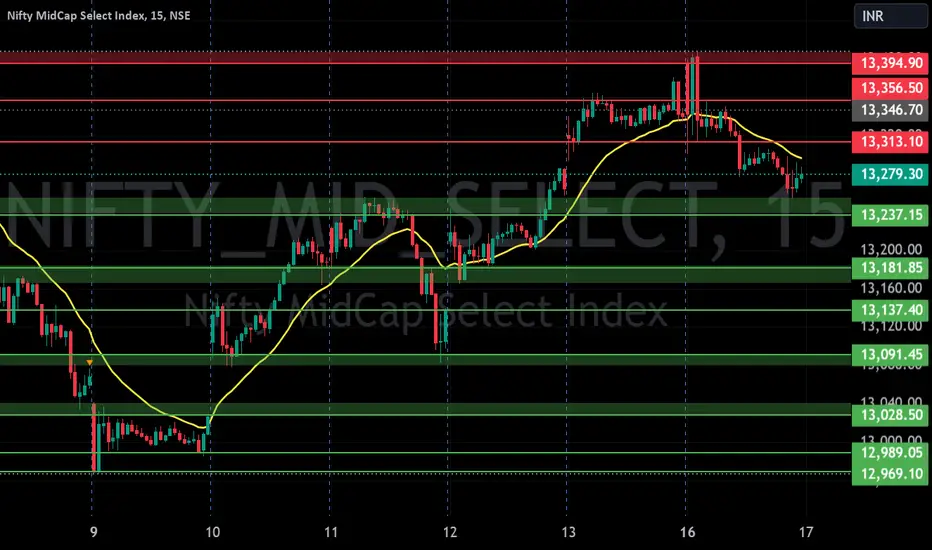
MIDCAP NIFTY S/R for 17/9/24Support and Resistance Levels:
Support Levels: These are price points (green line/shade) where a downward trend may be halted due to a concentration of buying interest. Imagine them as a safety net where buyers step in, preventing further decline.
Resistance Levels: Conversely, resistance levels (red line/shade) are where upward trends might stall due to increased selling interest. They act like a ceiling where sellers come in to push prices down.
Breakouts:
Bullish Breakout: When the price moves above resistance, it often indicates strong buying interest and the potential for a continued uptrend. Traders may view this as a signal to buy or hold.
Bearish Breakout: When the price falls below support, it can signal strong selling interest and the potential for a continued downtrend. Traders might see this as a cue to sell or avoid buying.
20 EMA (Exponential Moving Average):
Above 20 EMA: If the stock price is above the 20 EMA, it suggests a potential uptrend or bullish momentum.
Below 20 EMA: If the stock price is below the 20 EMA, it indicates a potential downtrend or bearish momentum.
Trendline: A trendline is a straight line drawn on a chart to represent the general direction of a data point set.
Uptrend Line: Drawn by connecting the lows in an upward trend. Indicates that the price is moving higher over time. Acts as a support level, where prices tend to bounce upward.
Downtrend Line: Drawn by connecting the highs in a downward trend. Indicates that the price is moving lower over time. It acts as a resistance level, where prices tend to drop.
RSI: RSI readings greater than the 70 level are overbought territory, and RSI readings lower than the 30 level are considered oversold territory.
Combining RSI with Support and Resistance:
Support Level: This is a price level where a stock tends to find buying interest, preventing it from falling further. If RSI is showing an oversold condition (below 30) and the price is near or at a strong support level, it could be a good buy signal.
Resistance Level: This is a price level where a stock tends to find selling interest, preventing it from rising further. If RSI is showing an overbought condition (above 70) and the price is near or at a strong resistance level, it could be a signal to sell or short the asset.
Disclaimer:
I am not a SEBI registered. The information provided here is for learning purposes only and should not be interpreted as financial advice. Consider the broader market context and consult with a qualified financial advisor before making investment decisions.
NIFTY_MID_SELECT trade ideas
MIDCAP NIFTY S/R for 9/9/24Support and Resistance Levels:
Support Levels: These are price points (green line/shade) where a downward trend may be halted due to a concentration of buying interest. Imagine them as a safety net where buyers step in, preventing further decline.
Resistance Levels: Conversely, resistance levels (red line/shade) are where upward trends might stall due to increased selling interest. They act like a ceiling where sellers come in to push prices down.
Breakouts:
Bullish Breakout: When the price moves above resistance, it often indicates strong buying interest and the potential for a continued uptrend. Traders may view this as a signal to buy or hold.
Bearish Breakout: When the price falls below support, it can signal strong selling interest and the potential for a continued downtrend. Traders might see this as a cue to sell or avoid buying.
20 EMA (Exponential Moving Average):
Above 20 EMA: If the stock price is above the 20 EMA, it suggests a potential uptrend or bullish momentum.
Below 20 EMA: If the stock price is below the 20 EMA, it indicates a potential downtrend or bearish momentum.
Trendline: A trendline is a straight line drawn on a chart to represent the general direction of a data point set.
Uptrend Line: Drawn by connecting the lows in an upward trend. Indicates that the price is moving higher over time. Acts as a support level, where prices tend to bounce upward.
Downtrend Line: Drawn by connecting the highs in a downward trend. Indicates that the price is moving lower over time. It acts as a resistance level, where prices tend to drop.
RSI: RSI readings greater than the 70 level are overbought territory, and RSI readings lower than the 30 level are considered oversold territory.
Combining RSI with Support and Resistance:
Support Level: This is a price level where a stock tends to find buying interest, preventing it from falling further. If RSI is showing an oversold condition (below 30) and the price is near or at a strong support level, it could be a good buy signal.
Resistance Level: This is a price level where a stock tends to find selling interest, preventing it from rising further. If RSI is showing an overbought condition (above 70) and the price is near or at a strong resistance level, it could be a signal to sell or short the asset.
Disclaimer:
I am not a SEBI registered. The information provided here is for learning purposes only and should not be interpreted as financial advice. Consider the broader market context and consult with a qualified financial advisor before making investment decisions.

Midcap Nifty Select Analysis for 09-09-2024: S&R LevelsOn September 6, 2024, the Nifty Midcap Select index opened at 13,263.85, reached a high of 13,274.90, and dropped to a low of 13,033.45 before closing at 13,066.05, representing a 1.59% decline. The market experienced notable volatility throughout the session, with the index losing over 200 points. This decline reflects broader market sentiment, as mid-cap stocks faced pressure across several
Top Gainers and Losers:
PI Industries: Opened at ₹4,513 and gained 2.29%.
Coforge: Opened at ₹6,555 and gained 1.12%.
Ashok Leyland: Opened at ₹251, fell 1.33% to ₹247.8.
Bharat Forge: Opened at ₹1,588, dropped 3.59% to ₹1,551.2
Support and Resistance Levels:
Support Levels: put writing is observed at the 13,000 level, indicating a strong support zone, suggesting a likely range of 13,000-13,200.
Resistance Levels: OI (Open Interest) analysis shows maximum call writing at the 13,200 strike, establishing it as a significant resistance.
Technical Data Points:
Max Pain: 13,100
PCR (Put-Call Ratio): 0.66 Bearish
IV (Implied Volatility): 13.94 as of the closing on 06-09-2024.
Technical Indicators for Mid Cap Nifty Select:
RSI: The index has an RSI of 40, signaling it's nearing oversold territory.
MACD: The MACD shows a bearish trend with the signal line crossing above, suggesting further downside momentum.
Pivot Points: Immediate support lies at 13,000, while resistance stands at 13,200
Gann Prediction:
Using Gann Theory, there is a potential reversal point around 13,030, which aligns closely with the support level, offering a chance for a short-term bounce if this level holds.
Disclosure: The publisher of this idea is not a SEBI registered analyst. The information shared here is solely for educational purposes and should not be interpreted as financial advice. Always consult with a qualified financial advisor before making any investment decisions. The publisher does not endorse social media shares on any platform.

MIDCAP ShortNSE:NIFTY_MID_SELECT
Global concerns of growth slowdown giving short bias, small trade to capitalise on such news

MIDCAP S/R for 4/9/24Support and Resistance Levels:
Support Levels: These are price points (green line/shade) where a downward trend may be halted due to a concentration of buying interest. Imagine them as a safety net where buyers step in, preventing further decline.
Resistance Levels: Conversely, resistance levels (red line/shade) are where upward trends might stall due to increased selling interest. They act like a ceiling where sellers come in to push prices down.
Breakouts:
Bullish Breakout: When the price moves above resistance, it often indicates strong buying interest and the potential for a continued uptrend. Traders may view this as a signal to buy or hold.
Bearish Breakout: When the price falls below support, it can signal strong selling interest and the potential for a continued downtrend. Traders might see this as a cue to sell or avoid buying.
20 EMA (Exponential Moving Average):
Above 20 EMA: If the stock price is above the 20 EMA, it suggests a potential uptrend or bullish momentum.
Below 20 EMA: If the stock price is below the 20 EMA, it indicates a potential downtrend or bearish momentum.
Trendline: A trendline is a straight line drawn on a chart to represent the general direction of a data point set.
Uptrend Line: Drawn by connecting the lows in an upward trend. Indicates that the price is moving higher over time. Acts as a support level, where prices tend to bounce upward.
Downtrend Line: Drawn by connecting the highs in a downward trend. Indicates that the price is moving lower over time. It acts as a resistance level, where prices tend to drop.
RSI: RSI readings greater than the 70 level are overbought territory, and RSI readings lower than the 30 level are considered oversold territory.
Combining RSI with Support and Resistance:
Support Level: This is a price level where a stock tends to find buying interest, preventing it from falling further. If RSI is showing an oversold condition (below 30) and the price is near or at a strong support level, it could be a good buy signal.
Resistance Level: This is a price level where a stock tends to find selling interest, preventing it from rising further. If RSI is showing an overbought condition (above 70) and the price is near or at a strong resistance level, it could be a signal to sell or short the asset.
Disclaimer:
I am not a SEBI registered. The information provided here is for learning purposes only and should not be interpreted as financial advice. Consider the broader market context and consult with a qualified financial advisor before making investment decisions.

Log in midcap niftyMidcap nifty is in uptrend following by a channel with higher high structure...if tomorrow day's high or a swing gets break to upside we can expect a 200 points move in midcap coming days... thank you 😇

MIDCAP NIFTY S/R for 26/8/24Support and Resistance Levels:
Support Levels: These are price points (green line/share) where a downward trend may be halted due to a concentration of buying interest. Imagine them as a safety net where buyers step in, preventing further decline.
Resistance Levels: Conversely, resistance levels (red line/shade) are where upward trends might stall due to increased selling interest. They act like a ceiling where sellers come in to push prices down.
Breakouts:
Bullish Breakout: When the price moves above resistance, it often indicates strong buying interest and the potential for a continued uptrend. Traders may view this as a signal to buy or hold.
Bearish Breakout: When the price falls below support, it can signal strong selling interest and the potential for a continued downtrend. Traders might see this as a cue to sell or avoid buying.
20 EMA (Exponential Moving Average):
Above 20 EMA: If the stock price is above the 20 EMA, it suggests a potential uptrend or bullish momentum.
Below 20 EMA: If the stock price is below the 20 EMA, it indicates a potential downtrend or bearish momentum.
Trendline: A trendline is a straight line drawn on a chart to represent the general direction of a data point set.
Uptrend Line: Drawn by connecting the lows in an upward trend. Indicates that the price is moving higher over time. Acts as a support level, where prices tend to bounce upward.
Downtrend Line: Drawn by connecting the highs in a downward trend. Indicates that the price is moving lower over time. It acts as a resistance level, where prices tend to drop.
RSI: RSI readings greater than the 70 level are overbought territory, and RSI readings lower than the 30 level are considered oversold territory.
Combining RSI with Support and Resistance:
Support Level: This is a price level where a stock tends to find buying interest, preventing it from falling further. If RSI is showing an oversold condition (below 30) and the price is near or at a strong support level, it could be a good buy signal.
Resistance Level: This is a price level where a stock tends to find selling interest, preventing it from rising further. If RSI is showing an overbought condition (above 70) and the price is near or at a strong resistance level, it could be a signal to sell or short the asset.
Disclaimer:
I am not a SEBI registered. The information provided here is for learning purposes only and should not be interpreted as financial advice. Consider the broader market context and consult with a qualified financial advisor before making investment decisions.

MIDCAP S/R for 23/8/24Support and Resistance Levels:
Support Levels: These are price points (green line/share) where a downward trend may be halted due to a concentration of buying interest. Imagine them as a safety net where buyers step in, preventing further decline.
Resistance Levels: Conversely, resistance levels (red line/shade) are where upward trends might stall due to increased selling interest. They act like a ceiling where sellers come in to push prices down.
Breakouts:
Bullish Breakout: When the price moves above resistance, it often indicates strong buying interest and the potential for a continued uptrend. Traders may view this as a signal to buy or hold.
Bearish Breakout: When the price falls below support, it can signal strong selling interest and the potential for a continued downtrend. Traders might see this as a cue to sell or avoid buying.
20 EMA (Exponential Moving Average):
Above 20 EMA: If the stock price is above the 20 EMA, it suggests a potential uptrend or bullish momentum.
Below 20 EMA: If the stock price is below the 20 EMA, it indicates a potential downtrend or bearish momentum.
Trendline: A trendline is a straight line drawn on a chart to represent the general direction of a data point set.
Uptrend Line: Drawn by connecting the lows in an upward trend. Indicates that the price is moving higher over time. Acts as a support level, where prices tend to bounce upward.
Downtrend Line: Drawn by connecting the highs in a downward trend. Indicates that the price is moving lower over time. It acts as a resistance level, where prices tend to drop.
RSI: RSI readings greater than the 70 level are overbought territory, and RSI readings lower than the 30 level are considered oversold territory.
Combining RSI with Support and Resistance:
Support Level: This is a price level where a stock tends to find buying interest, preventing it from falling further. If RSI is showing an oversold condition (below 30) and the price is near or at a strong support level, it could be a good buy signal.
Resistance Level: This is a price level where a stock tends to find selling interest, preventing it from rising further. If RSI is showing an overbought condition (above 70) and the price is near or at a strong resistance level, it could be a signal to sell or short the asset.
Disclaimer:
I am not a SEBI registered. The information provided here is for learning purposes only and should not be interpreted as financial advice. Consider the broader market context and consult with a qualified financial advisor before making investment decisions.
MIDCAP NIFTY S/R for 20/8/24Support and Resistance Levels:
Support Levels: These are price points (green line/share) where a downward trend may be halted due to a concentration of buying interest. Imagine them as a safety net where buyers step in, preventing further decline.
Resistance Levels: Conversely, resistance levels (red line/shade) are where upward trends might stall due to increased selling interest. They act like a ceiling where sellers come in to push prices down.
Breakouts:
Bullish Breakout: When the price moves above resistance, it often indicates strong buying interest and the potential for a continued uptrend. Traders may view this as a signal to buy or hold.
Bearish Breakout: When the price falls below support, it can signal strong selling interest and the potential for a continued downtrend. Traders might see this as a cue to sell or avoid buying.
20 EMA (Exponential Moving Average):
Above 20 EMA: If the stock price is above the 20 EMA, it suggests a potential uptrend or bullish momentum.
Below 20 EMA: If the stock price is below the 20 EMA, it indicates a potential downtrend or bearish momentum.
Trendline: A trendline is a straight line drawn on a chart to represent the general direction of a data point set.
Uptrend Line: Drawn by connecting the lows in an upward trend. Indicates that the price is moving higher over time. Acts as a support level, where prices tend to bounce upward.
Downtrend Line: Drawn by connecting the highs in a downward trend. Indicates that the price is moving lower over time. It acts as a resistance level, where prices tend to drop.
RSI: RSI readings greater than the 70 level are overbought territory, and RSI readings lower than the 30 level are considered oversold territory.
Combining RSI with Support and Resistance:
Support Level: This is a price level where a stock tends to find buying interest, preventing it from falling further. If RSI is showing an oversold condition (below 30) and the price is near or at a strong support level, it could be a good buy signal.
Resistance Level: This is a price level where a stock tends to find selling interest, preventing it from rising further. If RSI is showing an overbought condition (above 70) and the price is near or at a strong resistance level, it could be a signal to sell or short the asset.
Disclaimer:
I am not a SEBI registered. The information provided here is for learning purposes only and should not be interpreted as financial advice. Consider the broader market context and consult with a qualified financial advisor before making investment decisions.

Mid Cap Nifty Select Analysis for 19-08-2024: S & R LevelsOn Friday, the Mid Cap Nifty Select Index closed at 12,724.85, marking a significant increase of 1.64% from its previous close of 12,520.10. The day's trading saw the index opening at 12,624.45, reaching a high of 12,734.35, and a low of 12,572.60.
Technical Indicators for Mid Cap Nifty Select:
Max Pain: 12,700
PCR (Put-Call Ratio): 1.01 Bullish
IV (Implied Volatility): 11.45 as of the closing on 16-08-2024.
Support Levels
Midcap Nifty Select Index is already in bullish domain with key support levels around 12,600 and 12,500.
Resistance Levels
If the index sustains above these levels, a pullback towards the resistance levels of 12,800 is possible.
Top Gainers and Losers:
Top Gainers:
Ashok Leyland led the gainers with a 3.85% rise, closing at ₹255.95.
Balkrishna Industries followed, up by 1.84% to ₹2,832.55.
Hindustan Petroleum Corporation Ltd (HPCL) also performed well, gaining 1.81% to close at ₹379.85.
Top Losers:
Aurobindo Pharma was among the few decliners, down 1.12% to ₹1,502.75.
Other notable losers included companies like AU Small Finance Bank, though the percentage loss was relatively minor.
Possible Trade Prediction for 19th August 2024:
A bullish trend seems to be in place. The key support level is identified at 12,600, with resistance around 12,800. If the index opens around these levels, traders should watch for a break above 12,800 for further bullish momentum. Conversely, a failure to hold 12,600 could indicate a potential retracement.
Technical Parameters:
Moving Averages: The 50-day and 200-day moving averages are both trending upwards, signalling continued strength.
Relative Strength Index (RSI): The RSI is near 70, suggesting that the index is approaching overbought territory, which could warrant caution.
OI Analysis:
The Open Interest (OI) data indicates strong positions at the 12,700 strike price, suggesting that traders expect the index to hover around this level. Heavy call writing at 12,800 and significant put writing at 12,600 reinforces these as crucial resistance and support levels, respectively.
Disclosure: The publisher of this idea is not a SEBI registered analyst. The information shared here is solely for educational purposes and should not be interpreted as financial advice. Always consult with a qualified financial advisor before making any investment decisions. The publisher does not endorse social media shares on any platform.

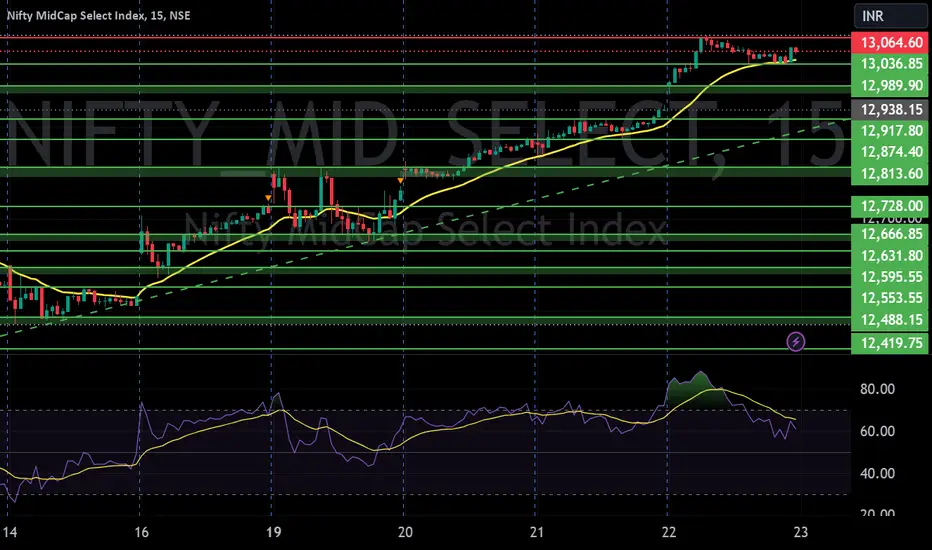
NIFTY MIDCAP S/R for 19/8/24Support and Resistance Levels:
Support Levels: These are price points (green line/share) where a downward trend may be halted due to a concentration of buying interest. Imagine them as a safety net where buyers step in, preventing further decline.
Resistance Levels: Conversely, resistance levels (red line/shade) are where upward trends might stall due to increased selling interest. They act like a ceiling where sellers come in to push prices down.
Breakouts:
Bullish Breakout: When the price moves above resistance, it often indicates strong buying interest and the potential for a continued uptrend. Traders may view this as a signal to buy or hold.
Bearish Breakout: When the price falls below support, it can signal strong selling interest and the potential for a continued downtrend. Traders might see this as a cue to sell or avoid buying.
20 EMA (Exponential Moving Average):
Above 20 EMA: If the stock price is above the 20 EMA, it suggests a potential uptrend or bullish momentum.
Below 20 EMA: If the stock price is below the 20 EMA, it indicates a potential downtrend or bearish momentum.
Trendline: A trendline is a straight line drawn on a chart to represent the general direction of a data point set.
Uptrend Line: Drawn by connecting the lows in an upward trend. Indicates that the price is moving higher over time. Acts as a support level, where prices tend to bounce upward.
Downtrend Line: Drawn by connecting the highs in a downward trend. Indicates that the price is moving lower over time. It acts as a resistance level, where prices tend to drop.
Disclaimer:
I am not a SEBI registered. The information provided here is for learning purposes only and should not be interpreted as financial advice. Consider the broader market context and consult with a qualified financial advisor before making investment decisions.

MIDCAP NIFTY S/R for 13/8/24Support and Resistance Levels:
Support Levels: These are price points (green line/share) where a downward trend may be halted due to a concentration of buying interest. Imagine them as a safety net where buyers step in, preventing further decline.
Resistance Levels: Conversely, resistance levels (red line/shade) are where upward trends might stall due to increased selling interest. They act like a ceiling where sellers come in to push prices down.
Breakouts:
Bullish Breakout: When the price moves above resistance, it often indicates strong buying interest and the potential for a continued uptrend. Traders may view this as a signal to buy or hold.
Bearish Breakout: When the price falls below support, it can signal strong selling interest and the potential for a continued downtrend. Traders might see this as a cue to sell or avoid buying.
20 EMA (Exponential Moving Average):
Above 20 EMA: If the stock price is above the 20 EMA, it suggests a potential uptrend or bullish momentum.
Below 20 EMA: If the stock price is below the 20 EMA, it indicates a potential downtrend or bearish momentum.
Disclaimer:
I am not a SEBI registered. The information provided here is for learning purposes only and should not be interpreted as financial advice. Consider the broader market context and consult with a qualified financial advisor before making investment decisions.

Mid Cap Nifty Analysis for 12-08-2024: S & R LevelsOn August 9, 2024, the Nifty Midcap Select Index demonstrated a positive market trend, closing at 12,598.95, which marked an increase of 0.59% from the previous close of 12,524.95. The trading session opened at 12,654.55 and saw the index reaching an intraday high of 12,714.80 before retracing slightly. The day's low was recorded at 12,577.40, indicating some selling pressure at higher levels as traders booked profits. Despite this, the index managed to hold above the critical support level, reflecting overall market resilience.
Hindenburg Research has accused SEBI Chairperson Madhabi Puri Buch and her husband of having financial ties to offshore entities involved in the Adani Group's financial activities. The allegations, based on whistleblower documents, suggest that these ties represent a conflict of interest, particularly given SEBI's investigation into Adani. The Buchs have denied these claims, calling them baseless and an attack on their character. The controversy has led to political demands for a government probe to address potential conflicts of interest within SEBI's investigation of the Adani Group. The market can go either sideways of can be extremely volatile so trade with great caution.
Technical Indicators for Mid Cap Nifty:
Max Pain: 12,600
PCR (Put-Call Ratio): 0.83 Neutral
IV (Implied Volatility): 14.25 as of the closing on 09-08-2024.
Support Levels
The immediate support level is identified at 12,530, which is crucial for maintaining the index's upward momentum. A break below this level could lead to a further decline, with the major support situated at 12,450, potentially triggering a short-term correction.
Resistance Levels
On the upside, the index faces immediate resistance at 12,710. If the index manages to surpass this level, it could rally towards the major resistance at 12,800. These resistance levels are critical as they will test the strength of the bullish trend.
Top Gainers:
• Lupin: +3.06% (Closed at 2,113.55)
• Hindustan Petroleum: +3.21% (Closed at 376.65)
• Mphasis: +2.84% (Closed at 2,720.50)
Top Losers:
• MRF: -2.48% (Closed at 136,911.70)
• Cummins India: -0.36% (Closed at 3,715.10)
• Voltas: -0.50% (Closed at 1,428.85)
• Trading Strategy for August 12, 2024:
Bullish View: If the index sustains above 12,600, traders might consider long positions with a target of 12,710 and 12,800.
Bearish View: If the index breaks below 12,530, it could trigger a short-term correction, providing opportunities for short-selling with a target of 12,450.
Stay tuned for more updates on Mid Cap Nifty Select prediction to navigate the volatile market conditions effectively.
Disclosure: The publisher of this idea is not a SEBI registered analyst. The information shared here is solely for educational purposes and should not be interpreted as financial advice. Always consult with a qualified financial advisor before making any investment decisions. The publisher does not endorse social media shares on any platform.

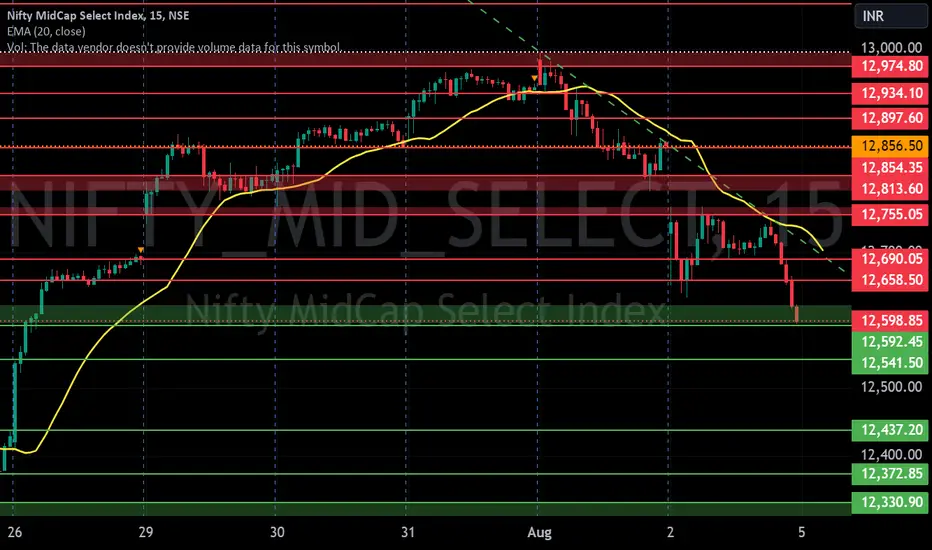
MIDCAP NIFTY S/R for 12/8/24Support and Resistance Levels:
Support Levels: These are price points (green line/share) where a downward trend may be halted due to a concentration of buying interest. Imagine them as a safety net where buyers step in, preventing further decline.
Resistance Levels: Conversely, resistance levels (red line/shade) are where upward trends might stall due to increased selling interest. They act like a ceiling where sellers come in to push prices down.
Breakouts:
Bullish Breakout: When the price moves above resistance, it often indicates strong buying interest and the potential for a continued uptrend. Traders may view this as a signal to buy or hold.
Bearish Breakout: When the price falls below support, it can signal strong selling interest and the potential for a continued downtrend. Traders might see this as a cue to sell or avoid buying.
20 EMA (Exponential Moving Average):
Above 20 EMA: If the stock price is above the 20 EMA, it suggests a potential uptrend or bullish momentum.
Below 20 EMA: If the stock price is below the 20 EMA, it indicates a potential downtrend or bearish momentum.
Disclaimer:
I am not a SEBI registered. The information provided here is for learning purposes only and should not be interpreted as financial advice. It's important to remember that while these indicators can be useful, they are not foolproof. Always consider the broader market context and consult with a qualified financial advisor before making any investment decisions.

Midcap Nifty- Important Levels for August 2024These are some of the significant levels for Intraday/ Swing trading...
Try not to trade in between these levels.

NIFTY MIDCAP S/R for 9/8/24Support and Resistance Levels:
Support Levels: These are price points (green line/share) where a downward trend may be halted due to a concentration of buying interest. Imagine them as a safety net where buyers step in, preventing further decline.
Resistance Levels: Conversely, resistance levels (red line/shade) are where upward trends might stall due to increased selling interest. They act like a ceiling where sellers come in to push prices down.
Breakouts:
Bullish Breakout: When the price moves above resistance, it often indicates strong buying interest and the potential for a continued uptrend. Traders may view this as a signal to buy or hold.
Bearish Breakout: When the price falls below support, it can signal strong selling interest and the potential for a continued downtrend. Traders might see this as a cue to sell or avoid buying.
20 EMA (Exponential Moving Average):
Above 20 EMA: If the stock price is above the 20 EMA, it suggests a potential uptrend or bullish momentum.
Below 20 EMA: If the stock price is below the 20 EMA, it indicates a potential downtrend or bearish momentum.
Disclaimer:
I am not a SEBI registered. The information provided here is for learning purposes only and should not be interpreted as financial advice. It's important to remember that while these indicators can be useful, they are not foolproof. Always consider the broader market context and consult with a qualified financial advisor before making any investment decisions.

Nifty Mid Cap Select Analysis for 03-08-2024: S&R LevelsTrade with Caution
Amid escalating tensions in the Middle East and mounting uncertainty in the US economy, the Indian stock market retreated from its all-time high on Friday. The ripple effects of a broader selloff in global markets significantly impacted the Indian stock market, with midcap stocks bearing the brunt of the decline. The Nifty Mid Cap Select index experienced a notable drop of -1.80%, indicating a possible pause in the recent upward trend and prompting investors to engage in profit booking at current levels. This downturn reflects a broader market sentiment influenced by geopolitical instability and economic concerns from major global economies.
Nifty Mid Cap Select Support & Resistance Levels for Tomorrow:
Support Levels:
The first support level is at 12,490 followed by a stronger support between 12,350 to 12,300.
Resistance Levels:
On the upside, the index is already trading above its resistance between 12,650 to 12,700 and strong resistance at 12,800 for Intraday.
Technical Indicators for Nifty Mid Cap Select Prediction:
Max Pain: 12,700
PCR (Put-Call Ratio): 0.52 Bearish
IV (Implied Volatility): 15.57 as of the closing on 02-08-2024.
Stay tuned for more updates on Nifty Mid Cap prediction to navigate the volatile market conditions effectively.
Disclosure: The publisher of this idea is not a SEBI registered analyst. The information shared here is solely for educational purposes and should not be interpreted as financial advice. Always consult with a qualified financial advisor before making any investment decisions. The publisher does not endorse social media shares on any platform.

MIDCAP NIFTY S/R for 5/8/24Support and Resistance Levels: In technical analysis, support and resistance levels are significant price levels where buying or selling interest tends to be strong. They are identified based on previous price levels where the price has shown a tendency to reverse or find support.
Support levels are represented by the green line and green shade, indicating areas where buying interest may emerge to prevent further price decline.
Resistance levels are represented by the red line and red shade, indicating areas where selling pressure may arise to prevent further price increases. Traders often consider these levels as potential buying or selling opportunities.
Breakouts: Breakouts occur when the price convincingly moves above a resistance level (red shade) or below a support level (green shade). A bullish breakout above resistance suggests the potential for further price increases, while a bearish breakout below support suggests the potential for further price declines. Traders pay attention to these breakout signals as they may indicate the start of a new trend or significant price movement.
20 EMA: The yellow line denotes 20 EMA, to interpret the 20 EMA, you need to compare it with the prevailing stock price. If the stock price is below the 20 EMA, it signals a possible downtrend. But if the stock price is above the 20 EMA, it signals a possible uptrend.
Disclosure: I am not SEBI registered. The information provided here is for learning purposes only and should not be interpreted as financial advice. It is important to consult with a qualified financial advisor before making any investment decisions. Tweets neither advice nor endorsement.
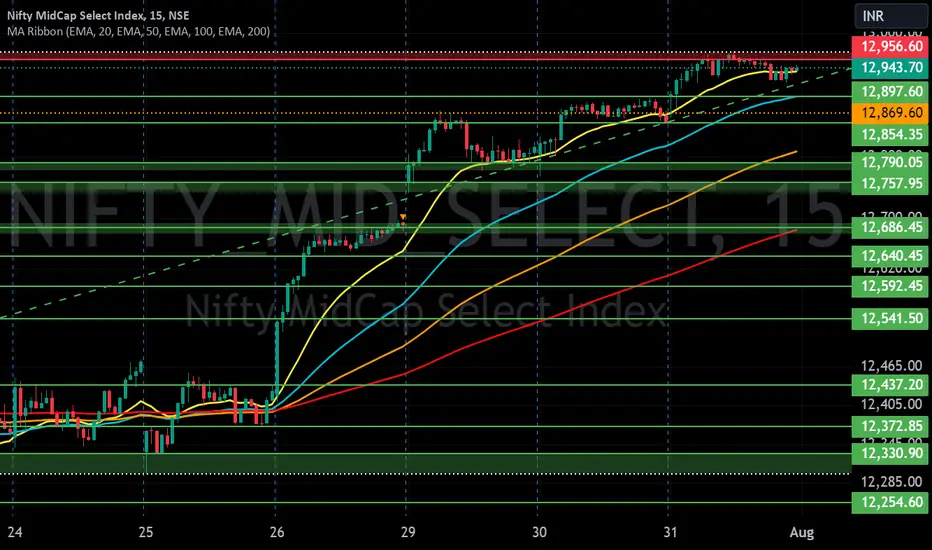
MIDCAP NIFTY S/R for 1/8/24Support and Resistance Levels: In technical analysis, support and resistance levels are significant price levels where buying or selling interest tends to be strong. They are identified based on previous price levels where the price has shown a tendency to reverse or find support.
Support levels are represented by the green line and green shade, indicating areas where buying interest may emerge to prevent further price decline.
Resistance levels are represented by the red line and red shade, indicating areas where selling pressure may arise to prevent further price increases. Traders often consider these levels as potential buying or selling opportunities.
Breakouts: Breakouts occur when the price convincingly moves above a resistance level (red shade) or below a support level (green shade). A bullish breakout above resistance suggests the potential for further price increases, while a bearish breakout below support suggests the potential for further price declines. Traders pay attention to these breakout signals as they may indicate the start of a new trend or significant price movement.
20 EMA: The yellow line denotes 20 EMA, to interpret the 20 EMA, you need to compare it with the prevailing stock price. If the stock price is below the 20 EMA, it signals a possible downtrend. But if the stock price is above the 20 EMA, it signals a possible uptrend.
Disclosure: I am not SEBI registered. The information provided here is for learning purposes only and should not be interpreted as financial advice. It is important to consult with a qualified financial advisor before making any investment decisions. Tweets neither advice nor endorsement.
NIFTY MIDCAP S/R for 29/7/24Support and Resistance Levels: In technical analysis, support and resistance levels are significant price levels where buying or selling interest tends to be strong. They are identified based on previous price levels where the price has shown a tendency to reverse or find support.
Support levels are represented by the green line and green shade, indicating areas where buying interest may emerge to prevent further price decline.
Resistance levels are represented by the red line and red shade, indicating areas where selling pressure may arise to prevent further price increases. Traders often consider these levels as potential buying or selling opportunities.
Breakouts: Breakouts occur when the price convincingly moves above a resistance level (red shade) or below a support level (green shade). A bullish breakout above resistance suggests the potential for further price increases, while a bearish breakout below support suggests the potential for further price declines. Traders pay attention to these breakout signals as they may indicate the start of a new trend or significant price movement.
20 EMA: The yellow line denotes 20 EMA, to interpret the 20 EMA, you need to compare it with the prevailing stock price. If the stock price is below the 20 EMA, it signals a possible downtrend. But if the stock price is above the 20 EMA, it signals a possible uptrend.
Disclosure: I am not SEBI registered. The information provided here is for learning purposes only and should not be interpreted as financial advice. It is important to consult with a qualified financial advisor before making any investment decisions. Tweets neither advice nor endorsement.

Mid Cap Nifty Select Analysis for 29-07-2024: S & RFind a Trade in the Choppy Zones
The Indian stock market, including the Nifty and Sensex, witnessed a significant rally on 26-07-2024, with key indices like Midcap Nifty and Midcap Nifty Select and Small Cap also joining the uptrend. Despite this broad-based surge, it is essential to approach the market with caution due to the recent sharp rise.
The Mid Cap Nifty Select, in particular, is likely to exhibit a cautious trend of consolidation with its monthly expiry approaching on Monday. Day traders should pay attention to support and resistance levels, as they provide opportunities for both long and short trades. Currently, the first support level is at 12,400, followed by 12,300, with a stronger support at the round number of 12,000. On the upside, the initial resistance is at 12,550, which can act as a support level, with strong resistance between 12,600 and 12,800.
All key sectors, including IT, Finance, Consumer Goods, Pharmaceuticals, and Infrastructure, largely traded in the green. However, it is notable that a rising wedge pattern is forming on higher time frames of one and four hours, indicating a potential correction in the near future. Traders should remain vigilant and exercise prudence in their intraday trades, considering these technical patterns and levels. All the key components of IT, Finance, Consumer Goods, Pharmaceuticals and Infrastructure largely traded in green.
Mid Cap Nifty Select Support & Resistance Levels for Tomorrow:
Support Levels:
The first support level is at 12,400 followed by 12,300 and a stronger support at 12,000 being a round off number.
Resistance Levels:
On the upside, the initial resistance is at 12,550 which can act as support and strong resistance at 12,600 to 12,800.
Technical Indicators for Mid Cap Nifty Select:-
Max Pain Mid Cap Nifty: 12,600
PCR (Put-Call Ratio): 1.34 Bullish
IV (Implied Volatility): 11.92 as of the closing on 26-07-2024.
Stay tuned for more updates on Midcap Nifty and Mid Cap Nifty Select prediction for tomorrow to navigate the volatile market conditions effectively.
Disclosure: I am not a SEBI registered analyst. The information shared here is solely for educational purposes and should not be interpreted as a financial advice. Always consult with a qualified financial advisor before making any investment related decisions. The publisher does not endorse or support social media shares of the published content on any platform.

Midcap Nifty Select Prediction for 22 July 2024 along with S & RMidcap Nifty Select Prediction for 22 July 2024 along with Support & Resistance Levels
A negative RSI crossover and Rising Wedge pattern suggest a potential correction; with potential targets on downside 12,100 on intraday basis.
However, the index has initial support at around 1 2,180-12,100 , in case of a time-based correction. If broken, the next support level is at 12,000 being a roundoff number. On the other hand, resistance is at 12,300 and 12,400 to 12,500 .
Max Pain: 12,250 PCR: 0.45 IV: 13.91 as on 19-07-2024
The market can witness low volatility. Since, PCR indicates overbought market, Midcap Nifty Select can show bounce back at support levels.
Disclosure: I am not SEBI registered. The information provided is for educational purposes only and should not be considered financial advice. Consult a qualified financial advisor before making any investment decisions. Tweets are neither advice nor endorsements.

NIFTY MIDCAP S/R for 22/7/24Support and Resistance Levels: In technical analysis, support and resistance levels are significant price levels where buying or selling interest tends to be strong. They are identified based on previous price levels where the price has shown a tendency to reverse or find support.
Support levels are represented by the green line and green shade, indicating areas where buying interest may emerge to prevent further price decline.
Resistance levels are represented by the red line and red shade, indicating areas where selling pressure may arise to prevent further price increases. Traders often consider these levels as potential buying or selling opportunities.
Breakouts: Breakouts occur when the price convincingly moves above a resistance level (red shade) or below a support level (green shade). A bullish breakout above resistance suggests the potential for further price increases, while a bearish breakout below support suggests the potential for further price declines. Traders pay attention to these breakout signals as they may indicate the start of a new trend or significant price movement.
20 EMA: The yellow line denotes 20 EMA, to interpret the 20 EMA, you need to compare it with the prevailing stock price. If the stock price is below the 20 EMA, it signals a possible downtrend. But if the stock price is above the 20 EMA, it signals a possible uptrend.
Disclosure: I am not SEBI registered. The information provided here is for learning purposes only and should not be interpreted as financial advice. It is important to consult with a qualified financial advisor before making any investment decisions. Tweets neither advice nor endorsement.
