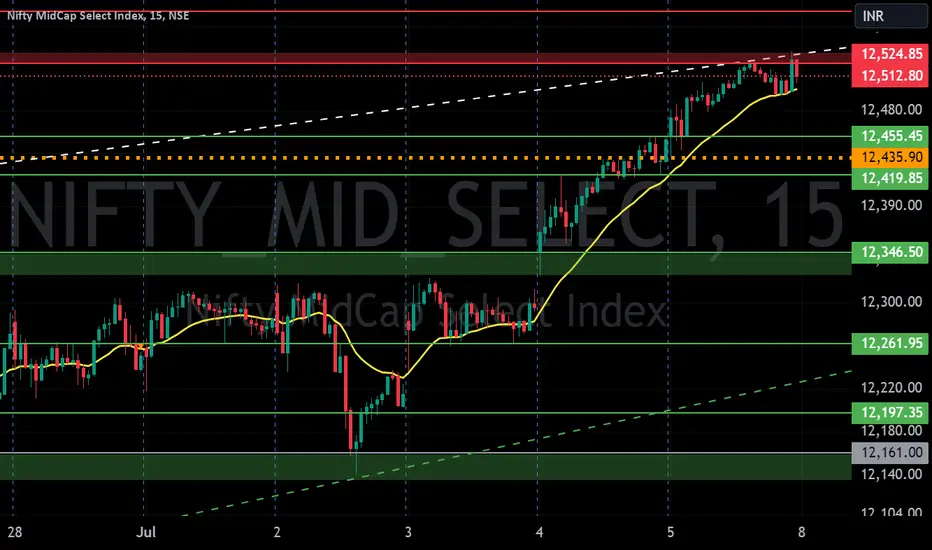
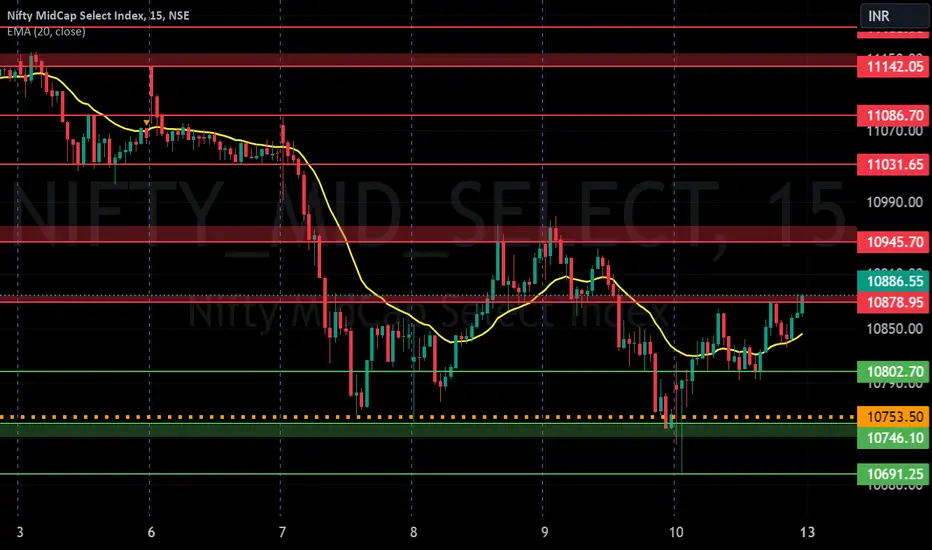
NIFTY MIDCAP S/R for 12/7/24Support and Resistance Levels: In technical analysis, support and resistance levels are significant price levels where buying or selling interest tends to be strong. They are identified based on previous price levels where the price has shown a tendency to reverse or find support.
Support levels are represented by the green line and green shade, indicating areas where buying interest may emerge to prevent further price decline.
Resistance levels are represented by the red line and red shade, indicating areas where selling pressure may arise to prevent further price increases. Traders often consider these levels as potential buying or selling opportunities.
Breakouts: Breakouts occur when the price convincingly moves above a resistance level (red shade) or below a support level (green shade). A bullish breakout above resistance suggests the potential for further price increases, while a bearish breakout below support suggests the potential for further price declines. Traders pay attention to these breakout signals as they may indicate the start of a new trend or significant price movement.
20 EMA: The yellow line denotes 20 EMA, to interpret the 20 EMA, you need to compare it with the prevailing stock price. If the stock price is below the 20 EMA, it signals a possible downtrend. But if the stock price is above the 20 EMA, it signals a possible uptrend.
Disclosure: I am not SEBI registered. The information provided here is for learning purposes only and should not be interpreted as financial advice. It is important to consult with a qualified financial advisor before making any investment decisions. Tweets neither advice nor endorsement.
NIFTY_MID_SELECT trade ideas
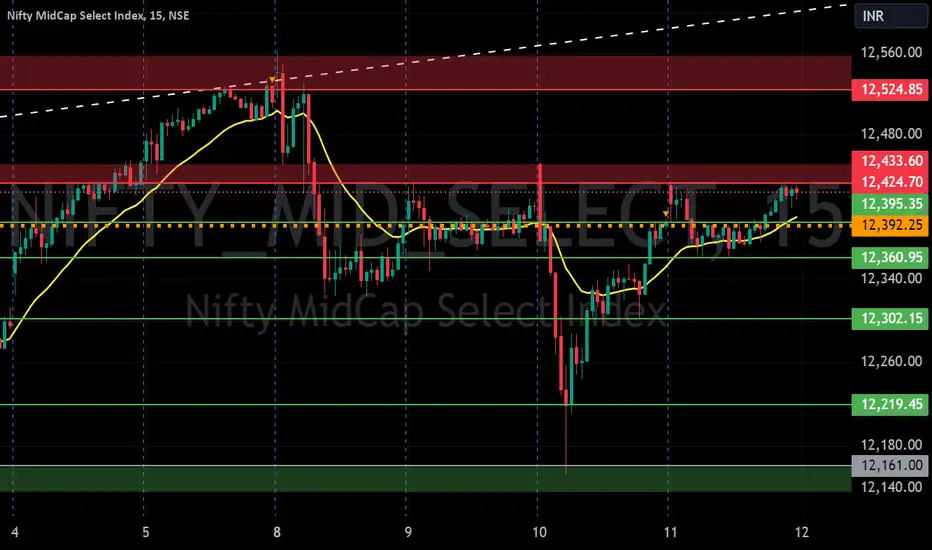
MIDCAP NIFTY S/R for 11/7/24Support and Resistance Levels: In technical analysis, support and resistance levels are significant price levels where buying or selling interest tends to be strong. They are identified based on previous price levels where the price has shown a tendency to reverse or find support.
Support levels are represented by the green line and green shade, indicating areas where buying interest may emerge to prevent further price decline.
Resistance levels are represented by the red line and red shade, indicating areas where selling pressure may arise to prevent further price increases. Traders often consider these levels as potential buying or selling opportunities.
Breakouts: Breakouts occur when the price convincingly moves above a resistance level (red shade) or below a support level (green shade). A bullish breakout above resistance suggests the potential for further price increases, while a bearish breakout below support suggests the potential for further price declines. Traders pay attention to these breakout signals as they may indicate the start of a new trend or significant price movement.
20 EMA: The yellow line denotes 20 EMA, to interpret the 20 EMA, you need to compare it with the prevailing stock price. If the stock price is below the 20 EMA, it signals a possible downtrend. But if the stock price is above the 20 EMA, it signals a possible uptrend.
Disclosure: I am not SEBI registered. The information provided here is for learning purposes only and should not be interpreted as financial advice. It is important to consult with a qualified financial advisor before making any investment decisions. Tweets neither advice nor endorsement.

MIDCAP NIFTY S/R of 8/7/24Support and Resistance Levels: In technical analysis, support and resistance levels are significant price levels where buying or selling interest tends to be strong. They are identified based on previous price levels where the price has shown a tendency to reverse or find support.
Support levels are represented by the green line and green shade, indicating areas where buying interest may emerge to prevent further price decline.
Resistance levels are represented by the red line and red shade, indicating areas where selling pressure may arise to prevent further price increases. Traders often consider these levels as potential buying or selling opportunities.
Breakouts: Breakouts occur when the price convincingly moves above a resistance level (red shade) or below a support level (green shade). A bullish breakout above resistance suggests the potential for further price increases, while a bearish breakout below support suggests the potential for further price declines. Traders pay attention to these breakout signals as they may indicate the start of a new trend or significant price movement.
20 EMA: The yellow line denotes 20 EMA, to interpret the 20 EMA, you need to compare it with the prevailing stock price. If the stock price is below the 20 EMA, it signals a possible downtrend. But if the stock price is above the 20 EMA, it signals a possible uptrend.
Disclosure: I am not SEBI registered. The information provided here is for learning purposes only and should not be interpreted as financial advice. It is important to consult with a qualified financial advisor before making any investment decisions. Tweets neither advice nor endorsement.
MIDCAP NIFTY S/R for 1/7/24Support and Resistance Levels: In technical analysis, support and resistance levels are significant price levels where buying or selling interest tends to be strong. They are identified based on previous price levels where the price has shown a tendency to reverse or find support.
Support levels are represented by the green line and green shade, indicating areas where buying interest may emerge to prevent further price decline.
Resistance levels are represented by the red line and red shade, indicating areas where selling pressure may arise to prevent further price increases. Traders often consider these levels as potential buying or selling opportunities.
Breakouts: Breakouts occur when the price convincingly moves above a resistance level (red shade) or below a support level (green shade). A bullish breakout above resistance suggests the potential for further price increases, while a bearish breakout below support suggests the potential for further price declines. Traders pay attention to these breakout signals as they may indicate the start of a new trend or significant price movement.
20 EMA: The yellow line denotes 20 EMA, to interpret the 20 EMA, you need to compare it with the prevailing stock price. If the stock price is below the 20 EMA, it signals a possible downtrend. But if the stock price is above the 20 EMA, it signals a possible uptrend.
Disclosure: I am not SEBI registered. The information provided here is for learning purposes only and should not be interpreted as financial advice. It is important to consult with a qualified financial advisor before making any investment decisions. Tweets neither advice nor endorsement.
Midnifty Intraday Analysis for 27th June 2024NSE:NIFTY_MID_SELECT
Maximum Call writing near CMP is at 12300 strike with 22.54 Lakh followed by 8.18 Lakh at 12400 Strike and 6.83 Lakh at 12500 strike and Put writing of 14.09 Lakh at 12300 Strike followed by 9.53 Lakh at 12200 Strike and 7.87 Lakh at 12000 strike. Index is closed near 12250 level.
Index has resistance near 12350 – 12400 range and if index crosses and sustain above 12400 level then may reach near 12500 level.
Index has immediate support near 12200 - 12150 range and if this support is broken then index may tank near 12000 level.

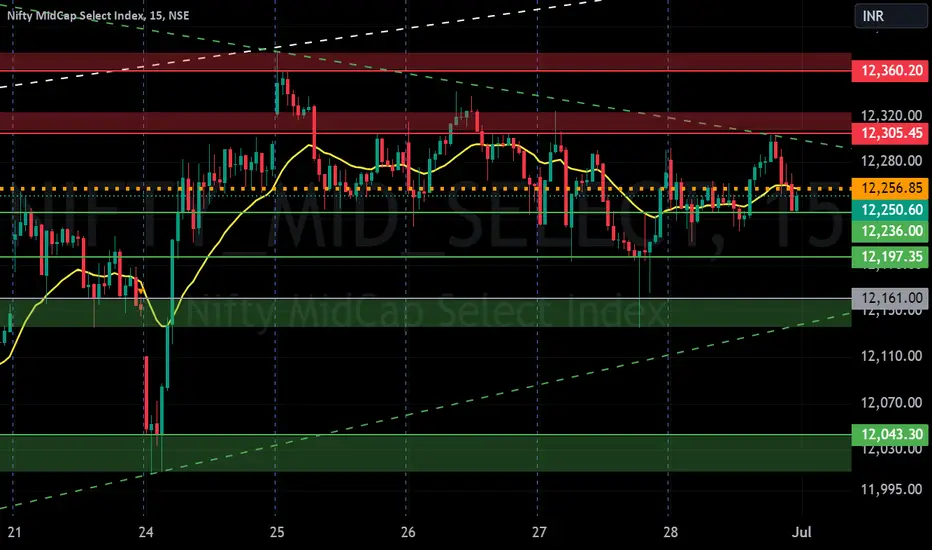
MIDCAP NIFTY S/R for 24/6/24Support and Resistance Levels: In technical analysis, support and resistance levels are significant price levels where buying or selling interest tends to be strong. They are identified based on previous price levels where the price has shown a tendency to reverse or find support.
Support levels are represented by the green line and green shade, indicating areas where buying interest may emerge to prevent further price decline.
Resistance levels are represented by the red line and red shade, indicating areas where selling pressure may arise to prevent further price increases. Traders often consider these levels as potential buying or selling opportunities.
Breakouts: Breakouts occur when the price convincingly moves above a resistance level (red shade) or below a support level (green shade). A bullish breakout above resistance suggests the potential for further price increases, while a bearish breakout below support suggests the potential for further price declines. Traders pay attention to these breakout signals as they may indicate the start of a new trend or significant price movement.
Disclosure: I am not SEBI registered. The information provided here is for learning purposes only and should not be interpreted as financial advice. It is important to consult with a qualified financial advisor before making any investment decisions. Tweets neither advice nor endorsement.

MIDCAP NIFTY S/R for 19/6/24Support and Resistance Levels: In technical analysis, support and resistance levels are significant price levels where buying or selling interest tends to be strong. They are identified based on previous price levels where the price has shown a tendency to reverse or find support.
Support levels are represented by the green line and green shade, indicating areas where buying interest may emerge to prevent further price decline.
Resistance levels are represented by the red line and red shade, indicating areas where selling pressure may arise to prevent further price increases. Traders often consider these levels as potential buying or selling opportunities.
Breakouts: Breakouts occur when the price convincingly moves above a resistance level (red shade) or below a support level (green shade). A bullish breakout above resistance suggests the potential for further price increases, while a bearish breakout below support suggests the potential for further price declines. Traders pay attention to these breakout signals as they may indicate the start of a new trend or significant price movement.
Disclosure: I am not SEBI registered. The information provided here is for learning purposes only and should not be interpreted as financial advice. It is important to consult with a qualified financial advisor before making any investment decisions. Tweets neither advice nor endorsement.

MIDCAP NITY S/R for 18/6/24Support and Resistance Levels: In technical analysis, support and resistance levels are significant price levels where buying or selling interest tends to be strong. They are identified based on previous price levels where the price has shown a tendency to reverse or find support.
Support levels are represented by the green line and green shade, indicating areas where buying interest may emerge to prevent further price decline.
Resistance levels are represented by the red line and red shade, indicating areas where selling pressure may arise to prevent further price increases. Traders often consider these levels as potential buying or selling opportunities.
Breakouts: Breakouts occur when the price convincingly moves above a resistance level (red shade) or below a support level (green shade). A bullish breakout above resistance suggests the potential for further price increases, while a bearish breakout below support suggests the potential for further price declines. Traders pay attention to these breakout signals as they may indicate the start of a new trend or significant price movement.
Disclosure: I am not SEBI registered. The information provided here is for learning purposes only and should not be interpreted as financial advice. It is important to consult with a qualified financial advisor before making any investment decisions. Tweets neither advice nor endorsement.

MIDCAP NIFTY S/R for 10/6/24Support and Resistance Levels: In technical analysis, support and resistance levels are significant price levels where buying or selling interest tends to be strong. They are identified based on previous price levels where the price has shown a tendency to reverse or find support.
Support levels are represented by the green line and green shade, indicating areas where buying interest may emerge to prevent further price decline.
Resistance levels are represented by the red line and red shade, indicating areas where selling pressure may arise to prevent further price increases. Traders often consider these levels as potential buying or selling opportunities.
Breakouts: Breakouts occur when the price convincingly moves above a resistance level (red shade) or below a support level (green shade). A bullish breakout above resistance suggests the potential for further price increases, while a bearish breakout below support suggests the potential for further price declines. Traders pay attention to these breakout signals as they may indicate the start of a new trend or significant price movement.
Disclosure: I am not SEBI registered. The information provided here is for learning purposes only and should not be interpreted as financial advice. It is important to consult with a qualified financial advisor before making any investment decisions. Tweets neither advice nor endorsement.

Trend rastudy("Trend Rainbow", overlay=true)
sae = input(true, title="Show Aggressive Entry?, Or Use as Alert To Potential Conservative Entry?")
sce = input(true, title="Show Conservative Entry?")
st = input(true, title="Show Trend Arrows at Top and Bottom of Screen?")
def = input(false, title="Only Choose 1 - Either Conservative Entry Arrows or 'B'-'S' Letters")
pa = input(true, title="Show Conservative Entry Arrows?")
sl = input(false, title="Show 'B'-'S' Letters?")
//EMA Definitions
emaSlow = ema(close, 62)
emaFast = ema(close, 38)
//Aggressive Entry or Alert To Potential Trade
pullbackUpT() => emaFast > emaSlow and close < emaFast
pullbackDnT() => emaFast < emaSlow and close > emaFast
//Conservative Entry Code For Highlight Bars
entryUpT() => emaFast > emaSlow and close < emaFast and close > emaFast
entryDnT() => emaFast < emaSlow and close > emaFast and close < emaFast
//Conservative Entry True/False Condition
entryUpTrend = emaFast > emaSlow and close < emaFast and close > emaFast ? 1 : 0
entryDnTrend = emaFast < emaSlow and close > emaFast and close < emaFast ? 1 : 0
//Define Up and Down Trend for Trend Arrows at Top and Bottom of Screen
upTrend = emaFast >= emaSlow
downTrend = emaFast < emaSlow
//Definition for Conseervative Entry Up and Down PlotArrows
codiff = entryUpTrend == 1 ? entryUpTrend : 0
codiff2 = entryDnTrend == 1 ? entryDnTrend : 0
//Color definition for Moving Averages
col = emaFast > emaSlow ? lime : emaFast < emaSlow ? red : yellow
//Moving Average Plots and Fill
p1 = plot(emaSlow, title="Slow MA", style=linebr, linewidth=4, color=col)
p2 = plot(emaFast, title="Slow MA", style=linebr, linewidth=2, color=col)
fill(p1, p2, color=silver, transp=50)
//Aggressive Entry, Conservative Entry Highlight Bars
barcolor(sae and pullbackUpT() ? yellow : sae and pullbackDnT() ? yellow : na)
barcolor(sce and entryUpT() ? aqua : sce and entryDnT() ? aqua : na)
//Trend Triangles at Top and Bottom of Screen
plotshape(st and upTrend ? upTrend : na, title="Conservative Buy Entry Triangle",style=shape.triangleup, location=location.bottom, color=lime, transp=0, offset=0)
plotshape(st and downTrend ? downTrend : na, title="Conservative Short Entry Triangle",style=shape.triangledown, location=location.top, color=red, transp=0, offset=0)
//Plot Arrows OR Letters B and S for Buy Sell Signals
plotarrow(pa and codiff ? codiff : na, title="Up Entry Arrow", colorup=lime, maxheight=30, minheight=30, transp=0)
plotarrow(pa and codiff2*-1 ? codiff2*-1 : na, title="Down Entry Arrow", colordown=red, maxheight=30, minheight=30, transp=0)
plotchar(sl and codiff ? low - tr : na, title="Buy Entry", offset=0, char='B', location=location.absolute, color=lime, transp=0)
plotchar(sl and codiff2 ? high + tr : na, title="Short Entry", offset=0, char='S', location=location.absolute, color=red, transp=0)

NIFTY MIDCAP S/R for 4/6/24Support and Resistance Levels: In technical analysis, support and resistance levels are significant price levels where buying or selling interest tends to be strong. They are identified based on previous price levels where the price has shown a tendency to reverse or find support.
Support levels are represented by the green line and green shade, indicating areas where buying interest may emerge to prevent further price decline.
Resistance levels are represented by the red line and red shade, indicating areas where selling pressure may arise to prevent further price increases. Traders often consider these levels as potential buying or selling opportunities.
Breakouts: Breakouts occur when the price convincingly moves above a resistance level (red shade) or below a support level (green shade). A bullish breakout above resistance suggests the potential for further price increases, while a bearish breakout below support suggests the potential for further price declines. Traders pay attention to these breakout signals as they may indicate the start of a new trend or significant price movement.
Disclosure: I am not SEBI registered. The information provided here is for learning purposes only and should not be interpreted as financial advice. It is important to consult with a qualified financial advisor before making any investment decisions. Tweets neither advice nor endorsement.

MIDCAP NIFTY S/R for 3/6/24Support and Resistance Levels: In technical analysis, support and resistance levels are significant price levels where buying or selling interest tends to be strong. They are identified based on previous price levels where the price has shown a tendency to reverse or find support.
Support levels are represented by the green line and green shade, indicating areas where buying interest may emerge to prevent further price decline.
Resistance levels are represented by the red line and red shade, indicating areas where selling pressure may arise to prevent further price increases. Traders often consider these levels as potential buying or selling opportunities.
Breakouts: Breakouts occur when the price convincingly moves above a resistance level (red shade) or below a support level (green shade). A bullish breakout above resistance suggests the potential for further price increases, while a bearish breakout below support suggests the potential for further price declines. Traders pay attention to these breakout signals as they may indicate the start of a new trend or significant price movement.
Disclosure: I am not SEBI registered. The information provided here is for learning purposes only and should not be interpreted as financial advice. It is important to consult with a qualified financial advisor before making any investment decisions. Tweets neither advice nor endorsement.
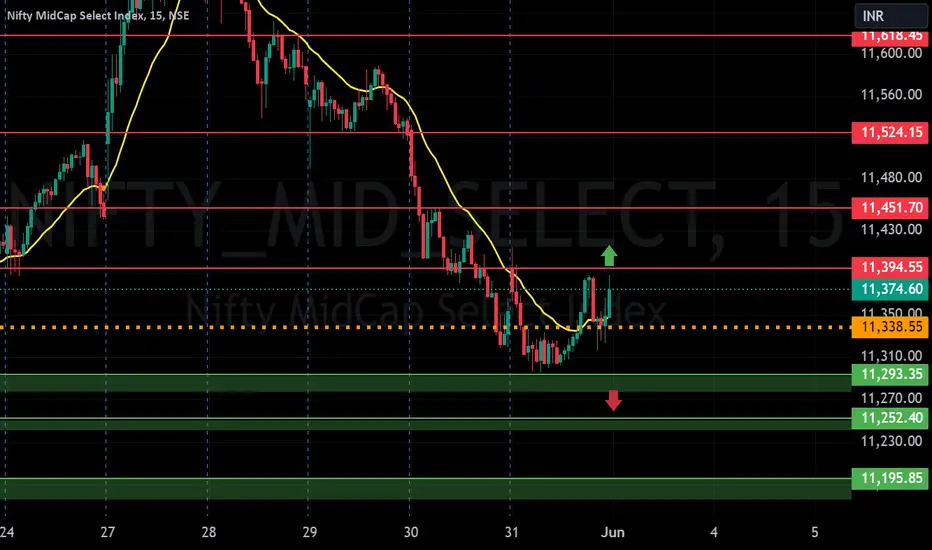
NIFTY MIDCAP S/R for 27/5/24Support and Resistance Levels: In technical analysis, support and resistance levels are significant price levels where buying or selling interest tends to be strong. They are identified based on previous price levels where the price has shown a tendency to reverse or find support.
Support levels are represented by the green line and green shade, indicating areas where buying interest may emerge to prevent further price decline.
Resistance levels are represented by the red line and red shade, indicating areas where selling pressure may arise to prevent further price increases. Traders often consider these levels as potential buying or selling opportunities.
Breakouts: Breakouts occur when the price convincingly moves above a resistance level (red shade) or below a support level (green shade). A bullish breakout above resistance suggests the potential for further price increases, while a bearish breakout below support suggests the potential for further price declines. Traders pay attention to these breakout signals as they may indicate the start of a new trend or significant price movement.
Disclosure: I am not SEBI registered. The information provided here is for learning purposes only and should not be interpreted as financial advice. It is important to consult with a qualified financial advisor before making any investment decisions. Tweets neither advice nor endorsement.
NIFTYSELECTMIDCAP: Warning or WarmingWe did post this elsewhere, cluster of moving averages, confronting the space.
The incremental negative divergence is the hurdle.
What is more important, occasional profit taking is far healthier than what is understood.
In that sense, we are due for one. Yesterday fall is it warming for bigger fall, or the rise post the fall warming for a rise.
One has to wait and see. Suffice to note, the confluence of the supply zone, the exponential moves in many of its components, negative divergence. Clearly for incremental moves this can unfold a challenging place.
That said market may stretch before the correction, that can be far severe and swift.
11200-11400 can suffice near term range.
India NIFTY Mid Cap Select Index - $NIFTY_MIThis is one of the individual charts on this weeks MAcro Monday48
The India NIFTY Midcap Select Index is a stock market index that represents the performance of 25 mid-sized companies listed on the National Stock Exchange (NSE) in India. Stocks are selected from the Nifty Midcap 150 index based on availability for trading in the Futures & Options segment, market cap and average daily turnover. Stock weights are based on free-float market capitalization.
Here are the top 5 holdings of the NIFTY Midcap Select Index along with percentage allocations and brief descriptions:
1. Indian Hotels Co. Ltd (7.1%): IHCL and its subsidiaries bring together a group of brands that offer a fusion of warm Indian hospitality and world-class service. These include Taj – the iconic brand for discerning travelers, SeleQtions, Vivanta, Ginger, and amã Stays & Trails.
2. Persistent Systems Ltd (5.69%): Persistent Systems is a global company specializing in digital engineering and enterprise modernization services. They offer solutions in banking, financial services, healthcare, life sciences, and technology sectors.
3. Cummins India Ltd (5.65%): Cummins designs, manufactures, sells, and services diesel and alternative fuel engines, generators, and related components. They are known for their innovation in power solutions and corporate responsibility.
4. Lupin Ltd (5.40%): Lupin is an Indian multinational pharmaceutical company and one of the largest generic pharmaceutical companies by revenue globally. Their key focus areas include pediatrics, cardiovascular, anti-infectives, diabetology, asthma, and anti-tuberculosis.
5. Housing Development Finance Corporation Asset Management Company Ltd (5.21%): HDFC AMC operates as an investment management firm, offering portfolio management and advisory services to individuals, institutions, trusts, private funds, charitable organizations, and investment companies in India.
Please note that these holdings are subject to change over time based on market conditions or fund manager decisions, however this is on the 2024 prospectus.
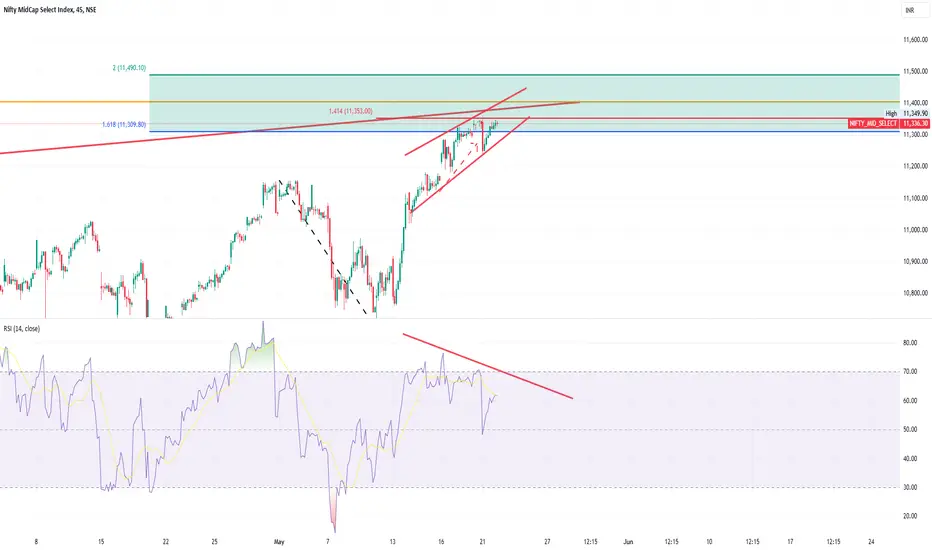
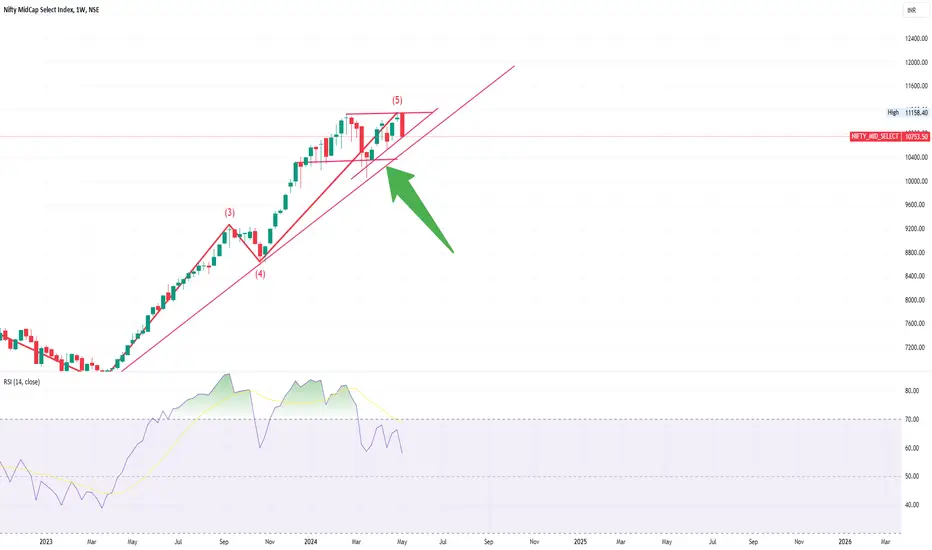
- The India NIFTY Mid Cap Select Index chart is more promising than the Ishares MSCI India ETF.
- There is a defined upward channel under which the 21 week SMA is providing support.
- We have broken recent highs, local resistance and a have a DSS Bressert Cross turning up. All three are bullish signals.
- A great risk reward set up is available here at 11:1. You can alter this to suit your risk tolerance or how long you want to remain in the trade. I would be inclined to lower the stop because the RR is weighted heavily to the upside.
- It is possible that we get a retest of the breakout area also, but given the DSS Bressert Cross and upwards momentum, I lean more directly bullish.
There is a currency risk with the second trade in the NIFTY Mid Cap Select Index as it is denominated in the Indian Rupee (INR) which has been on a long term decline against the USD since Aug 2011. If we were to move to the bottom of the current long term pennant we could lose c.5% in currency devaluation in this trade. This could happen over a couple of months, so its something to keep an eye on.
Here is the INR/USD Chart.

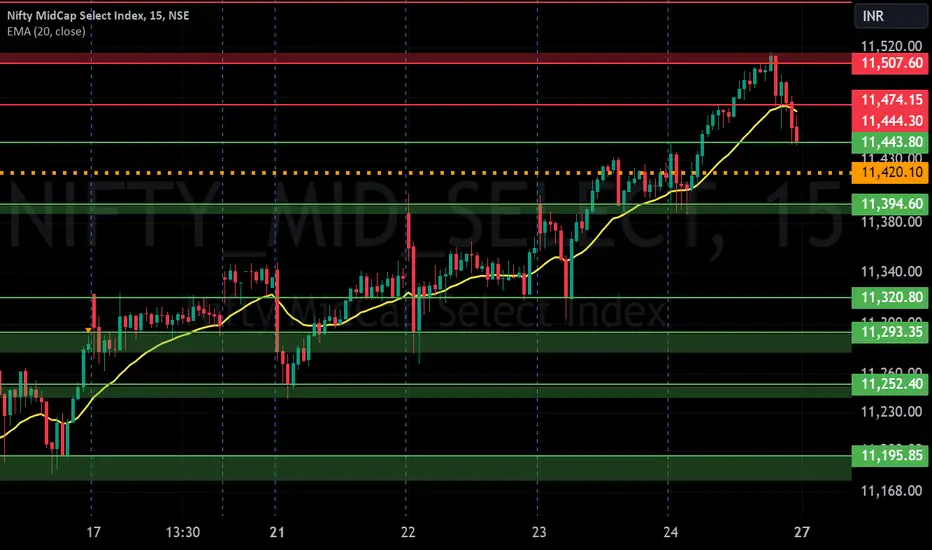
MIDCAP NIFTY S/R for 17/5/24Support and Resistance Levels: In technical analysis, support and resistance levels are significant price levels where buying or selling interest tends to be strong. They are identified based on previous price levels where the price has shown a tendency to reverse or find support.
Support levels are represented by the green line and green shade, indicating areas where buying interest may emerge to prevent further price decline.
Resistance levels are represented by the red line and red shade, indicating areas where selling pressure may arise to prevent further price increases. Traders often consider these levels as potential buying or selling opportunities.
Breakouts: Breakouts occur when the price convincingly moves above a resistance level (red shade) or below a support level (green shade). A bullish breakout above resistance suggests the potential for further price increases, while a bearish breakout below support suggests the potential for further price declines. Traders pay attention to these breakout signals as they may indicate the start of a new trend or significant price movement.
Disclosure: I am not SEBI registered. The information provided here is for learning purposes only and should not be interpreted as financial advice. It is important to consult with a qualified financial advisor before making any investment decisions. Tweets neither advice nor endorsement.
MIDCAP NIFTY S/R for 15/5/24Support and Resistance Levels: In technical analysis, support and resistance levels are significant price levels where buying or selling interest tends to be strong. They are identified based on previous price levels where the price has shown a tendency to reverse or find support.
Support levels are represented by the green line and green shade, indicating areas where buying interest may emerge to prevent further price decline.
Resistance levels are represented by the red line and red shade, indicating areas where selling pressure may arise to prevent further price increases. Traders often consider these levels as potential buying or selling opportunities.
Breakouts: Breakouts occur when the price convincingly moves above a resistance level (red shade) or below a support level (green shade). A bullish breakout above resistance suggests the potential for further price increases, while a bearish breakout below support suggests the potential for further price declines. Traders pay attention to these breakout signals as they may indicate the start of a new trend or significant price movement.
Disclosure: I am not SEBI registered. The information provided here is for learning purposes only and should not be interpreted as financial advice. It is important to consult with a qualified financial advisor before making any investment decisions. Tweets neither advice nor endorsement.

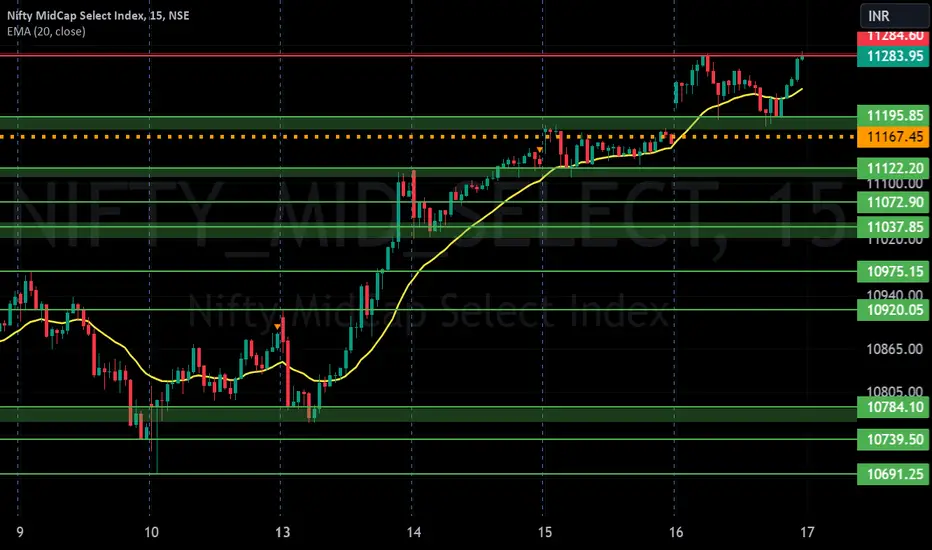
NIFTY MIDCAP S/R for 13/5/24Support and Resistance Levels: In technical analysis, support and resistance levels are significant price levels where buying or selling interest tends to be strong. They are identified based on previous price levels where the price has shown a tendency to reverse or find support.
Support levels are represented by the green line and green shade, indicating areas where buying interest may emerge to prevent further price decline.
Resistance levels are represented by the red line and red shade, indicating areas where selling pressure may arise to prevent further price increases. Traders often consider these levels as potential buying or selling opportunities.
Breakouts: Breakouts occur when the price convincingly moves above a resistance level (red shade) or below a support level (green shade). A bullish breakout above resistance suggests the potential for further price increases, while a bearish breakout below support suggests the potential for further price declines. Traders pay attention to these breakout signals as they may indicate the start of a new trend or significant price movement.
Disclosure: I am not SEBI registered. The information provided here is for learning purposes only and should not be interpreted as financial advice. It is important to consult with a qualified financial advisor before making any investment decisions. Tweets neither advice nor endorsement.
NIFTY_MID_SELECTSupport and Resistance Levels: In technical analysis, support and resistance levels are significant price levels where buying or selling interest tends to be strong. They are identified based on previous price levels where the price has shown a tendency to reverse or find support.

NIFTYMIDCAP: Blind Spot! The driver is confident, the curve is head, experience in hand, passengers slightly worried, but trust carries them.
Head on Collusion, just missing the vehicle on the curve, we all experience? The Only rule that I impose, never overtake when there are bends, watch the road, there are no broken lines at that point. But who cares, lines or no lines!
No, I am not talking about the road, the road to this. Not a broader composition, but that is the sense I get when I look at this.
Add a dash of end of wave 4, wave A looks impulse and arguably so. The Large Green Arrow is the lifeline for the end of Wave A that is around 10350-400 area. Not a big deal considering we moved 300 points so far in this week.
Today is Friday, the hope trade is for sure to emerge, I have no idea why the move is unfolding or the reasons for it, that is for the reporter to write the story. Suffice to say look Five, Make Life!
Supports 10680-10630-10580
Supply 10800-10830-10880
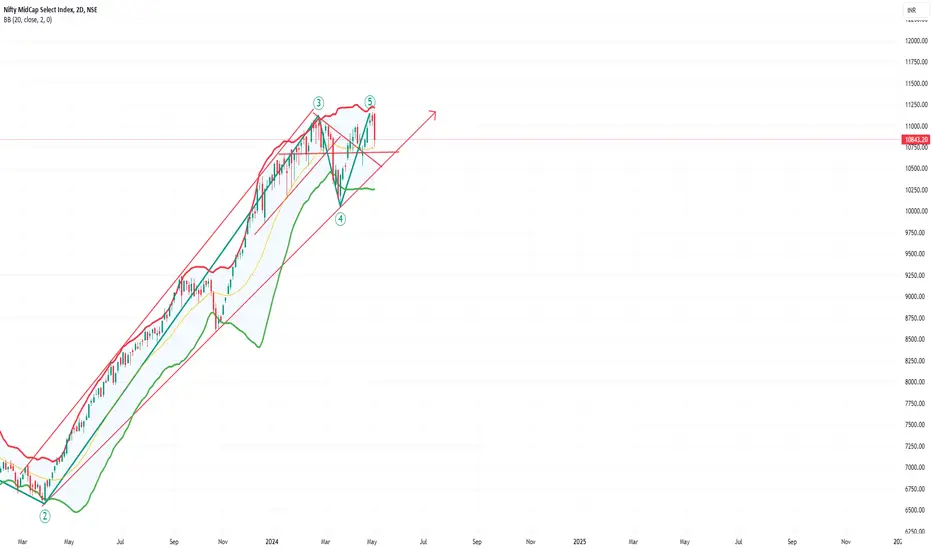
MIDCAP: Held in the Mid -BBSharp, quick, small green to start, deeper red in the end.
Markets quick, usually this space is building volumes and now stabilising. Many parts of this are parabolic moves.
One can question is this ABC of 4 or end of 5. We need to wait and see. We have labelled as truncated wave 5. This calls for one move below the 4, that is nothing but breaking the trendline.
Alternative scenarios always come in handy. When you hold them a. either you don't commit, b. even if you commit you quickly exit small gain or loss. c. capital is appropriately allocated and efficiently.
Fallen a lot is not a word one chooses during the fifth wave. Even if one considers ABC, we are in C same logic holds.
We cannot consider this as fourth wave as we hit the new high. Else it would have fallen. We also cannot label it as Flat (Regular as the correction is more than 100%). All in all, probability of end of wave 5. The larger ABC in motion, we are start of the A wave.
Suffice, 11050 caps for move below 10700 (short term some bounce around the MID BB is not ruled out.
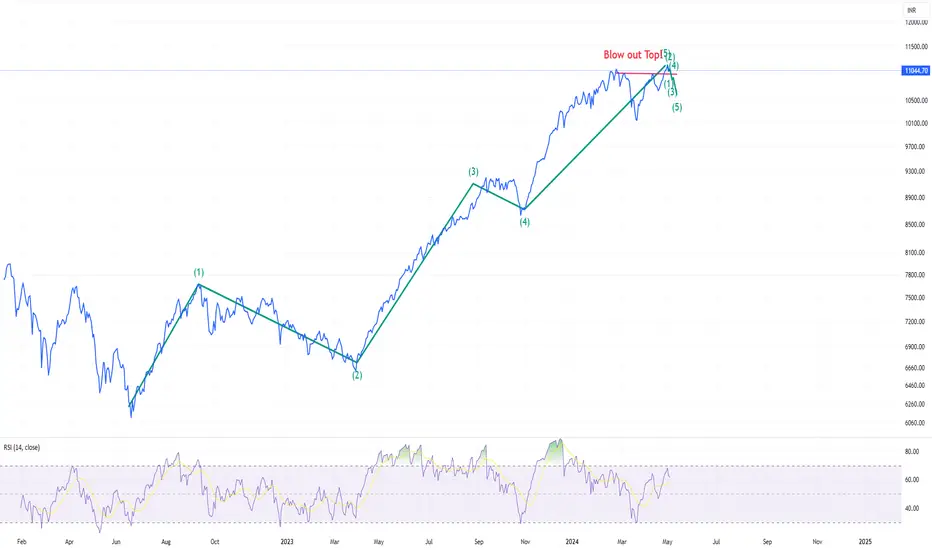
SELECTMIDCAP: It is not the mid, it is the beginningIt's all in the proof, the proof is the price, the price is what you pay.
I's are yes, Price is perfect, see them to believe them. Don't cry for stop loos hunting, someone from somewhere else shooting, a trap, a hope a la la views.
Carve out, crave out, cut out, and shut out!
Nifty shows the end of 5, this too. A classic blow out top. A failed Inv HnS. We are in impulse wave down as part of the larger ABC correction.
Some of the constituents of this index shown big move, they would continue. Sum of the parts is larger than the whole, that is relevant both up move and down move.
Choice of tools, call writing, put buying or the strategy, or the plain individual spaces, or the futures here.............but the Risk Managment remains irrespective of the tools one chooses.
Don't meddle in the Mid, it is in the beginning..............look at the waves, ride them
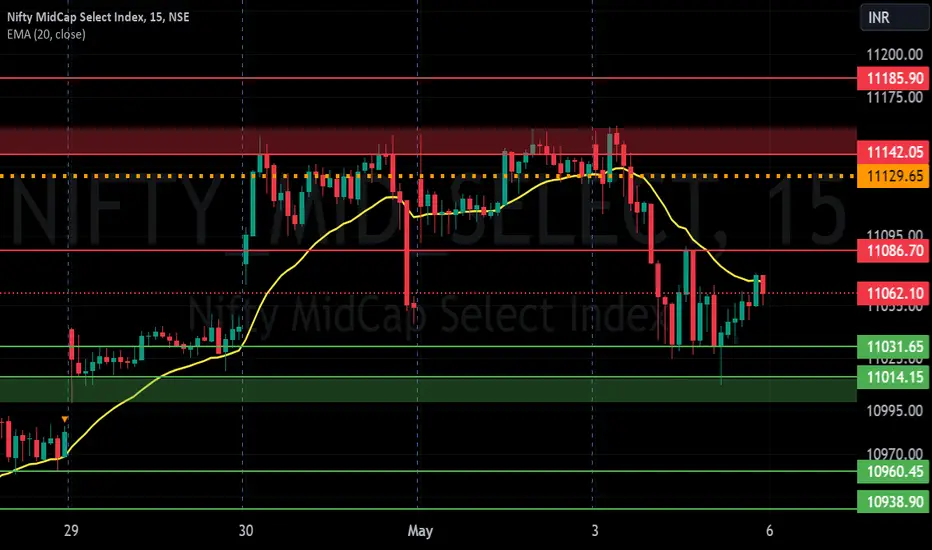
MIDCAP NIFTY S/R for 6/5/24Support and Resistance Levels: In technical analysis, support and resistance levels are significant price levels where buying or selling interest tends to be strong. They are identified based on previous price levels where the price has shown a tendency to reverse or find support.
Support levels are represented by the green line and green shade, indicating areas where buying interest may emerge to prevent further price decline.
Resistance levels are represented by the red line and red shade, indicating areas where selling pressure may arise to prevent further price increases. Traders often consider these levels as potential buying or selling opportunities.
Breakouts: Breakouts occur when the price convincingly moves above a resistance level (red shade) or below a support level (green shade). A bullish breakout above resistance suggests the potential for further price increases, while a bearish breakout below support suggests the potential for further price declines. Traders pay attention to these breakout signals as they may indicate the start of a new trend or significant price movement.
Disclosure: I am not SEBI registered. The information provided here is for learning purposes only and should not be interpreted as financial advice. It is important to consult with a qualified financial advisor before making any investment decisions. Tweets neither advice nor endorsement.