NMDC BuyNMDC break above channel pattern. Also, there is a break above of a triangle pattern. Buy @CMP (73) with SL of 69 and Target of 80, 90 & 95.
NMDC trade ideas

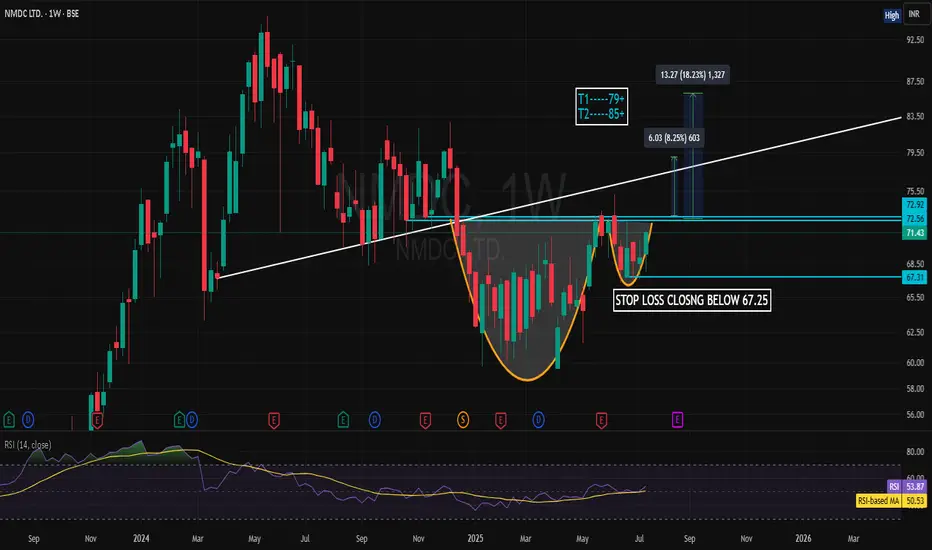
cup and handle patternnmdc cup and handle formation on weekly time frame stoploss closing below 67.25
target t1--79+
t2--85+
NMDC – Bullish Trend Reversal with Breakout Setup📈 NMDC – Bullish Trend Reversal with Breakout Setup (For Study Purpose Only)
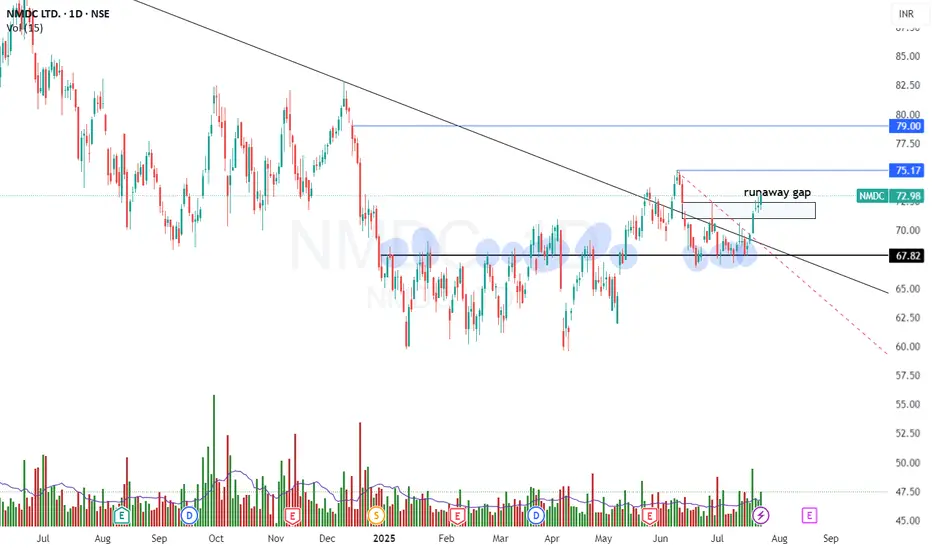
NMDC has displayed a bullish trend reversal following a prolonged 6-month consolidation between ₹60–68. The stock broke out decisively above this range and has since retested the breakout zone successfully, confirming it as a strong support.
Subsequently, the stock entered a 1-month sideways consolidation between ₹67–73, forming a tight base—typically a sign of strength and potential continuation.
🔍 Technical Highlights:
✅ Breakout Zone: ₹68 (now acting as strong support)
🔁 Retest Completed: Post-breakout pullback respected support
🧱 Current Range: ₹70–73 (tight consolidation near highs)
📊 Volume: Gradual increase near resistance, indicating accumulation
📈 RSI & MACD: RSI climbing steadily; MACD shows bullish crossover
🎯 Trade Setup (for study purpose only):
Watch for strength above: ₹73
Stop-Loss (SL): ₹69
Targets: ₹75 (initial), ₹80–82 (extended)
📌 Note:
This analysis is intended for educational and study purposes only. Always conduct your own due diligence or consult a certified financial advisor before making any investment decisions.
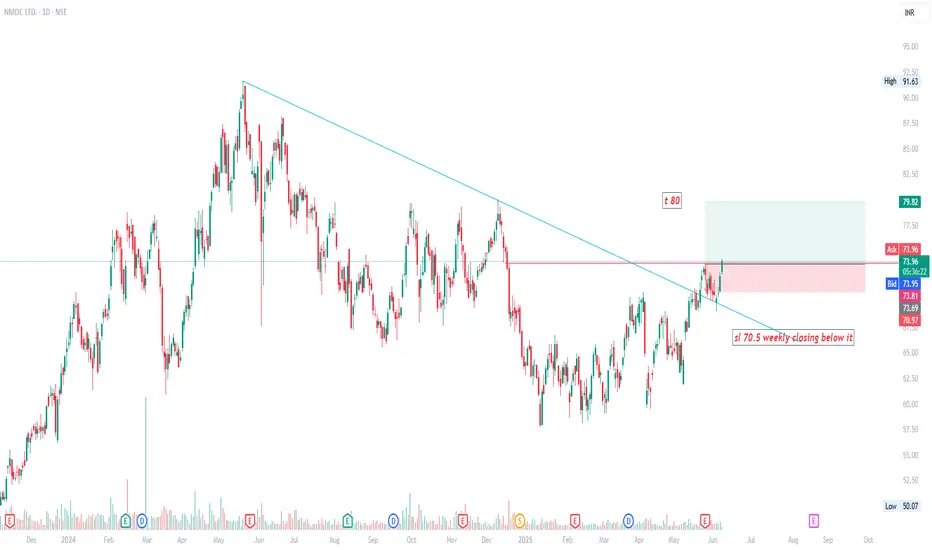
NMDC LONG NMDC CMP 74 T-80 SL 71.5 Weekly closing below it
personal bias as i hold it. not a trading call just a educational idea.
A l0ok at NMDC : Metal Rally If it sustain above 69 then 81 is the target.
SL 60
simple box breakout.
Good New..!! Indian govt. imposed tarrif on steel faced.
** This is not buy sell recommendation- purely for study purpose.
TATA STEELalso looking good

NMDCNSE:NMDC
Note :
1. One should go long with a Stop Loss, below the Trendline or the Previous Swing Low.
2. Risk :Reward ratio should be minimum 1:2.
3. Plan your trade as per the Money Management and Risk Appetite.
Disclaimer :
>You are responsible for your profits and loss.
>The idea shared here is purely for Educational purpose.
>Follow back, for more ideas and their notifications on your email.
>Support and Like incase the idea works for you.

Review and plan for 28th May 2025 Nifty future and banknifty future analysis and intraday plan.
Quarterly results.
This video is for information/education purpose only. you are 100% responsible for any actions you take by reading/viewing this post.
please consult your financial advisor before taking any action.
----Vinaykumar hiremath, CMT

NMDC Weak - Possible to reach 150 / 135NMDC has crossed lakshman rekha line to confirm formation of Shark/cypher or 5-0 pattern.
Close below 190 on weekly basis will take it to 150 /135.

[Diary] NMDC Stock SplitThe issue arises when you rely solely on a webhook as your exit strategy, especially in scenarios like today's with NMDC. TradingView’s webhook mechanism, while efficient for many tasks, can create havoc if used indiscriminately for entries, exits, or modifications without human oversight. Today, NMDC is generating a cascade of signals—short, long, SL hit, TGT hit, and more—because the platform hasn’t yet adjusted for the stock split properly. Algorithms dependent on such incomplete or inaccurate data can spiral into a disaster, executing trades based on flawed inputs. This is a clear reminder to always validate your data sources and integrate fallback mechanisms to avoid such pitfalls.
Moreover, this kind of situation can lead to reverse signals that algorithms tuned for mean reversion might latch onto, seeing the seemingly favorable risk-reward (Rr) ratio. However, because the source data lacks significant market influence, the resulting trades could prove inconsequential or even misleading. The broader market may ignore such anomalies, leaving your algorithm chasing shadows.
This highlights the importance of understanding market psychology and herd behavior. Traders often move in predictable patterns, and seemingly unrelated factors can trigger unexpected market reactions. For example, Berkshire Hathaway’s stock once saw price spikes correlating with the release of Anne Hathaway’s movies—not because of any fundamental connection, but due to name-based algorithmic trading. Such quirks underscore the need to approach automated trading with caution, ensuring a robust system that accounts for anomalies and prevents over-reliance on any single data source or strategy.

Plan for 12th November 2024Nifty future and banknifty future analysis and intraday plan.
Result analysis.
This video is for information/education purpose only. you are 100% responsible for any actions you take by reading/viewing this post.
please consult your financial advisor before taking any action.
----Vinaykumar hiremath, CMT

NMDC - LONGNSE:NMDC Weekly parabolic formation may resume new bullish momentum from current levels. Macd also shows price will zoom in near term.

NMDC--Long Oppurtunity ??A strong impulsive move is observed from the support area 200 levels,
A corrective pullback is observed to the support levels, and with consolidation price creates a demand zone at 205-210 levels and giving us pullback to enter in long side, look for long opportunities in this stock for upside continuation.
If price takes the liquidity on bottom side, add more quantity to the long side.

NMDC : S2ING TRADING BIG TA4GET IS EXPEXTING MORE THAN 30%.See the chart and understand the strength of this stock.
Metal sector is verge of breakout. NMDC Good choice .this is given readout of trendline .retested and now moving with positive RSI.


NMDC NSE 12Y 10M Breakout on MTFNMDC had Broken out this @12Year high in Feb 24 forming a Rounding Bottom Curve , since then it has hovered around this level of 234 since then. There has been a renewed buying at this level again sustaining above 242 a strong support on DTF.
Volumes have been growing consistently for the past week after its Ex dividend on 17th Sept.
ADD quantity when it closes above 285 WTF.
Entry above 245 DTF close, First Target 286.. SL 204


#NMDC Beautiful Pattern | 20% Trade Potential#NMDC Beautiful Patter | 20% Trade Potential
Please look at the chart for entry details.
Upside potential of 20% to 35%

NMDCC Downtrend: The stock is currently in a downward price trend.
Support Level: The price is finding support at the 210 level, meaning it has struggled to fall below this price.
Resistance Breakout: If the price breaks above the 210 resistance level, a positive trend reversal could occur.
Retest: After breaking the resistance, the price might temporarily pull back (retest) the 210 level before continuing its upward movement.
Target Price: The potential target price for the upward move is 280.
I'm not a SEBI-registered analyst. All posts and levels shared are just for educational purposes. I'm not responsible for any losses or profits. No claims, all rights reserved

NMDC LtdNMDC Ltd
CMP 220
Currently up from major support zone
Trying to break channel 5th time
Entry only above trendline break

NMDCNMDC – Daily TF
Downward wedge breakout possible. If happens then favorable RR for an upside movement from 222 onwards. SL of 200 will be good for looking towards 270 levels.
RSI divergence did take place and confirmed also.
Substantial volumes are the only thing missing.
Disclaimer –
I am not a SEBI REGISTERED person or analyst.
I am not responsible for anyone’s gains or losses.
I am doing this only to increase my knowledge and to learn.

NMDC....Time to Go Long for 30% ReturnNMDC Ltd is being recommended as a "buy" by several analysts, with expectations of a potential 20-30% upside in its stock price over the next 12 months. The company is focusing on increasing its production to 50 million tonnes by FY25, which is expected to drive revenue growth. Additionally, NMDC is expanding its presence in new minerals like lithium, positioning it for future growth opportunities.
However, risks such as changes in global iron ore prices and regulatory shifts could affect profitability. Overall, the stock is seen as having solid upside potential due to its production expansion and favorable market conditions.

NMDC 03-09-2024Happy learning with trading. I just shared my view. If correct give me one like. If not correct me.
Points to Note:
1) parallel channel and supports are good to take at entry point for long term.
2) if we seen good volume at 195-200 level we can add more for long term with SL of 185.
Disclaimer:
I am not a Registered Analyst with SEBI and it is only for educational purposes. Please consult your financial advisor before making any decision. I will not be responsible for any of your profits or losses.
