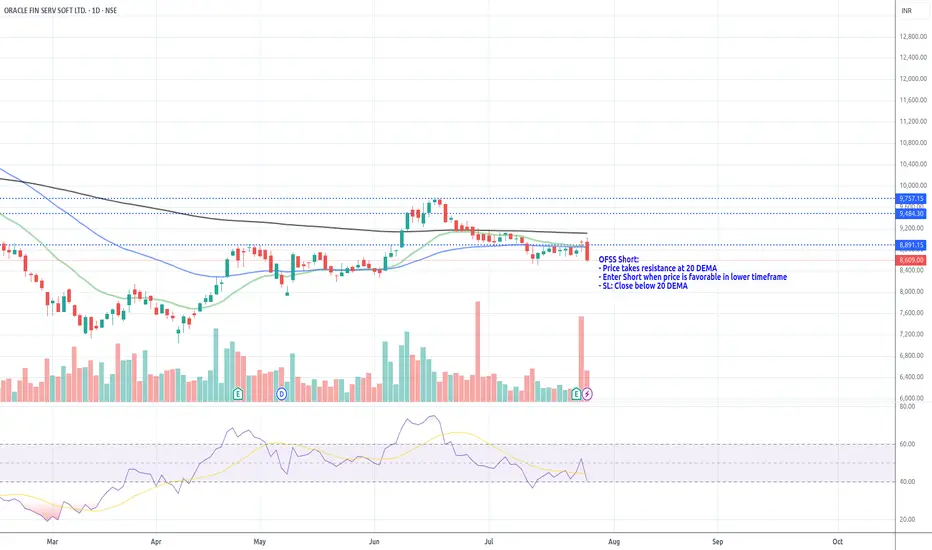
OFSS Short_Resistance @ 20 DEMAOFSS Short:
- Price takes resistance at 20 DEMA
- Enter Short when price is favorable in lower timeframe
- SL: Close below 20 DEMA
OFSS trade ideas
OFSS📈 Trade Plan (BUY Setup)
Parameter Value
Entry Price 8565
Stop Loss (SL) 8365
Risk 200 pts
Target (Reward) 10234 pts
Target Price 18799
Risk:Reward (RR) 51.2
🔎 Reference Points
Last High: 12809
Last Low: 6819
Point Variation: 5990
✅ Key Takeaways
All trend indicators point strongly bullish from long to short term.
Entry at 8565 with a tight SL of 8365 offers a very high Risk:Reward ratio of 51.2, indicating a strong asymmetric trade opportunity.
The target of 18799 is significantly above the current price, which might be aggressive—make sure this aligns with your trading timeframe and risk profile.
The entry is supported by multiple demand zones across MTF and ITF levels, particularly around the 8500–8600 range.
🔢 Gann Levels Summary (Key Psychological Zones)
Gann Level Value
Long Above 7562
Short Below 7300
🔍 Interpretation & Integration with MTF Trade Plan
Current Entry in Trade Plan:
Your buy entry is at 8565, well above the Gann long trigger of 7562.
This confirms the bullish continuation above the Gann breakout level — indicating you're entering in the confirmed strength zone.
Gann Short Trigger:
7300 is significantly below current levels and also below the last low (6819).
If price ever breaks below this, it invalidates the bullish structure and can signal a trend reversal.
Gann as Confirmation Tool:
Use Gann level of 7562 as a reconfirmation level — if price dips but remains above this, bulls are still in control.
A retest of the 7562 level can offer re-entry opportunities with tighter stop-loss for better risk management.
✅ Conclusion
Your buy trade at 8565 is well-aligned with all major MTF, demand zones, and above Gann bullish breakout level of 7562.
As long as price stays above 7562, you’re in a strong uptrend zone.
If price falls below 7300, watch for structural weakness or reversal cues.
🔍 MTF Analysis Summary
All timeframes (HTF, MTF, ITF) indicate a strong upward trend.
📊 High Time Frame (HTF) - Long-Term Trend
Period Trend Analysis Proximal Distal Avg
Yearly UP OFSS Yearly Demand 4253 4020 4,137
Half-Yearly UP OFSS 6-Month Demand - RALLY RALLY 9737 9036 9,387
Quarterly UP Breakout + Quarterly Demand 4253 3510 3,882
HTF Avg 6081 5522 5802
🗓️ Mid Time Frame (MTF) - Medium-Term Trend
Period Trend Analysis Proximal Distal Avg
Monthly UP Monthly Demand (DMIP) 7736 6804 7,270
Weekly UP Weekly Demand (DMIP) 8661 8365 8,513
Daily UP Daily Demand (BUFL) 8590 8267 8,429
MTF Avg 8329 7812 8071
🕒 Intraday Time Frame (ITF) - Short-Term Trend
Period Trend Analysis Proximal Distal Avg
240 Min UP Demand Zone (DMIP) 8470 8267 8,369
180 Min UP Demand Zone (DMIP) 8491 8267 8,379
60 Min UP Demand Zone (DMIP) 8565 8544 8,555
ITF Avg 8509 8359 8434
Oracle Financial Services SellOracle Financial Services breaks below trend line. Sell @CMP (8885) with Sl of 9150 and target of 8350, 7900 & 7300.

ofss rsi breakout cmp : 9030
stoploss : weekly closing below 8780
target :10400
Disclaimer:
This publication is strictly for educational and informational purposes only and should not be construed as investment advice, a trading recommendation, or a solicitation to buy or sell any securities. The analysis and views expressed are solely my personal opinions and may contain inherent biases. I may or may not have a position in the securities discussed at the time of writing. Please do your own research and consult with a qualified financial advisor before making any trading or investment decisions. Trading and investing in financial markets involves substantial risk, and you are solely responsible for your own decisions and outcomes.

OFSSOFSS
watch above levels. green line is our entry, redline is our SL.
DISCLAIMER : I am NOT a SEBI registered advisor or a financial adviser. All the views are for educational purpose only.


OFSSTrade Plan ENTRY-1
Entry-1 7984
Entry-2 7418
SL 7353
RISK 631
REWARD 5868
Target as per Entry 13852
RR 9.3
Last High 13221
Last Low 7353
OFSS
MTF MTF-Zone TREND MTF Analysis Logic Proximal Distal Average
HTF Yearly UP OFSSYearly Demand RR 5145 4280 4,713
HTF Half-Yearly UP OFSS6 Month Demand RR 4528 4528 4,528
HTF Qtrly UP OFSSQtrly Demand BUFL RR 5145 4280 4,713
HTF Average UP 4939 4363 4651
MTF Monthly UP OFSSMonthly Demand BUFL 7984 7368 7,676
MTF Weekly UP OFSSWeekly Demand BUFL 7984 7368 7,676
MTF Daily UP OFSSDaily Demand DMIP BUFL 7362 6850 7,106
MTF Average UP 7777 7195 7486
ITF 240M UP OFSS240Mn Demand BUFL 7418 7353 7,386
ITF 180M UP OFSS180 Mn Demand BUFL 7418 7353 7,386
ITF 60M UP OFSS60 Mn Demand BUFL 7418 7353 7,386
ITF Average UP 7418 7353 7386

OFSS Weekly | Bullish Harmonic Reversal & RSI Breakout | Short-T📈 Swing Trade Recommendation (Short-Term):
Buy Zone: ₹8,600–₹8,750 (on dips or on strength)
Target 1: ₹9,300 (initial resistance and round number)
Target 2: ₹10,200–₹10,500 (next harmonic resistance zone)
Stoploss: ₹8,050 (below recent swing low)
🔍 Technical Highlights:
Bullish Harmonic Structure forming with strong reversal from "C" to "D".
Volume breakout supports the current leg of momentum.
RSI bullish divergence and breakout confirms potential trend reversal.
For Education purpose only


OFSSOFSS
MTF Analysis
OFSSYearly Demand 4,528
OFSS 6 Month Demand 4,528
OFSSQtrly Demand BUFL 4,528
OFSSMonthly Demand 7,984
OFSSWeekly Demand 7,984
OFSSDaily Demand DMIP 7,578
ENTRY -1 Long 7,984.0
SL 7,075.0
RISK 909.0
Target as per Entry 19,325.0
RR 12.5
Last High 13,200.0
Last Low 7,075.0

OFSS Stock Analysis – Is a Reversal on the Horizon?🔍 **Current Price:** ₹7,328
📊 **Trend:** Downtrend with signs of potential support.
📌 **Key Technical Levels:**
✅ **Support Zone:** ₹7,200 – ₹7,188 (Holding strong)
✅ **Resistance Levels:** ₹8,569 (Fibonacci 23.6%), ₹9,394 (38.2%), ₹10,061 (50%)
✅ **Golden Zone:** ₹10,728 – ₹11,678 (61.8% - 78.6% Fib retracement)
📉 **Technical Indicators:**
✔ **Fibonacci Retracement Analysis** suggests a **pullback rally is possible** if the stock sustains above support.
✔ **200-Day Moving Average** is acting as resistance; breakout needed for trend reversal.
✔ **Risk-Reward Setup** indicates a bounce towards ₹10,000+ if momentum builds.
⚡ **Trade Plan:**
🎯 **Bullish Case:** Reversal confirmation above ₹7,400 could lead to ₹8,500-₹9,000 short term.
⚠ **Bearish Case:** Breakdown below ₹7,188 may push towards ₹6,558.
📢 **Traders Alert:** Keep an eye on volume and price action in the coming sessions! 🔥

Oracle financial services ( OFSS ) - SHORT TO MID-TERM ANALYSIS OFSS is looking reasonable and we can expect it to bottom out soon. Levels to watch on downside are
IMMEDIATE SUPPORT - 7081
IMP SHORT COVERING LEVELS -
1.) 6723
2.) 6326
Out of these levels we can expect it to form a probable low in short to mid term.
But if it shrugs this downtrend and starts to move forward then crucial levels on the upside would be 7677 it is a base level for upside . Upon sustaining this level we can expect it to move forward towards 8,000 range + . All levels are marked in the chart posted.
OFss at trend line support Respecting the trendline
but the break of the trendline may lead to short term downtrend of the stock

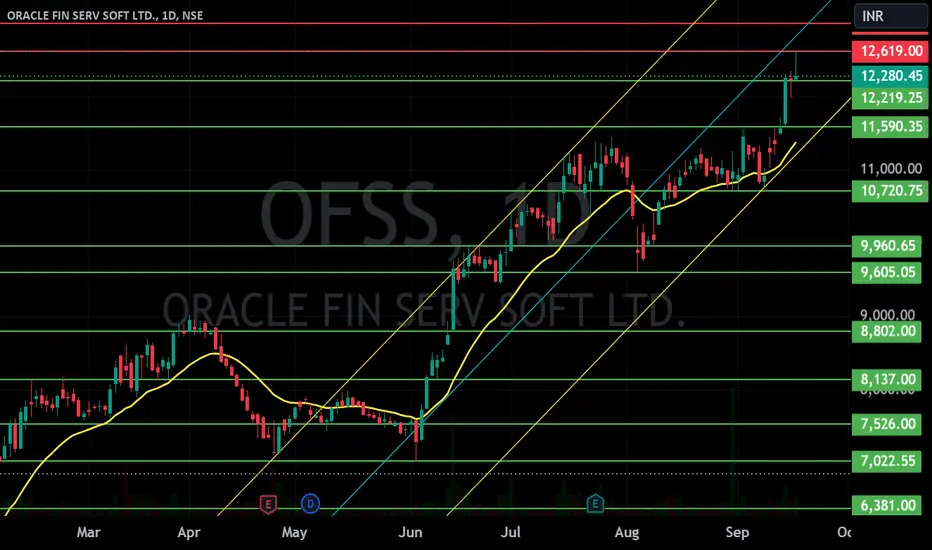
OFSS NEW ALL TIME HIGH INCOMING!!This chart illustrates the technical analysis of Oracle Financial Services Software Limited (OFSS) on a 4-hour timeframe. The price is currently trading around ₹12,510, consolidating near a critical resistance level of ₹12,650. A breakout above this level is required to confirm bullish momentum and unlock the potential upside towards the next target zones at ₹12,885, ₹13,130, and ₹13,450.
The Fibonacci retracement levels are plotted to identify significant support and resistance zones. The immediate bullish view remains intact as long as the price holds above ₹12,360 on a closing basis, as marked in red for invalidation. Failure to sustain above this level could trigger a correction or consolidation towards lower support zones, highlighted in yellow.
The chart's volume analysis suggests relatively lower trading volumes during the recent consolidation, indicating the need for stronger participation to validate the breakout. The green zone highlights the target range if a breakout occurs, aligning with Fibonacci levels and historical price action.
Traders should monitor the price action and volume closely, as any decisive move above ₹12,650 could provide a bullish continuation signal. Conversely, a drop below ₹12,360 may indicate a short-term reversal or pause in the uptrend.

OFSS ready to move upthis stock is highly bulish but it is in consolidation,now it seems will give us breakout,we should be carefull but can be taken trade as per this level.

OFSS new all time high incoming??#OFSS a move above 11550 would be a breakout and prove the breakdown as a fakeout.
Just like #DIXON this can go above 12600 in no time after the fakeout and hence should be on our radars.

OFSS can target 10,000 off here??#OFSS can retest this as a resistance and fall a bit further off here!
Can then target 10800, 10500 and 10300 off there with 11500 as invalidation.

OFSS S/R Support and Resistance Levels:
Support Levels: These are price points (green line/shade) where a downward trend may be halted due to a concentration of buying interest. Imagine them as a safety net where buyers step in, preventing further decline.
Resistance Levels: Conversely, resistance levels (red line/shade) are where upward trends might stall due to increased selling interest. They act like a ceiling where sellers come in to push prices down.
Breakouts:
Bullish Breakout: When the price moves above resistance, it often indicates strong buying interest and the potential for a continued uptrend. Traders may view this as a signal to buy or hold.
Bearish Breakout: When the price falls below support, it can signal strong selling interest and the potential for a continued downtrend. Traders might see this as a cue to sell or avoid buying.
20 EMA (Exponential Moving Average):
Above 20 EMA: If the stock price is above the 20 EMA, it suggests a potential uptrend or bullish momentum.
Below 20 EMA: If the stock price is below the 20 EMA, it indicates a potential downtrend or bearish momentum.
Trendline: A trendline is a straight line drawn on a chart to represent the general direction of a data point set.
Uptrend Line: Drawn by connecting the lows in an upward trend. Indicates that the price is moving higher over time. Acts as a support level, where prices tend to bounce upward.
Downtrend Line: Drawn by connecting the highs in a downward trend. Indicates that the price is moving lower over time. It acts as a resistance level, where prices tend to drop.
RSI: RSI readings greater than the 70 level are overbought territory, and RSI readings lower than the 30 level are considered oversold territory.
Combining RSI with Support and Resistance:
Support Level: This is a price level where a stock tends to find buying interest, preventing it from falling further. If RSI is showing an oversold condition (below 30) and the price is near or at a strong support level, it could be a good buy signal.
Resistance Level: This is a price level where a stock tends to find selling interest, preventing it from rising further. If RSI is showing an overbought condition (above 70) and the price is near or at a strong resistance level, it could be a signal to sell or short the asset.
Disclaimer:
I am not a SEBI registered. The information provided here is for learning purposes only and should not be interpreted as financial advice. Consider the broader market context and consult with a qualified financial advisor before making investment decisions.

ORACLE - Can it show us a miracle :)Chart is self explanatory. Already given a breakout.
Can we see 4700 / 5000 / 5500 ? Time will tell. Hoping for the best. Cheers.

sell at zone ~ intradayexpecting small fall from the zone . look for confirmation inside zone in smaller tf.
- good for intraday trade
- entry is strictly inside the zone
- SL is day close above zone
- for target draw fib retracement from C to latest swing high , use 0.236 fib as tgt 1 (safe place for intraday), 0.382 as tgt 2 (risk takers).
- don't trade , if u didn't get selling confirmation inside zone
- if day close is above this zone , this pattern becomes invalid , ignore this pick

OFSS10/06/2024
OFSS
CMP: 8406.25
Tragter : 9023-10127-10922
SL:7735
Information is only for study purpose
