OIL INDIA BUY VIEW OIL INDIA - BUY PROJECTION
Trade Setup :
Fundamental Analysis
Stock PE - 9.22
Industry PE - 20.7
Low Debt
Promoter Holding - 53 %
DII Holdings - 17 %
Regularly Paid Dividend - 2 %
Strong Fundamental - Stock Possible to Doubled - (Current - 474 ) (Target - 948 )
for Long term 5 years Hold
Next report date
—
Report period
—
EPS estimate
—
Revenue estimate
—
40.25 INR
65.51 B INR
325.12 B INR
543.91 M
About OIL INDIA LTD
Sector
Industry
CEO
Ranjit Rath
Website
Headquarters
Noida
Founded
1959
ISIN
INE274J01014
FIGI
BBG000GNBCV8
Oil India Ltd. is an investment holding company, which engages in the business of exploration, development and production of crude oil and natural gas, transportation of crude oil and production of LPG. It operates through the following segments: Crude Oil, Natural Gas, Liquefied Petroleum Gas, Pipeline Transportation, Renewable Energy, and Others. The company was founded on February 18, 1959 and is headquartered in Noida, India.
Related stocks

OIL LONG_Support @ 20/50/ 200 Daily EMAOIL Long:
- Price takes support at 20/50/ 200 Daily EMA
- Forms Higher low & movement shows good Volume
- Enter Long when the prices are favorable in the lower timeframe
- Target: 485
- SL: Close below 20 Daily EMA or today's low

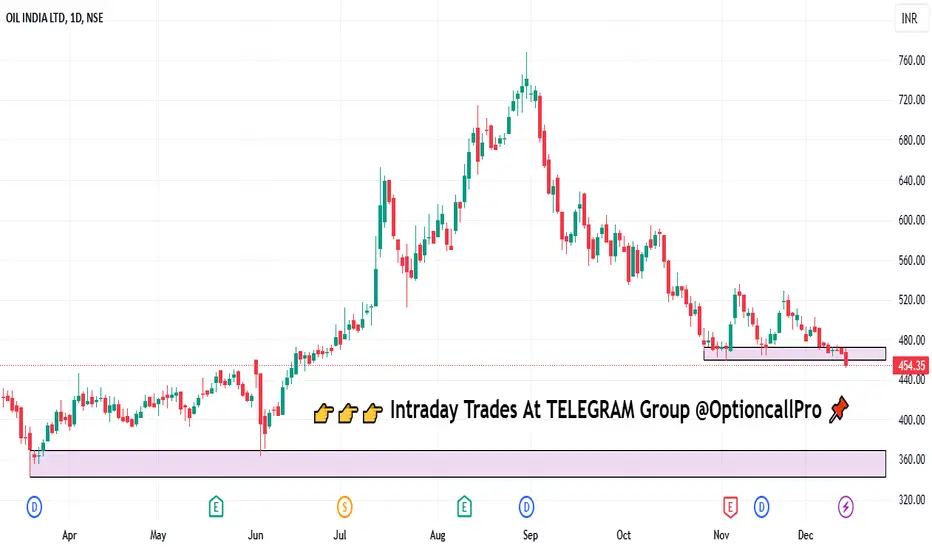
OIL Range Breakout with Strong Volume Confirmation Timeframe: Daily (1D)
📌 Chart Observed: Appears to be a stock forming higher lows after a strong recovery from
bottom.
🔍 Pattern Noticed:
• Price breakout above 200 EMA – typically a strong trend reversal signal.
• Today’s candle shows a bullish engulfing move with a volume spike, indicat

OIL INDIA - FOR SWING AND INTRADAY TRADEOil india is looking good in its Daily time frame.
Today price has given a breakout in Daily time frame.
Current closing price is 465 next target can be 490.

OIL - LONG TERM ANALYSISThanks for stopping by.
All analysis here is done strictly from an investor’s perspective — focusing on risk, return, valuation, and potential upside.
The notes cover key details. I’ve backed every thesis with my own analysis — no fluff, just what matters to investors.
If you find the idea useful

OIL – Oil India Ltd | Target: ₹429.00🟢 Trade Details:
LTP: ₹417.30
Recommended Buy Range: ₹415.50 – ₹416.00
🎯 Target: ₹429.00
🛑 Stop Loss: ₹408.70
🔍 Technical Snapshot:
✅ Strong bullish candle with volume confirmation
✅ EMA crossover supports the uptrend (9 EMA > 13 EMA)
✅ RSI at 62.22 shows healthy momentum
✅ Breakout above pre

OIL INDIASure! Here are all three English translations together:
---
This chart is of OIL INDIA LTD (NSE: OIL) in the daily timeframe (1D).
If this breakout is strong, it could be a sign of a bullish reversal.
If the price holds above the channel (above 405), it could be a good buy signal. However, if i

OIL INDIA LTD• CMP: ₹378| Stop Loss: ₹405 Target:*310
DISCLAIMER: I am NOT a SEBI registered
advisor or a financial adviser. All the views are for educational purpose only.

OIL India Ltd Short TradeHello,
Trend-Based Analysis. Buy the Dips, Sell The Rallies, Also Following the Trend. Let's see where the Price Action takes us, Riding the wave. Potential trade setups based on trend momentum.
Technical analysis based on trend identification and momentum, Looking for high-probability setups with
oilindia - Ema 100 > 144 > 200 > 300oilindia - Ema 100 > 144 > 200 > 300
1) Strong wide base formation
2) Bigger time frame Overall trend is upside
3) On DTF consolidation is goin on
4) Wide Consolidation going on
5) wait for trap breakdown till green ema
Expect stock to rally at least 40 % there after.

See all ideas
Summarizing what the indicators are suggesting.
Neutral
SellBuy
Strong sellStrong buy
Strong sellSellNeutralBuyStrong buy
Neutral
SellBuy
Strong sellStrong buy
Strong sellSellNeutralBuyStrong buy
Neutral
SellBuy
Strong sellStrong buy
Strong sellSellNeutralBuyStrong buy
An aggregate view of professional's ratings.
Neutral
SellBuy
Strong sellStrong buy
Strong sellSellNeutralBuyStrong buy
Neutral
SellBuy
Strong sellStrong buy
Strong sellSellNeutralBuyStrong buy
Neutral
SellBuy
Strong sellStrong buy
Strong sellSellNeutralBuyStrong buy
Displays a symbol's price movements over previous years to identify recurring trends.
O
OILI4503388
Oil India International Pte Ltd. 4.0% 21-APR-2027Yield to maturity
4.58%
Maturity date
Apr 21, 2027
See all OIL bonds
Curated watchlists where OIL is featured.

Downstream oil: Petroleum through the pipes
39 No. of Symbols
See all sparks
Frequently Asked Questions
The current price of OIL is 446.95 INR — it has increased by 0.45% in the past 24 hours. Watch OIL INDIA LTD stock price performance more closely on the chart.
Depending on the exchange, the stock ticker may vary. For instance, on NSE exchange OIL INDIA LTD stocks are traded under the ticker OIL.
OIL stock has risen by 2.58% compared to the previous week, the month change is a −3.94% fall, over the last year OIL INDIA LTD has showed a −18.71% decrease.
We've gathered analysts' opinions on OIL INDIA LTD future price: according to them, OIL price has a max estimate of 630.00 INR and a min estimate of 345.00 INR. Watch OIL chart and read a more detailed OIL INDIA LTD stock forecast: see what analysts think of OIL INDIA LTD and suggest that you do with its stocks.
OIL stock is 2.09% volatile and has beta coefficient of 1.23. Track OIL INDIA LTD stock price on the chart and check out the list of the most volatile stocks — is OIL INDIA LTD there?
Today OIL INDIA LTD has the market capitalization of 737.10 B, it has increased by 3.29% over the last week.
Yes, you can track OIL INDIA LTD financials in yearly and quarterly reports right on TradingView.
OIL INDIA LTD is going to release the next earnings report on Aug 7, 2025. Keep track of upcoming events with our Earnings Calendar.
OIL earnings for the last quarter are 9.79 INR per share, whereas the estimation was 10.64 INR resulting in a −7.96% surprise. The estimated earnings for the next quarter are 9.15 INR per share. See more details about OIL INDIA LTD earnings.
OIL INDIA LTD revenue for the last quarter amounts to 55.19 B INR, despite the estimated figure of 53.96 B INR. In the next quarter, revenue is expected to reach 52.47 B INR.
OIL net income for the last quarter is 13.10 B INR, while the quarter before that showed 13.39 B INR of net income which accounts for −2.15% change. Track more OIL INDIA LTD financial stats to get the full picture.
EBITDA measures a company's operating performance, its growth signifies an improvement in the efficiency of a company. OIL INDIA LTD EBITDA is 112.16 B INR, and current EBITDA margin is 34.50%. See more stats in OIL INDIA LTD financial statements.
Like other stocks, OIL shares are traded on stock exchanges, e.g. Nasdaq, Nyse, Euronext, and the easiest way to buy them is through an online stock broker. To do this, you need to open an account and follow a broker's procedures, then start trading. You can trade OIL INDIA LTD stock right from TradingView charts — choose your broker and connect to your account.
Investing in stocks requires a comprehensive research: you should carefully study all the available data, e.g. company's financials, related news, and its technical analysis. So OIL INDIA LTD technincal analysis shows the buy rating today, and its 1 week rating is buy. Since market conditions are prone to changes, it's worth looking a bit further into the future — according to the 1 month rating OIL INDIA LTD stock shows the buy signal. See more of OIL INDIA LTD technicals for a more comprehensive analysis.
If you're still not sure, try looking for inspiration in our curated watchlists.
If you're still not sure, try looking for inspiration in our curated watchlists.