OLA ELECTRIC Some buy pattern show in Ola Electric in weekly pattern.
So can be buy after close above 41.96 (W).
Try to exit, if close continues below 40.4 or 39.6 (W).
OLAELEC trade ideas

Ola looks to reverse from a long dry spellInterest in Ola seems to be gathering from bottom fishers. Is there something cooking?

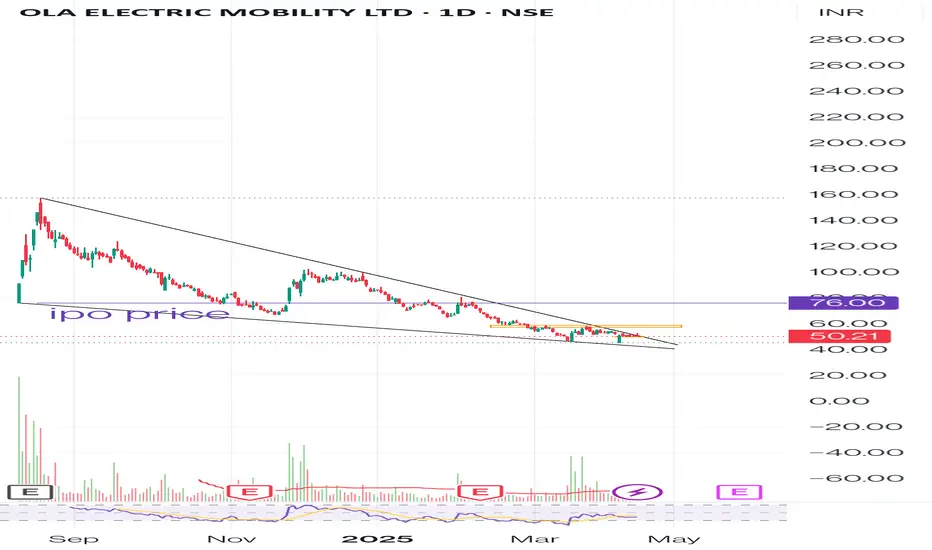
OLAFire, Fire, Fire
get Out. Get out, Get out
Mcap : 20,000 cr
Mcap Lost in 9 months: 60,000 cr
Results: Unreliable
High time Investment bankers and Auditors are hauled for Capital Market Losses.

Swing trade in ola electri OLA ELECTRIC continue down last two month. This trade make a falling wedge pattern on daily time frame and also breakout from the trand line. Holding period one or two month Target 60 to 65 stop loss49-50. Please trade with own analysis. This is only for education purposes

OLA ELECTRIC MOBILITY LTD S/RSupport and Resistance Levels:
Support Levels: These are price points (green line/shade) where a downward trend may be halted due to a concentration of buying interest. Imagine them as a safety net where buyers step in, preventing further decline.
Resistance Levels: Conversely, resistance levels (red line/shade) are where upward trends might stall due to increased selling interest. They act like a ceiling where sellers come in to push prices down.
Breakouts:
Bullish Breakout: When the price moves above resistance, it often indicates strong buying interest and the potential for a continued uptrend. Traders may view this as a signal to buy or hold.
Bearish Breakout: When the price falls below support, it can signal strong selling interest and the potential for a continued downtrend. Traders might see this as a cue to sell or avoid buying.
MA Ribbon (EMA 20, EMA 50, EMA 100, EMA 200) :
Above EMA: If the stock price is above the EMA, it suggests a potential uptrend or bullish momentum.
Below EMA: If the stock price is below the EMA, it indicates a potential downtrend or bearish momentum.
Trendline: A trendline is a straight line drawn on a chart to represent the general direction of a data point set.
Uptrend Line: Drawn by connecting the lows in an upward trend. Indicates that the price is moving higher over time. Acts as a support level, where prices tend to bounce upward.
Downtrend Line: Drawn by connecting the highs in a downward trend. Indicates that the price is moving lower over time. It acts as a resistance level, where prices tend to drop.
Disclaimer:
I am not a SEBI registered. The information provided here is for learning purposes only and should not be interpreted as financial advice. Consider the broader market context and consult with a qualified financial advisor before making investment decisions.

Ola Electric | Fibonacci Bounce with High VolumePrice reversed from the 161.8% Fibonacci extension, signaling a potential bounce. Today's strong bullish move with high volume indicates possible accumulation.
📌 Trade Plan: If today's delivery percentage is more than 30%, then consider a BUY @ LTP tomorrow with a strict SL below 46.
Disclaimer:
This is not financial advice. Please do your own research or consult with a financial advisor before making any investment decisions. Investments in stocks can be risky and may result in loss of capital.

$NSE:OLAELEC can it give a 13RNSE:OLAELEC experienced recent spike on its expansion in models. Will the OB which originated it give us a 13R trade ?

Ola Electric below its IPO priceOla electric has broken down its IPO price level of 76. From here we can expect downside targets of 69.30, 66.20, 57.75 & 54.
Avoid fresh entry

OLAELEC 20% Multi Time Frame Analysis
Bias : Bullish ( H4 )
Structure : Bullish ( M15 )
Entry : Bullish Order Block ( M5 )
PD Arrays
1. Bullish Breaker
2. Mitigation Block
3. Bullish Order Block

Ola Electric Mobility in Support three Buy 50 & 60 & 65in this i have updated three support u can buy on these level and resistance is 103 & 118 & 136 u can sell on this level to keep track this ola results

1 YEAR BULLISH FOR EV SECTORi am bullish for ola for long term ,and i think this sector gives more return in next 2 or 3 year
i think try this for next december and sl 20% trget 300%

OLA ELECTRIC Plummets as Complaints Soar – BUT, We Made Money!OLA ELECTRIC Stock Analysis:
Ola Electric (OLAELEC) recently experienced a significant downturn, with all targets met in a notable short trade on the 15-minute timeframe. The ongoing downtrend can be attributed to multiple external pressures:
Massive Customer Complaints: India’s Central Consumer Protection Authority (CCPA) reported over 10,000 complaints within a year related to Ola’s after-sales services, billing inaccuracies, and delays. This high volume of complaints is unprecedented, prompting government intervention.
Consumer Protection Action:
Ola Electric received a show-cause notice from Indian authorities, demanding an explanation for the alleged violations of consumer rights and trade practices. The repercussions could include directives for customer compensation or even financial penalties.
Service Overload at Centers:
Numerous reports indicate that Ola’s service centers are struggling to keep up with demand, leading to extensive backlogs and dissatisfied customers. According to analysts, many centers appear overwhelmed, further deteriorating Ola's brand image.
Market Sentiment Impact:
Following these revelations, Ola’s share value has sharply fallen, reversing the gains from its August IPO. The stock has lost nearly 40% in recent weeks, with negative sentiment further amplified by viral customer complaints on social media.
With external pressures mounting and consumer confidence waning, Ola Electric’s stock faces a challenging recovery path. The short trade setup capitalized on this decline, achieving all preset targets amidst the company’s reputational crisis.
Key Levels:
Entry: 93.86
Targets Achieved: TP1 at 90.87, TP2 at 86.04, TP3 at 81.21, TP4 at 78.22
Stop Loss: 96.27
Ola Electric’s road ahead remains uncertain as regulatory scrutiny intensifies and consumer trust continues to erode.

Ola electric - bullish reversalOla electric took support from strong FIBO levels, Technically looks bullish as long as 104 is saved on daily closing basis.
Fundamentally also there could be some buying around 100-104 levels. Keep and eye on this.

OLA ELECTRIC MOBILITYCurrently OLA is close to the 1st support level.
If you are planning to invest here are some key support level to consider.

OLA Electric - Short Setup, Target 3 DONE!OLA Electric - Short Setup
Got a SHORT entry yesterday as per the Risological swing trader indicator.
Reached Target 3 today.
Looks like target 4 is on its way.

0.55 Fib RetracmentPrice has taken support from 0.55 fib level.
Wait for price to break the previous candle high with good volume(imp).
Fundamental's are not that great but future prospect looks compelling.
NOTE: I do my analysis do yours before trade.

0.5 retracementDue to market conditions price is not pick up.
But price taken support in 15 min timeframe at 0.5 Fibonacci. If breaks this 0.5 level than not a good trade.
Fundamental's are not that great.
NOTE: I do my analysis, do yours before trade.

OLA ELECTRIC MOBILITY LTD S/RSupport and Resistance Levels:
Support Levels: These are price points (green line/share) where a downward trend may be halted due to a concentration of buying interest. Imagine them as a safety net where buyers step in, preventing further decline.
Resistance Levels: Conversely, resistance levels (red line/shade) are where upward trends might stall due to increased selling interest. They act like a ceiling where sellers come in to push prices down.
Breakouts:
Bullish Breakout: When the price moves above resistance, it often indicates strong buying interest and the potential for a continued uptrend. Traders may view this as a signal to buy or hold.
Bearish Breakout: When the price falls below support, it can signal strong selling interest and the potential for a continued downtrend. Traders might see this as a cue to sell or avoid buying.
20 EMA (Exponential Moving Average):
Above 20 EMA: If the stock price is above the 20 EMA, it suggests a potential uptrend or bullish momentum.
Below 20 EMA: If the stock price is below the 20 EMA, it indicates a potential downtrend or bearish momentum.
Disclaimer:
I am not a SEBI registered. The information provided here is for learning purposes only and should not be interpreted as financial advice. Consider the broader market context and consult with a qualified financial advisor before making investment decisions.
