PARAS DEFENSE📈 Trade Setup
Parameter Value
Buy Entry ₹738
Stop Loss (SL) ₹670
Target ₹1,194
Risk ₹68
Reward ₹456
Risk:Reward 6.7 : 1
Last High: ₹797 — Once broken, can trigger fresh momentum.
Last Low: ₹400 — Previous strong base.
⚠️ Key Observations
Strong Weekly & Daily Demand just below current price (678–
Next report date
—
Report period
—
EPS estimate
—
Revenue estimate
—
7.95 INR
634.70 M INR
3.65 B INR
36.41 M
About PARAS DEF AND SPCE TECH L
Sector
Industry
CEO
Munjal Sharad Shah
Website
Headquarters
Navi Mumbai
Founded
2009
ISIN
INE045601023
FIGI
BBG012MSVBK7
Paras Defence & Space Technologies Ltd. engages in the provision of designing, developing, manufacturing, and testing of a wide range of defence and space engineering products and solutions. It operates through the Optics & Optronic Systems and Defence Engineering segments. The Optics & Optronic Systems segment includes Space Optics/Gratings/Mirrors, Infra-Red Lenses for Night Vision Devices, Optomechanical Assemblies and Precision Diamond Turned components etc. The Defence Engineering segment focuses on the Defence Automation & Control systems, Rugged Command & Control Consoles, Avionic suite etc. The company was founded on June 16, 2009 and is headquartered in Navi Mumbai, India.
Related stocks

LONG PARAS DEFENCE Paras Defence has formed a higher low on the daily chart, in line with Dow Theory. Following this, the stock retraced and entered a consolidation phase on the 15-minute timeframe. A strong volume-backed breakout on the 15-minute chart has confirmed renewed buying interest. With this setup, a favoura

Paras double within a year prediction Will Paras Defence break above the Greenline and sustain its momentum, potentially doubling in value? I remain highly optimistic about the stock. The Indian government’s increasing defence budget—₹6.21 lakh crore in FY25, with a significant allocation toward indigenization and modernization—along wi

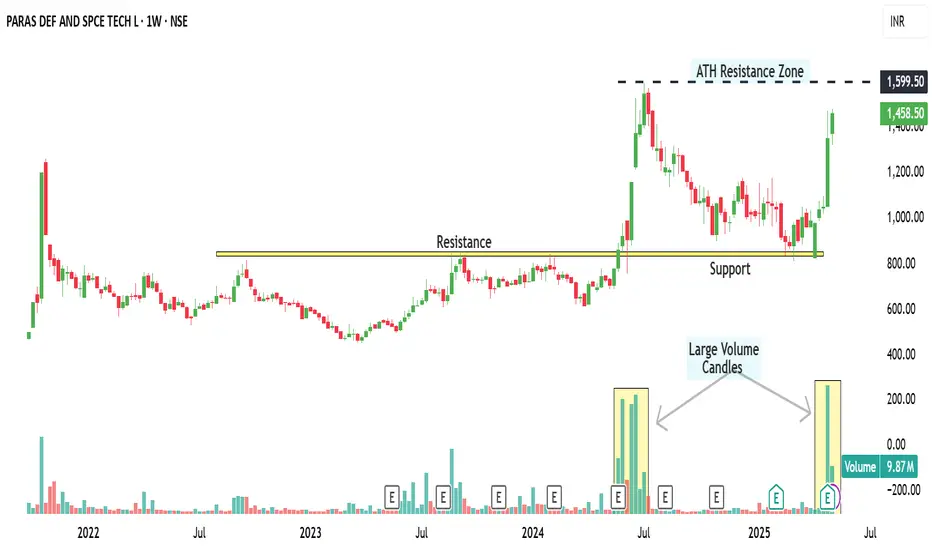
PARAS Defence is Strong defence stock , strong price action PARAS is can give ATH breakout if market support it. Large volume candles , Big Candles also dominant buyer strongness.
Key Level 1500
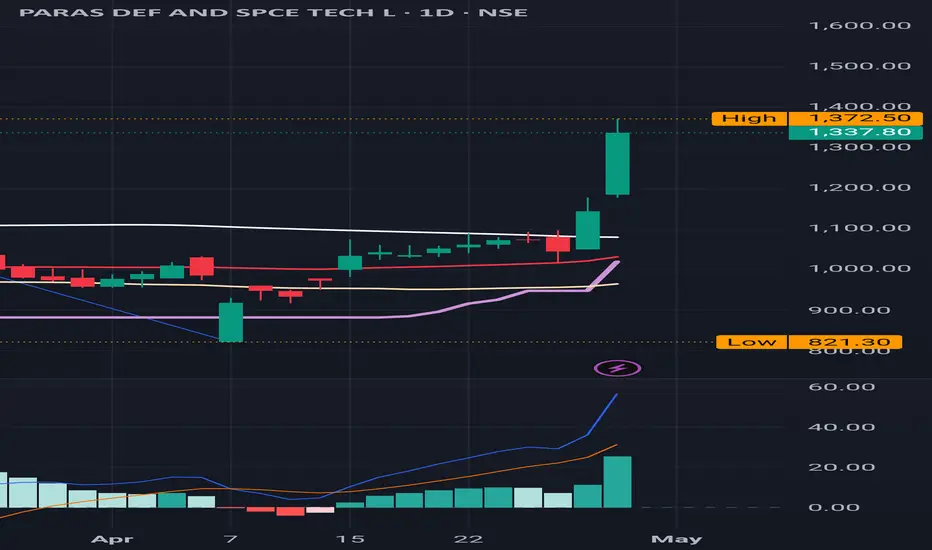
Equity Research Report – Paras Defence & Space Tech Ltd Technical Summary
Volume Spike: Sharp surge in volume confirms breakout strength.
Resistance Flipped: ₹1,299 now acting as strong support.
Momentum: RSI near 75 (overbought but strong bullish trend), indicating short-term potential with caution.
Moving Averages: 20/50/200 EMA crossover in bullis

PARAS Defence : Another Defence stock on fire PARAS Defence : Another Defence stock on fire like BEL.
Closed above 200 SMA and continuing the momentum .
All Indicators are positive as displayed on the chart .
( Not a Buy / Sell Recommendation
Do your own due diligence ,Market is subject to risks, This is my own view and for learning only
Equity Research Update – Paras Defence and Space Technologies CMP: ₹1,143 | Upside Potential: High
Paras Defence has broken out of a strong resistance zone (~₹1,120–₹1,160), confirmed by significant volume and bullish momentum. The RSI shows strength above 70, indicating buyer dominance. Historical resistance, marked by previous rejections, may now act as st


PARAS - WEEKLY PARABOLIC BULISHNSE:PARAS Weekly parabolic bullish formation may continue further rally. Stock is currently at location with accumulation.

Stock Breakout Alert – PARAS - Watch Closely!📊 Stock Breakout Alert – PARAS - Watch Closely!
🚀 Buy Setup Identified:
🔹 Buy Above: 1,036
🔹 Stop Loss (SL): 989.00
🔹 Target 1 (T1): 1,324.12
📈 Pattern Insights:
The stock is moving within a consolidation box and appears ready for a breakout. Once it crosses the buy level, we may see a strong upw

See all ideas
Summarizing what the indicators are suggesting.
Neutral
SellBuy
Strong sellStrong buy
Strong sellSellNeutralBuyStrong buy
Neutral
SellBuy
Strong sellStrong buy
Strong sellSellNeutralBuyStrong buy
Neutral
SellBuy
Strong sellStrong buy
Strong sellSellNeutralBuyStrong buy
An aggregate view of professional's ratings.
Neutral
SellBuy
Strong sellStrong buy
Strong sellSellNeutralBuyStrong buy
Neutral
SellBuy
Strong sellStrong buy
Strong sellSellNeutralBuyStrong buy
Neutral
SellBuy
Strong sellStrong buy
Strong sellSellNeutralBuyStrong buy
Displays a symbol's price movements over previous years to identify recurring trends.
Frequently Asked Questions
The current price of PARAS is 674.00 INR — it has decreased by −3.41% in the past 24 hours. Watch PARAS DEF AND SPCE TECH L stock price performance more closely on the chart.
Depending on the exchange, the stock ticker may vary. For instance, on NSE exchange PARAS DEF AND SPCE TECH L stocks are traded under the ticker PARAS.
PARAS stock has fallen by −14.91% compared to the previous week, the month change is a −16.38% fall, over the last year PARAS DEF AND SPCE TECH L has showed a 3.33% increase.
We've gathered analysts' opinions on PARAS DEF AND SPCE TECH L future price: according to them, PARAS price has a max estimate of 976.00 INR and a min estimate of 976.00 INR. Watch PARAS chart and read a more detailed PARAS DEF AND SPCE TECH L stock forecast: see what analysts think of PARAS DEF AND SPCE TECH L and suggest that you do with its stocks.
PARAS reached its all-time high on May 19, 2025 with the price of 972.50 INR, and its all-time low was 222.75 INR and was reached on Mar 28, 2023. View more price dynamics on PARAS chart.
See other stocks reaching their highest and lowest prices.
See other stocks reaching their highest and lowest prices.
PARAS stock is 6.66% volatile and has beta coefficient of 1.89. Track PARAS DEF AND SPCE TECH L stock price on the chart and check out the list of the most volatile stocks — is PARAS DEF AND SPCE TECH L there?
Today PARAS DEF AND SPCE TECH L has the market capitalization of 56.79 B, it has decreased by −3.44% over the last week.
Yes, you can track PARAS DEF AND SPCE TECH L financials in yearly and quarterly reports right on TradingView.
PARAS DEF AND SPCE TECH L is going to release the next earnings report on Nov 6, 2025. Keep track of upcoming events with our Earnings Calendar.
PARAS earnings for the last quarter are 1.85 INR per share, whereas the estimation was 4.80 INR resulting in a −61.46% surprise. The estimated earnings for the next quarter are 3.00 INR per share. See more details about PARAS DEF AND SPCE TECH L earnings.
PARAS DEF AND SPCE TECH L revenue for the last quarter amounts to 932.00 M INR, despite the estimated figure of 1.09 B INR. In the next quarter, revenue is expected to reach 1.21 B INR.
PARAS net income for the last quarter is 148.70 M INR, while the quarter before that showed 197.20 M INR of net income which accounts for −24.59% change. Track more PARAS DEF AND SPCE TECH L financial stats to get the full picture.
PARAS DEF AND SPCE TECH L dividend yield was 0.10% in 2024, and payout ratio reached 6.24%. The year before the numbers were 0.00% and 0.00% correspondingly. See high-dividend stocks and find more opportunities for your portfolio.
EBITDA measures a company's operating performance, its growth signifies an improvement in the efficiency of a company. PARAS DEF AND SPCE TECH L EBITDA is 950.40 M INR, and current EBITDA margin is 26.66%. See more stats in PARAS DEF AND SPCE TECH L financial statements.
Like other stocks, PARAS shares are traded on stock exchanges, e.g. Nasdaq, Nyse, Euronext, and the easiest way to buy them is through an online stock broker. To do this, you need to open an account and follow a broker's procedures, then start trading. You can trade PARAS DEF AND SPCE TECH L stock right from TradingView charts — choose your broker and connect to your account.
Investing in stocks requires a comprehensive research: you should carefully study all the available data, e.g. company's financials, related news, and its technical analysis. So PARAS DEF AND SPCE TECH L technincal analysis shows the sell today, and its 1 week rating is neutral. Since market conditions are prone to changes, it's worth looking a bit further into the future — according to the 1 month rating PARAS DEF AND SPCE TECH L stock shows the buy signal. See more of PARAS DEF AND SPCE TECH L technicals for a more comprehensive analysis.
If you're still not sure, try looking for inspiration in our curated watchlists.
If you're still not sure, try looking for inspiration in our curated watchlists.