Paytm : Monthly Time Frame, Sitting at a major Red Band Resistan
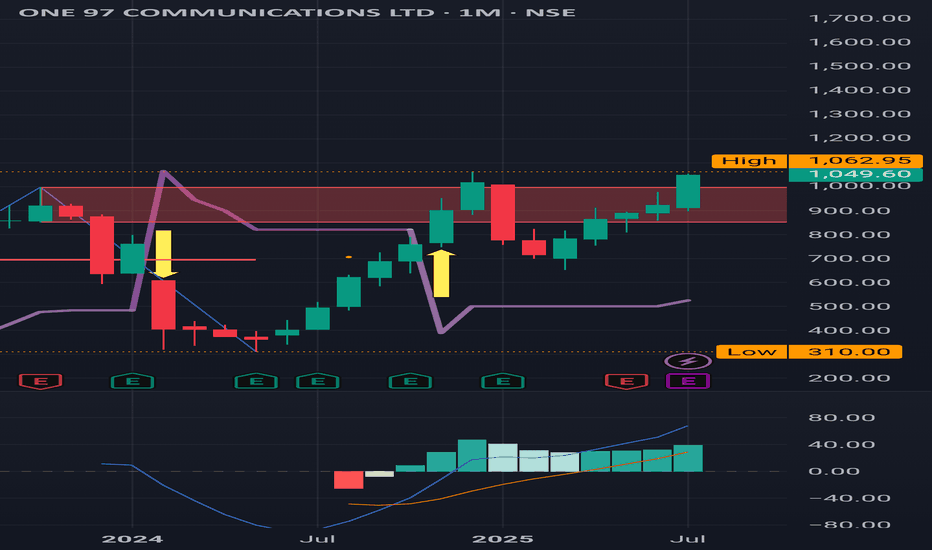
Paytm : Monthly Time Frame, Sitting at a major Red Band Resistance.
Last timr it turned back from 1062 , very important level to test .
( Not a Buy / Sell Recommendation
Do your own due diligence ,Market is subject to risks, This is my own view and for learning only .)
Next report date
—
Report period
—
EPS estimate
—
Revenue estimate
—
4.75 INR
−6.59 B INR
69.00 B INR
319.44 M
About ONE 97 COMMUNICATIONS LTD
Sector
Industry
CEO
Vijay Shekhar Sharma
Website
Headquarters
Noida
Founded
2000
ISIN
INE982J01020
FIGI
BBG000QYN144
One 97 Communications Ltd. engages in the development of digital goods and mobile commerce platform. It operates through the following segments: Payment, Commerce, Cloud, and Others. The company was founded by Vijay Shekhar Sharma on December 22, 2000 and is headquartered in Noida, India.
Related stocks
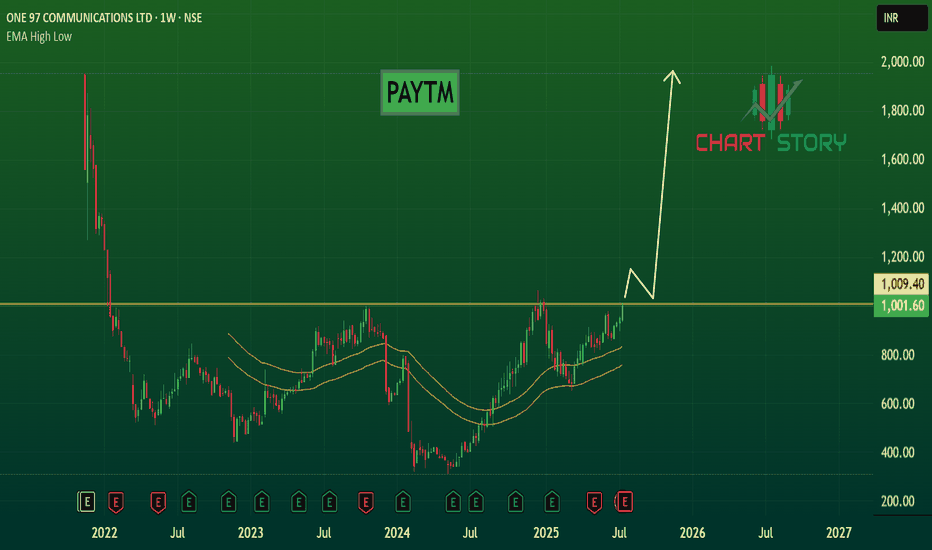
A long-term hold: PAYTM stockHello,
One 97 Communications Ltd. or PAYTM engages in the development of digital goods and mobile commerce platform. It operates through the following segments: Payment, Commerce, Cloud, and Others. The company was founded by Vijay Shekhar Sharma on December 22, 2000 and is headquartered in Noida,
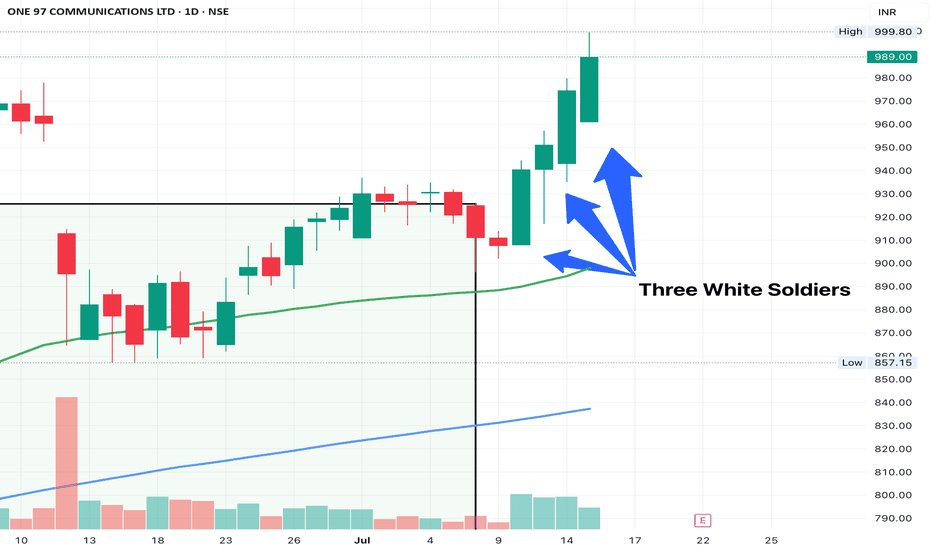
PAYTM - 3 WHITE SOLDIERSNo. of Candles: 3
Trend Context: Appears after a downtrend or consolidation (best)
Body Size: Long real bodies (bullish)
Wicks: Small or nonexistent lower wick
Volumes: > avg of 10 days
My criteria for spotting 3 white soldiers -
Each candle needs to opens within or slightly below the previous ca
Paytm : Sitting at a Major Red Band Resistance (Monthly Time )Paytm : Sitting at a Major Red Band Resistance.
Last time it turned back from 1062
( Monthly Time Frame)
( Not a Buy / Sell Recommendation
Do your own due diligence ,Market is subject to risks, This is my own view and for learning only .)
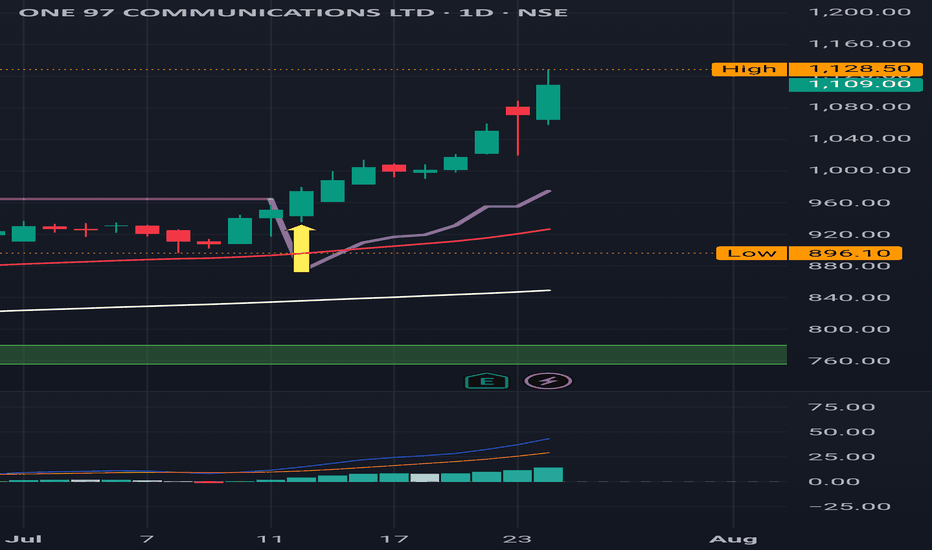
PAYTM - The Stock to Watch - Classic VCP Formation - No AdvicePaytm with first contraction of about 30%, second contraction of about 13% tried to breakout on 2nd June but closing was not very convincing. It failed due to escalation in middle east crises. Now formaing a narrow base with volume also drying up. It is leading to the formation of classic VCP patter
See all ideas
Summarizing what the indicators are suggesting.
Neutral
SellBuy
Strong sellStrong buy
Strong sellSellNeutralBuyStrong buy
Neutral
SellBuy
Strong sellStrong buy
Strong sellSellNeutralBuyStrong buy
Neutral
SellBuy
Strong sellStrong buy
Strong sellSellNeutralBuyStrong buy
An aggregate view of professional's ratings.
Neutral
SellBuy
Strong sellStrong buy
Strong sellSellNeutralBuyStrong buy
Neutral
SellBuy
Strong sellStrong buy
Strong sellSellNeutralBuyStrong buy
Neutral
SellBuy
Strong sellStrong buy
Strong sellSellNeutralBuyStrong buy
Displays a symbol's price movements over previous years to identify recurring trends.
Frequently Asked Questions
The current price of PAYTM is 1,067.75 INR — it has decreased by −3.48% in the past 24 hours. Watch ONE 97 COMMUNICATIONS LTD stock price performance more closely on the chart.
Depending on the exchange, the stock ticker may vary. For instance, on NSE exchange ONE 97 COMMUNICATIONS LTD stocks are traded under the ticker PAYTM.
PAYTM stock has risen by 6.99% compared to the previous week, the month change is a 18.29% rise, over the last year ONE 97 COMMUNICATIONS LTD has showed a 137.28% increase.
We've gathered analysts' opinions on ONE 97 COMMUNICATIONS LTD future price: according to them, PAYTM price has a max estimate of 1,400.00 INR and a min estimate of 705.00 INR. Watch PAYTM chart and read a more detailed ONE 97 COMMUNICATIONS LTD stock forecast: see what analysts think of ONE 97 COMMUNICATIONS LTD and suggest that you do with its stocks.
PAYTM reached its all-time high on Nov 18, 2021 with the price of 1,955.00 INR, and its all-time low was 310.00 INR and was reached on May 9, 2024. View more price dynamics on PAYTM chart.
See other stocks reaching their highest and lowest prices.
See other stocks reaching their highest and lowest prices.
PAYTM stock is 4.29% volatile and has beta coefficient of 1.33. Track ONE 97 COMMUNICATIONS LTD stock price on the chart and check out the list of the most volatile stocks — is ONE 97 COMMUNICATIONS LTD there?
Today ONE 97 COMMUNICATIONS LTD has the market capitalization of 681.31 B, it has increased by 6.68% over the last week.
Yes, you can track ONE 97 COMMUNICATIONS LTD financials in yearly and quarterly reports right on TradingView.
ONE 97 COMMUNICATIONS LTD is going to release the next earnings report on Nov 24, 2025. Keep track of upcoming events with our Earnings Calendar.
PAYTM earnings for the last quarter are 1.81 INR per share, whereas the estimation was 0.01 INR resulting in a 11.97 K% surprise. The estimated earnings for the next quarter are 1.06 INR per share. See more details about ONE 97 COMMUNICATIONS LTD earnings.
ONE 97 COMMUNICATIONS LTD revenue for the last quarter amounts to 19.18 B INR, despite the estimated figure of 19.52 B INR. In the next quarter, revenue is expected to reach 20.85 B INR.
PAYTM net income for the last quarter is 1.23 B INR, while the quarter before that showed −5.40 B INR of net income which accounts for 122.69% change. Track more ONE 97 COMMUNICATIONS LTD financial stats to get the full picture.
No, PAYTM doesn't pay any dividends to its shareholders. But don't worry, we've prepared a list of high-dividend stocks for you.
EBITDA measures a company's operating performance, its growth signifies an improvement in the efficiency of a company. ONE 97 COMMUNICATIONS LTD EBITDA is −6.43 B INR, and current EBITDA margin is −21.83%. See more stats in ONE 97 COMMUNICATIONS LTD financial statements.
Like other stocks, PAYTM shares are traded on stock exchanges, e.g. Nasdaq, Nyse, Euronext, and the easiest way to buy them is through an online stock broker. To do this, you need to open an account and follow a broker's procedures, then start trading. You can trade ONE 97 COMMUNICATIONS LTD stock right from TradingView charts — choose your broker and connect to your account.
Investing in stocks requires a comprehensive research: you should carefully study all the available data, e.g. company's financials, related news, and its technical analysis. So ONE 97 COMMUNICATIONS LTD technincal analysis shows the buy rating today, and its 1 week rating is strong buy. Since market conditions are prone to changes, it's worth looking a bit further into the future — according to the 1 month rating ONE 97 COMMUNICATIONS LTD stock shows the strong buy signal. See more of ONE 97 COMMUNICATIONS LTD technicals for a more comprehensive analysis.
If you're still not sure, try looking for inspiration in our curated watchlists.
If you're still not sure, try looking for inspiration in our curated watchlists.


