Review and plan for 30th July 2025 Nifty future and banknifty future analysis and intraday plan.
Quarterly results- analysis.
This video is for information/education purpose only. you are 100% responsible for any actions you take by reading/viewing this post.
please consult your financial advisor before taking any action.
----Vinaykumar hiremath, CMT
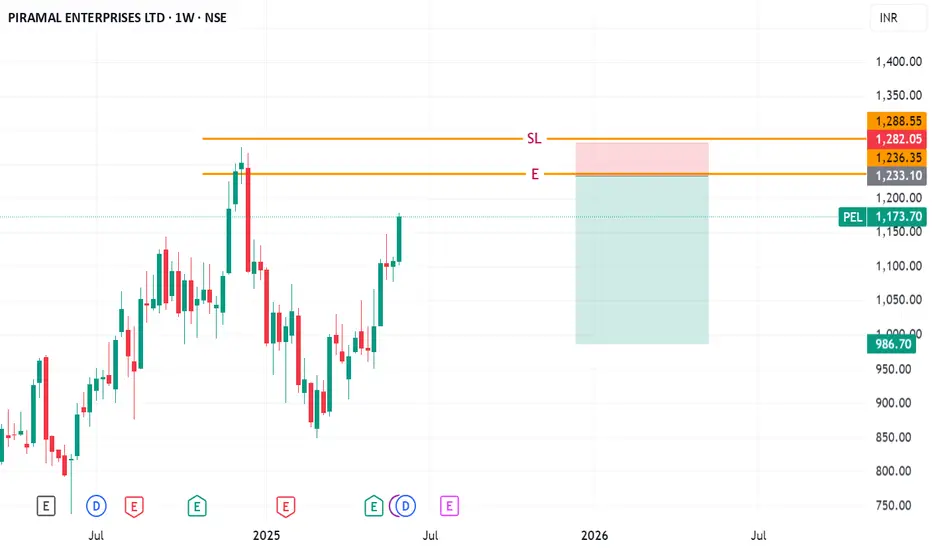
PEL trade ideas

PELNSE:PEL
One Can Enter Now !
Or Wait for Retest of the Trendline (BO) !
Or wait For better R:R ratio !
Note :
1.One Can Go long with a Strict SL below the Trendline or Swing Low.
2. R:R ratio should be 1 :2 minimum
3. Plan as per your RISK appetite and Money Management.
Disclaimer : You are responsible for your Profits and loss, Shared for Educational purpose

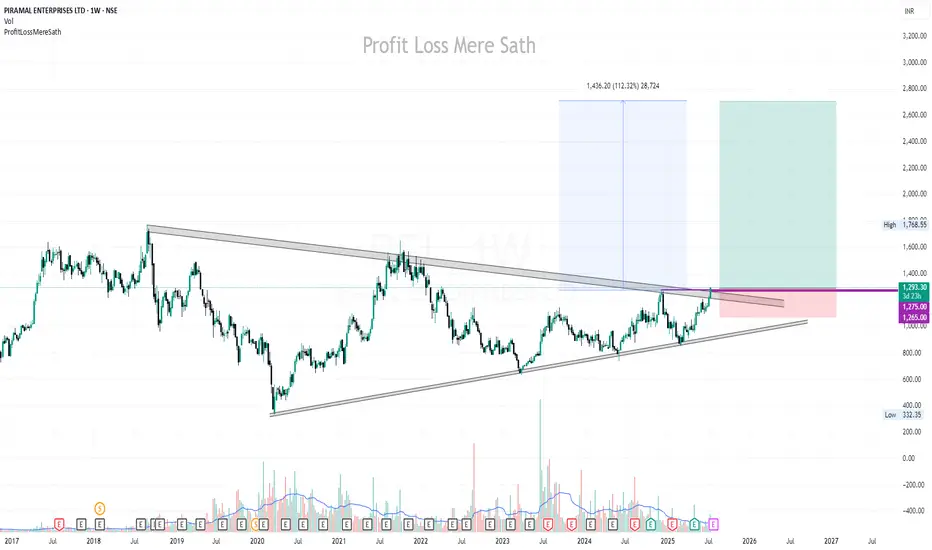
"PEL is having formed a Cup and Handle pattern
*Chart Pattern Identified**:
A **Cup with Handle** formation has been identified on the daily/weekly chart of **Piramal enterprise**, signaling a potential bullish breakout. This classic continuation pattern typically leads to strong upward moves once the handle breakout is confirmed.
🔍 **Breakout Levels and Price Targets**
1. **Primary Breakout Level – ₹1275**
* This marks the neckline of the **Cup with Handle** formation.
* A confirmed breakout at ₹1275 would validate the pattern.
(based on the measured move from the depth of the cup added to the breakout point)
* Acts as a **pre-breakout resistance** or consolidation level.
* A **daily or weekly close above ₹1,275** with strong volume would indicate early momentum and buyer interest.
* **Target after this level is breached**: ₹1275 (primary breakout zone), and if sustained, an extended target of **₹1820**.
### 📌 **Technical Outlook**
| Level | Significance | Action |
| ------ | ------------------------ | --------------------------------------------------- |
| ₹1275| Cup with handle breakout | Key confirmation zone; breakout of pattern |
| ₹1820 | Extended target | Projected move after full breakout confirmation |
---
### 📈 **Trade Strategy**
* **Entry Option 1**: Anticipatory buy near ₹1,275.
* **Entry Option 2**: Breakout confirmation buy above ₹1275 with higher risk-reward toward ₹1820.
* **Volume Confirmation**: Essential at 1275 levels.
* **Stop-loss**: Dynamic trailing stop-loss below handle lows or breakout support zones depending on entry.
---
### ⚠️ **Risk Management & Considerations**
* Ensure confirmation via **volume expansion** and **daily/weekly close** above key breakout zones.
* Be cautious of false breakouts, especially if moves happen on low volume or during broader market weakness.
* Monitor sectoral momentum (capital goods, engineering, or mining equipment) as it may influence breakout strength.

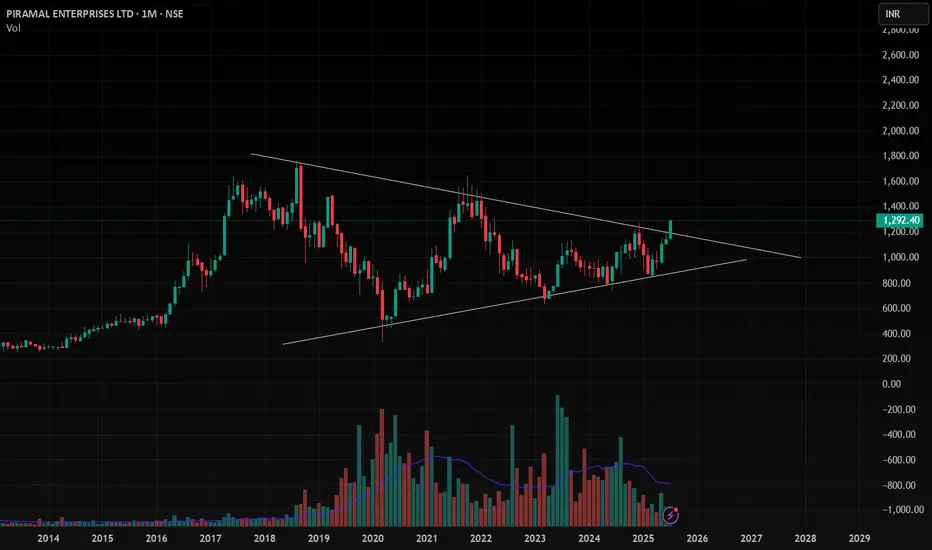
PEL Long For Swing TradeStock PIRMAL ENTERPRISES This stock is ready for multiyear breakout, it is inside symmetric triangle pattern. Look out for this stock.

PEL | Buy @LTP | SL below 1070 | Targets 1560, 1765, 2700Disclaimer:
This is not financial advice. Please do your own research or consult with a financial advisor before making any investment decisions. Investments in stocks can be risky and may result in loss of capital.
PEL , 1M , BullishThe Triangle Pattern is Breaking Out in Monthly Time Wait for Strong and Perfect close in Weekly Time and Enter after Confirmation .
Take Risk According to your capital
Follow for more ideas like this
Piramal Intraday Play/ Long:Piramal Intraday Play/ Long:
- Bullish Engulfing Candle with very strong volume
- Price close to the 20 DEMA
- After many indecisive candles, price moves stronger
- Earnings in 15 days.
- Enter long when the price is favorable in lower time frame
- SL: close below 20 DEMA

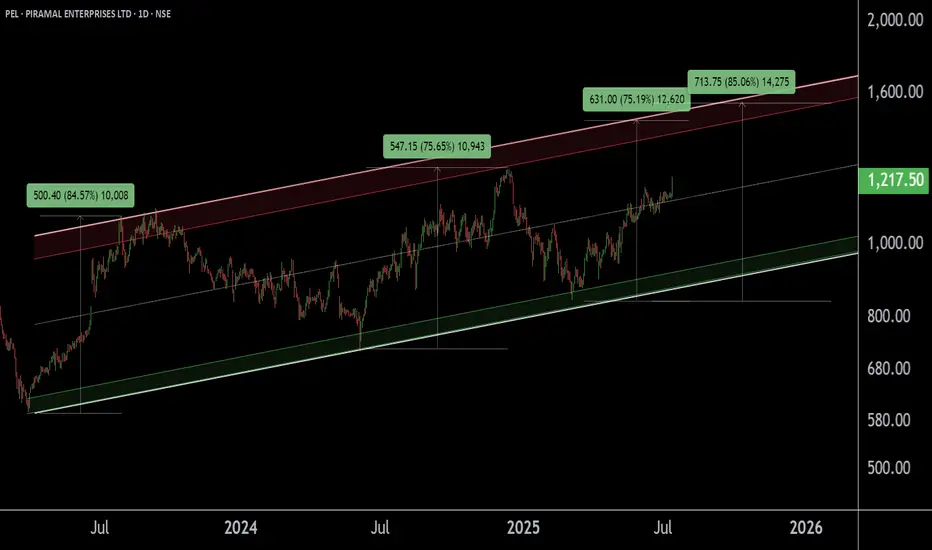
PEL !! PIRAMAL ENTERPRISES LTD appear to be in a Breakout phase This is the Daily Chart of PIRAMAL ENTERPRISES LTD.
PEL is trading above the midline of its ascending parallel channel, with strong support in the ₹1080–₹1150 zone. Historically, whenever it sustains above the midline, it tends to retest the upper boundary resistance of the channel near at 1500 -1540.
If this level is sustain then we may see higher prices in PEL.
Thank You !!
#PEL SUPPLY ZONE (SHORT SELL)PEL (Piramal Enterprises Ltd) has entered a supply zone, indicating potential selling pressure where sellers are likely to dominate.
PIRAMAL ENTERPRISES LTDThis is the Weekly Chart of PEL !!
PEl is moving in an Ascending Channel pattern on the weekly chart.
PEL is following a HH–HL structure in the channel in Daily chart support at 1040-1050 range, confirming a bullish trend continuation.
Based on historical price behavior, the stock has
previously delivered a 74% return from its swing low, reaching the 1500–1520 range.
Thank You!!

PEL | Breakout Setup | Short-Term Buy | Target ₹1100🟩 Trade Plan:
Buy Zone: ₹1059 – ₹1060
Target: ₹1100 (approx. 3.77% upside)
Stop Loss: ₹1037
Risk-Reward Ratio: ~2:1
Setup Type: Breakout above resistance zone (marked on chart)
Volume Confirmation: Strong bullish candle with high volume
RSI Confirmation: RSI bouncing above 60, momentum building
📈 Chart Annotations (TradingView Tips):
Draw resistance zone on 1H around ₹1060 – ₹1070 (breakout zone)
Plot EMA (9 & 21) or EMA crossover to confirm short-term bullish trend
Use RSI (14) to highlight momentum breakout
Highlight entry point, stoploss, and target with labels
Use TradingView’s “Long Position Tool” to visually display RR
For Education Purposes only

PELPEL
MTF Analysis
PELYearly Demand 947
PEL 6 Month Demand 947
PEL Qtrly Demand bufl 816
PELMonthly resistnce Now support 748
PELWeekly Demand DMIP 825
PEL Daily resistnce Now support 804
ENTRY -1 Long 825
SL 765
RISK 60
Target as per Entry 1,220
RR 6.58
Last High 1,651
Last Low 635

2025 stock : PEL CAN FLY 1390+ OR BREAK 1060 LET'S SEERECENTLY 2000 CR. NCD Launched .. 1000 CRORE has invested in Piramal Housing. In Chart short term support taken around 1060 if not break and close below 1060 in weekly time frame and success to close above 1140 than try to touch 1195-1235 long term target 1390+ . Happy Investment Journey 2025

PEL cmp 1119After covid in 2021 stock give a strong upside rally.Stosk was in a downtrend in March 2023. Then consolidating till now. Stock was facing a resistance at 1050 area. Now stock breakout this area and making a Double Bottom pattern on monthly chart. Upper bollinger band breakout is a good sign and confirmation in this stock.We can find a good Risk and Reward in this stock chart.

Weekly Breakout in Piramal EnterprisesThere is a good breakout in Piramal Enterprises on weekly basis at the levels of 1140. From here,we can expect 1266, 1300, 1550 & 1657.
If dip is found near 1150 then add to your portfolio.

PEL 1WPEL (Piramal Enterprises Ltd.) is poised to reach the ₹2600 level in a short period, provided it breaks out of the current symmetric triangle pattern
I'm not a SEBI-registered analyst. All posts and levels shared are just for educational purposes. I'm not responsible for any losses or profits. No claims, all rights reserved

PEL - investment stockPEL is forming good breakout setup in small time frame and cup and handle in bigger timeframe. Looks very good a long investment

PIRAMAL ENTERPRISES LTD S/R for 25/11/24Support and Resistance Levels:
Support Levels: These are price points (green line/shade) where a downward trend may be halted due to a concentration of buying interest. Imagine them as a safety net where buyers step in, preventing further decline.
Resistance Levels: Conversely, resistance levels (red line/shade) are where upward trends might stall due to increased selling interest. They act like a ceiling where sellers come in to push prices down.
Breakouts:
Bullish Breakout: When the price moves above resistance, it often indicates strong buying interest and the potential for a continued uptrend. Traders may view this as a signal to buy or hold.
Bearish Breakout: When the price falls below support, it can signal strong selling interest and the potential for a continued downtrend. Traders might see this as a cue to sell or avoid buying.
20 EMA (Exponential Moving Average):
Above 20 EMA(50 EMA): If the stock price is above the 20 EMA, it suggests a potential uptrend or bullish momentum.
Below 20 EMA: If the stock price is below the 20 EMA, it indicates a potential downtrend or bearish momentum.
Trendline: A trendline is a straight line drawn on a chart to represent the general direction of a data point set.
Uptrend Line: Drawn by connecting the lows in an upward trend. Indicates that the price is moving higher over time. Acts as a support level, where prices tend to bounce upward.
Downtrend Line: Drawn by connecting the highs in a downward trend. Indicates that the price is moving lower over time. It acts as a resistance level, where prices tend to drop.
RSI: RSI readings greater than the 70 level are overbought territory, and RSI readings lower than the 30 level are considered oversold territory.
Combining RSI with Support and Resistance:
Support Level: This is a price level where a stock tends to find buying interest, preventing it from falling further. If RSI is showing an oversold condition (below 30) and the price is near or at a strong support level, it could be a good buy signal.
Resistance Level: This is a price level where a stock tends to find selling interest, preventing it from rising further. If RSI is showing an overbought condition (above 70) and the price is near or at a strong resistance level, it could be a signal to sell or short the asset.
Disclaimer:
I am not a SEBI registered. The information provided here is for learning purposes only and should not be interpreted as financial advice. Consider the broader market context and consult with a qualified financial advisor before making investment decisions.

PEL Trade ideaPiramal Enterprises Ltd
I am keeping my GTT ready @ 825
SL @ 785 to 780
Disclaimer
The information and publications are not meant to be, and do not constitute, financial, investment, trading, or other types of advice or recommendations supplied or endorsed by Me.

Piramal Enterprises Ltd view for Intraday 8th October #PEL Piramal Enterprises Ltd view for Intraday 8th October #PEL
Buying may witness above 1011
Support area 1000-1002. Below ignoring buying momentum for intraday
Selling may witness below 993
Resistance area 1002
Above ignoring selling momentum for intraday
Charts for Educational purposes only.
Please follow strict stop loss and risk reward if you follow the level.
Thanks,
V Trade Point

Reverse Head & Shoulders Pattern going to form in PELPEL at its support zone ,Its forming Reverse Head & Shoulders Pattern ,Stock in oversold zone

PELPiramal Ent board OKs raising Rs 150-cr via NCDs, The base issue size is of Rs 50 crore along with a green shoe option to retain over subscription of up to Rs 100 crore, aggregating to Rs 150 crore.
These secured, rated, listed, redeemable, NCDs have a coupon rate of 9.5% per annum paid annually and on redemption date, which is 7 July 2034.
The debentures are proposed to be listed on the wholesale debt market (WDM) segment of the Bombay Stock Exchange (BSE)/ National Stock Exchange (NSE). NSE is the designated stock exchange.
Piramal Enterprises (PEL) is a leading diversified NBFC in India with a presence across retail lending, wholesale lending, and fund-based platforms. The company has investments and assets worth around $10 billion, with a network of branches across 26 states/UTs.
The NBFC reported 64.33% fall in consolidated net profit to Rs 181.48 crore in Q1 FY24 as against Rs 508.78 crore posted in Q1 FY24. Total income fell 25.99% to Rs 2,145.38 crore in Q1 FY25 as compared to Rs 2,898.79 crore posted in corresponding quarter last year.
The scrip ended 0.33% higher at Rs 1,004.40 on the BSE.

SWING IDEA - PELNSE:PEL has completed its Lower Low Pattern last year March and has ever since being forming a new Higher High Pattern.
At the same time the Price Action and MACD also formed a good Convergence Divergence. Currently the MACD also about to cross in the coming week. This indicates a bullish pattern and chances of going up from here.
915 has formed as a good Support Level and is holding well so far. Once the crossover happens, the stock looks good at least until its Swing High levels.
