Piramal enterprises Stock :- Piramal enterprises
Trend :- positive
Timeframe :- weekly
Setup :- W pattern breakout
Buy:- at current price in split form capital
Stoploss:- breakout weekly candle low
Risk & reward :- 1:3
Note :- consult your advisor before investing in stocks which I recommended you.
PEL trade ideas

PEL LongPEL looking good breaking the trendline and approaching a confluence point.
it could be accumulated between 890- 860 if it comes or even at current price for an aggressive trader.

PEL looking Forming like Cup with HandlePEL looking Forming like Cup with Handle
Breakout level is 987. Above this level buying will be good.

pel resistance breakout pel has givn resistance breakout ..
cmp: 992.
first target will be 1006
second will be 1014

PEL Brakeout - Piramal Industries Gives Brakeout on Daily chartNSE:PEL
PEL gives brake out on daily chart.
I am buying this stock
Near 975
And follow sl on 865
My target will be 1135
My risk reward ratio is 1:1.50
Return on capital 16%

Navigating the Waves: Piramal Enterprises Technical StudyTechnical Analysis of Piramal Enterprises (NSE: PEL)
This analysis is shared for educational purposes only and should not be considered financial advice.
Overview
Piramal Enterprises has shown a promising breakout with significant volume, indicating strong bullish momentum. The Elliott Wave analysis also suggests a positive structure, pointing towards potential further gains.
Elliott Wave Analysis
Wave 1: The stock completed its first impulse wave (1) near 1,140 INR.
Wave 2: The corrective wave (2) concluded around 735.85 INR.
Wave 3: The ongoing wave is expected to be an impulse wave 3, targeting higher levels.
Current Structure
- The stock has completed the corrective wave C of (2) and is now in the early stages of wave 3.
- The recent breakout above the black trendline suggests the start of wave (i) of 3, supported by increasing volume, adding to the bullish sentiment.
Key Levels
- Current Price: 977.85 INR
- Nearest Invalidation Level: 905.00 INR
- Major Invalidation Level: 630.45 INR
Targets
- Elliott wave suggests ahead wave 3 first levels (1.0 Fibonacci Extension of Wave 1): 1,246.00
- Elliott wave suggests ahead wave 3 ideal level (1.618 Fibonacci Extension of Wave 1): 1,561.25
Conclusion
Piramal Enterprises has provided a strong breakout backed by volume, aligning well with the Elliott Wave theory. The structure indicates a continuation of the uptrend with potential targets at 1,246 INR and 1,561.25 INR. The nearest invalidation level is at 905 INR, with a major invalidation level at 630.45 INR.
I am not Sebi registered analyst.
My studies are for educational purpose only.
Please Consult your financial advisor before trading or investing.
I am not responsible for any kinds of your profits and your losses.
Most investors treat trading as a hobby because they have a full-time job doing something else.
However, If you treat trading like a business, it will pay you like a business.
If you treat like a hobby, hobbies don't pay, they cost you...!
Hope this post is helpful to community
Thanks
RK💕
Disclaimer and Risk Warning.
The analysis and discussion provided on in.tradingview.com is intended for educational purposes only and should not be relied upon for trading decisions. RK_Charts is not an investment adviser and the information provided here should not be taken as professional investment advice. Before buying or selling any investments, securities, or precious metals, it is recommended that you conduct your own due diligence. RK_Charts does not share in your profits and will not take responsibility for any losses you may incur. So Please Consult your financial advisor before trading or investing.

PIRAMAL ENTERPRISEPIRAMAL ENTERPRISE
The chart looks good :)
bullish engulfing is a break in monthly TF.
Bollinger bands also break in daily TF,
Near weekly TF
.
.
Small entry with small SL -(today low CB)
.
.
I am waiting for the result for full confirmation.
:)

PIRAMAL ENTERPRISE S/R Support and Resistance Levels: In technical analysis, support and resistance levels are significant price levels where buying or selling interest tends to be strong. They are identified based on previous price levels where the price has shown a tendency to reverse or find support.
Support levels are represented by the green line and green shade, indicating areas where buying interest may emerge to prevent further price decline.
Resistance levels are represented by the red line and red shade, indicating areas where selling pressure may arise to prevent further price increases. Traders often consider these levels as potential buying or selling opportunities.
Breakouts: Breakouts occur when the price convincingly moves above a resistance level (red shade) or below a support level (green shade). A bullish breakout above resistance suggests the potential for further price increases, while a bearish breakout below support suggests the potential for further price declines. Traders pay attention to these breakout signals as they may indicate the start of a new trend or significant price movement.
20 EMA: The yellow line denotes 20 EMA, to interpret the 20 EMA, you need to compare it with the prevailing stock price. If the stock price is below the 20 EMA, it signals a possible downtrend. But if the stock price is above the 20 EMA, it signals a possible uptrend.
Disclosure: I am not SEBI registered. The information provided here is for learning purposes only and should not be interpreted as financial advice. It is important to consult with a qualified financial advisor before making any investment decisions. Tweets neither advice nor endorsement.

Another DoozyWe are seeing our analysis over the last couple of months play out beautifully. I would like to start zooming in and posting entry confirmation. With Higher Time fram analysis we need to look at appropriate risk and entries.

PEL IS READY TO FLY FROM HEREPEL can double from here with in a year. Sl below the trend line.
Chart is self explanatory. Please follow the price action & take the trade as per your appetite.
The information provided here is only for educational purpose. The information provided here is not intended to be any kind of financial advice, investment advice, and trading advice. Investment in stock market is very risky and trading stocks, options and other securities involve risk. The risk of loss in stock market can be substantial. Moreover, I am not a SEBI registered analyst, so before taking any decision or before investing in any Share consult your financial advisor and also do your analysis and research.
Request your support and engagement by liking and commenting & follow to provide encouragement.

Like clockworkWell maybe not exactly like clock work but you get the picture. We have predicted the lows and current area of price. I will look for a deeper dig into the OTE and monthly order block before taking price higher.

In trading patience pays.We are still in chop city for these futures. We need to wait for these lows to be taken.
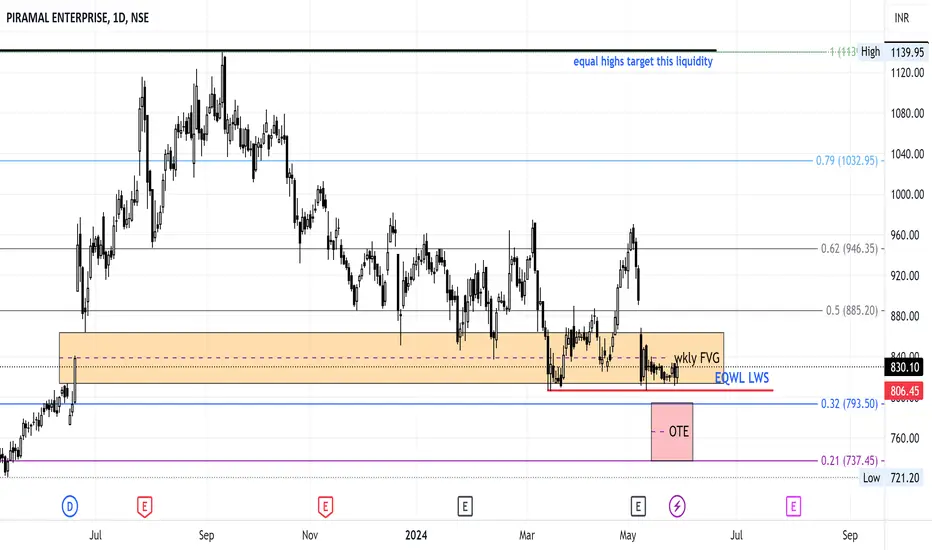
Move lower to drive higher.Patience is required when we look at daily time frame analysis. But remember HTF order flow is KING. Buys from the OTE marked.

Trying to move and rediscover old gloryPiramal Enterprises Ltd engages in the business of pharmaceuticals and provision of financial services. It operates through the following segments: Pharmaceuticals Manufacturing and Services, Financial Services, and Healthcare Insights and Analytics. In 2011 it saw Fortune 500 ranking Piramal Healthcare in the top-50 largest corporations across India.
Piramal Enterprises Ltd CMP is 925.75. The Negative aspects of the company are High Valuation negative PE (P.E. = -10.30), Declining cash from operations annual and FIIs are decreasing stake. The positive aspects of the company are Low debt, zero promoter pledge, MFs are increasing stake and improving annual net profit.
Entry after closing above 932. Targets in the stock will be 971, 1010 and 1055. Long term targets in the stock will be 1085 and 1138. Stop loss in the stock should be maintained at closing below 848.
The above information is provided for educational purpose, analysis and paper trading only. Please don't treat this as a buy or sell recommendation for the stock. We do not guarantee any success in highly volatile market or otherwise. Stock market investment is subject to market risks which include global and regional risks. We will not be responsible for any Profit or loss that may occur due to any financial decision taken based on any data provided in this message.

PELI Have learnt technical analysis for swing trade , please gothrough full video take it as learning video and do your analysis, feel free to comment.

PELThere seems short term breakout in PEL if it sustains above current level then we can see some good move upside

ACCUMULATE ACCUMULATETrendline breakout with good volumes . Good place to accumulate with very tight stoploss

PEL--Channel Breakout??this stock is broken the channel and retested,
if this failed to push the price upside,
fall will continue to demand zones, we have a demand zone at 890 levels,
if this fails fall happens.look for buy at demand zone.
on topside resistance is showing at 1017 levels.
we have a chance of continuation in this stock.

pel 4hr time frame buy @ 926.50 target @ 1002 pel 4hr time frame
buy @ 926.50 target @ 1002
decending channel breakout
risk reward 1.65
its just a view trade @ your own risk
sl@ 876.75

PEL : Biggest Breakout of 4 month Piramal Enterprises has formed Descending Triangle pattern
Stock has given huge breakout around 930 levels
Target would be around 1150-1100
850 is Strong support for long term
If we correct then prices may take support around 850 levels.
Disclaimer : We are not SEBI registered analyst. Do your own research before taking any investment decision.

PEL LONG After a long downtrend stock breakout Trend line with good volume
Moving averages also react as a dynamic support
Macd Bullish crossover
RSI indicate Bullish
Chart setup is favour of long trade
Go for long when price break last day high
SL below the trend line
Very good Risk Reward.
Disclaimer This is my personal view for education purpose only
No Buy sell recommendations.

ABCD pattern in PELPEL is in buy zone considering other peers
keep stop loss as 888 on day close basis
Target can be 15 to 50% ramge by next year

Pel Swing stock Simple ORB STRATEGY with volume above the blue line close D chart i will buy and sl below the red line close D chart just a view educational purpose only conform with your own analysis or financial advisor
