Petronet Lng longthis stock current time complete extend flat correction
0-2 trendline not break price cross wave1
high . if wave 3 break this line before wave
1 high cross . impulse wave convert complex
correction.
PETRONET trade ideas

PETRONET LNGThis post is solely for educational purposes. PETRONET price is emerging from a demand zone, BUT the entry point is 271, then the subsequent targets will be 275,280,285 and beyond 290. If you appreciate my analysis, please follow and comment. You may also ask questions about any stocks for further analysis.

Crossing the hurdle: Positional trade in PetronetPetronet LNG has been in consolidation phase from 2019 and is frequently seen as giving whipsaws at the 40 day EMA. It made an all time high of 299 and from there it started its sideways journey. It formed a triangle pattern and on 15th Januray gave a breakout with above average volumes.It even briefly tried to test the all time high of 299. The long term Relative strength (Red line) too has turned positive for the time period. If this level is crossed petronet could go till 350-360 levels. The risk present here is that for the very short term the stock is in a weak zone as overall markets have seen selling. (This is not an investment tip. Please do your own due diligence)

Petronet BreakoutPetronet breaking out after forming a base for 2.9Y and reached target 1 today at 285. 317, 379, 402, 423 are the subsequent targets. 379 should be an easy target.

Petronet LNG breakoutPetronetLNG breaking out of 4 year long range/pennant consolidation.
Target - 410 / 600

Petronet LNGThere is good breakout in ratio chart of Petronet LNG and chances are higher that it can given good in returns in coming week.

PETRONET DAILY CHART (power of mob)MOB BANG ON
PETRONET DAILY CHART
Cmp 222.70 Target 288-293
Expected move explained as 1-2-3-4-5.
Any move below 205 levels will negate the calculation.

PETRONET DAILY CHART PETRONET DAILY CHART
Cmp 222.70 Target 288-293
Expected move explained as 1-2-3-4-5.
Any move below 205 levels will negate the calculation.
Its only an observation & not any suggestion or recommendation.

Petronet LNG #PSU worth to look for!Is it gonna break multi-year range?
With recent Q3 results I can assume that the price action got the support of Fundamentals
as you can see the price just attempted to break its barrier
though it is unsuccessful; looking at the similar pattern before -- the current structure almost resembles the pattern the stock is following.
like historic pattern, price being above the R1 pivot gives confidence that it will eventually break out of the range and inch higher
#PSU

Petronet LNG Long Positional3-2-2024
------------
Petronet LNG Looking good on Chart
Buy above 299
Targets : 315-330-360-397-435
Duration few Months
Reason : Breaking Consolidation zone, Above 20 & 50 EMA, Volume increase, RSI above 60

Flag and poleFlag and pole broken and coming for retesting. Good for long. It's only my view not a recommendation.

PETRONETThese are swing ideas which you can add your watchlist and analysis for yourself !
Keep on your radar!
This I am not sebi ragister I

Petronet LNG Petronet LNG Ltd.
1. Stock form triple bottom in two year chart and very near to major breakout level on Six Months & Yearly chart almost after 65 days for More details of Chart go through Money Control.
2. Weekly RSI is above 55 levels.
3. Stock closes above 10/20/50/100/200 days moving average & last three day's continue higher high as well as raising volume
Entry Price: 220 /225
SL: 210:(closing basis)
Bullish Abv.Cl. 228,232,236
Target: 230/250/280
Time Horizon: 90 to 120 days
NOTE: Movement of Stock also Depends upon Nifty 50 Movement
Disclaimer: I am not SEBI registered. This is my personal view only for educational purposes. I might have this stock in my portfolio. Please do research on your own or consult with your financial advisor before investing and trading.

PETRONET LNG REACHING A MULTI-YEAR SUPPORT?This is the most straightforward price action logic in the commodity stock space right now. The entire commodity stock space is hitting a multi-period low. Prudent capital deployment at different levels should be considered.


Petronet Verge of Breakdown ???
Hello All,
I am glad you have liked my post and I am sure everyone who have traded on these post would have made profits.
If you like my Idea, Don't forget to Boost and comment on my Analysis.. The recommendations are purely for educational purpose only, consult you financial advisor before trading.
Gautam Khanna
Technical Analyst by Passion :-)

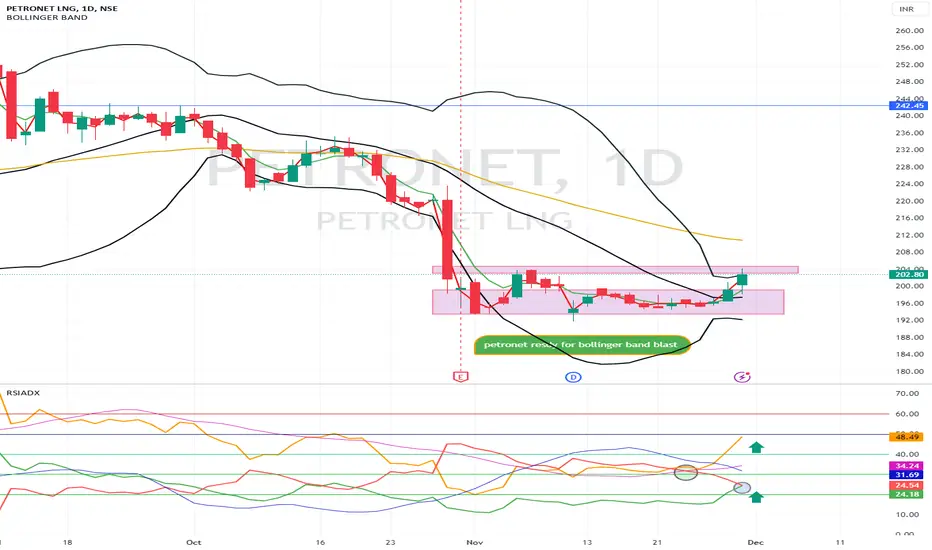
petronet resdy for bollinger band blast petronet
break his one month consolidation zone
now ready for upmove
forst target 212
petronet resdy for bollinger band blast
PETRONET in 52W low & in support trend linePETRONET company trading at 52W low and bottom trend line makes as a support, PETRONET diversification leads investors to Sell their share, which leads share price drop near 52W low, Add this stock to your watchlist and observe the trend.

PETRONET AMAZING OPPORTUNITY !!!
These are the Source and Destinations of the Uptrend.
The Demand and Supply Equilibrium showing us the Areas on the equilibrium.
Long Trade with an Amazing Reward to Risk ratio.
ENJOY THE RIDE ! ! !

"Pertronet Outlook: Bullish Sentiment Grows for the Upcoming Day"Pertronet's Weekly Demand Zone Signals Positive Momentum"
Pertronet, our favorite stock, is currently showing strong signs of a bullish trend in the coming days. What makes this prediction even more compelling is the fact that it is comfortably situated within a weekly demand zone. This zone serves as a reliable foundation for potential upward movement in the stock's price.
While the road to success often has its bumps, Pertronet has already demonstrated its resilience by establishing small resistance levels at 235 and 246. These minor hurdles are likely to be overcome as the stock gains momentum and steadily moves towards its next target: 254.
Investors can keep their sights set on this achievable target for the upcoming days or weeks. With the overall market sentiment and technical indicators aligning in favor of Pertronet, it's a great opportunity for traders and investors alike to join in on the potential gains.
As always, it's essential to stay updated with the latest market developments, but Pertronet's current position in the weekly demand zone suggests that the bulls may be in control for the foreseeable future. This is a promising opportunity for those looking to ride the wave of this stock's ascent in the days to come.

[Positional] Petronet Buy IdeaNote -
One of the best forms of Price Action is to not try to predict at all. Instead of that, ACT on the price. So, this chart tells at "where" to act in "what direction. Unless it triggers, like, let's say the candle doesn't break the level which says "Buy if it breaks", You should not buy at all.
=======
I use shorthands for my trades.
"Positional" - means You can carry these positions and I do not see sharp volatility ahead. (I tally upcoming events and many small kinds of stuff to my own tiny capacity.)
"Intraday" -means You must close this position at any cost by the end of the day.
"Theta" , "Bounce" , "3BB" or "Entropy" - My own systems.
=======
I won't personally follow any rules. If I "think" (It is never gut feel. It is always some reason.) the trade is wrong, I may take reverse trade. I may carry forward an intraday position. What is meant here - You shouldn't follow me because I may miss updating. You should follow the system I share.
=======
Like -
Always follow a stop loss.
In the case of Intraday trades, it is mostly the "Day's High".
In the case of Positional trades, it is mostly the previous swings.
I do not use Stop Loss most of the time. But I manage my risk with options as I do most of the trades using derivatives.
=======

#PETRONET 238 Recommended Buy - Rachit Sethia #stockstoWatch #PETRONET 238
Breakout at ATH and Retested
TGT 275 and open for above
SL Not Applicable
Factors: BULLISH WEDGE BREAKOUT Trend Following Rising Volume with rising Prices. Flag pattern breakout. Pennant Pattern Breakout with Bullish Candle. Retest Successful. Higher Highs & Higher Lows. Broken above RESISTANCE levels Trading at SUPPORT levels Earnings are strong. Bullish Wedge Breakout Risk Return Ratio is healthy. And Rising from Double Bottom Pattern to Flag Pattern forming. If you like my work KINDLY LIKE SHARE & FOLLOW this page for free Stock Recommendations. With 💚 from Rachit Sethia

petronet buy @ 226 triangle breakout target 241, 249, 259, 273 petronet buy @ 226 triangle breakout target 241, 249, 259, 273
risk reward 3.15
sl 210
