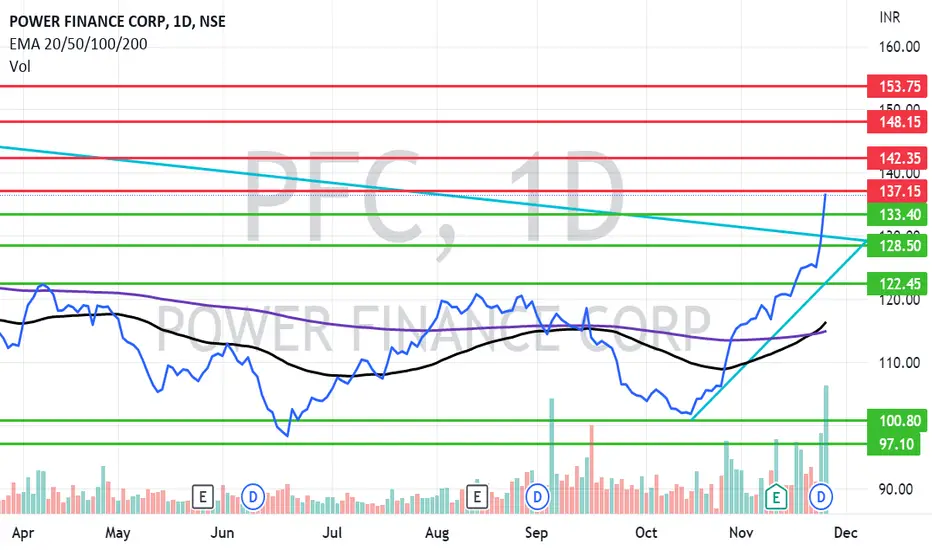
PFC looking strong.Entry / Compounding / Averaging in PFC can be done after closing above 138 closing. The target for PFC will be 142, 148. Long term target in the stock will be 153. Stop loss in the stock can be maintained at a closing below 122.
The Dividend yield of the stock is staggering 9.2% at CMP. Valuation of the stock is affordable as the stock is trading at a PE of 2.5.
The negative aspect of the company is that MFs have decreased their stake off late and the net cash flow of the company is decreasing.
The positives of the company are that FIIs are increasing stake. As mentioned dividend yield has historically been very high for PFC. Net Profit of this PSU is increasing since last 2 years.
PFC trade ideas
Head & Shoulder breakout - PFCInverse head and shoulder breakout on weekly basis should be kept on watch. below 114 is the invalid point.

My view on PFCPFC giving double bottom breakout
Looking tgt 125-128-130++
in very short term
Keeping on radar PFC 125CE

PFC - Supply at 135 and Demand re-appeared at 100 in Jul'22Context
Price has held above 100 even though volume dropped
Up from May'20 to Oct'21 met supply at 135
Demand re-appeared at 100 in Jul'22
Plan -
to Purchase Breakout above 135
or, rejection indications near 90
PB 0.4x
PE 2x
DE 10x
ROCE 9%
Div 11%

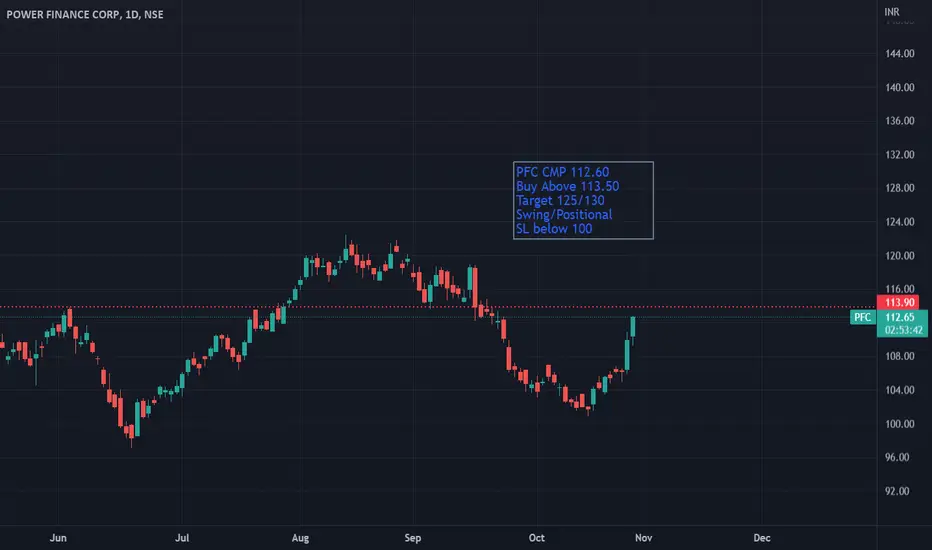
Best level to take entry for long PFCMy analysis allow me to take entry on Power Finance Corp from current level NSE:PFC . It is good risk and reward opportunity.
My level to take entry is 104.55, will put small stop loss on 99.85. Will wait till target of 114.
Note: This is my personal analysis, only for learning. Please take advise from your advisors before make any trade.
Thanks.

#Pfc cash : Looks good above 117.10#Pfc cash -Posiitonal call for 2 weeks
06.09.2022
Looks good above 117.10
stoploss 112
Target 127-130/140
Cmp 116.50


PFC IndiaSun Storm Investment Trading Desk & NexGen Wealth Management Service Present's: SSITD & NexGen Portfolio of the Week Series
Focus: Worldwide
By Sun Storm Investment Research & NexGen Wealth Management Service
A Profit & Solutions Strategy & Research
Trading | Investment | Stocks | ETF | Mutual Funds | Crypto | Bonds | Options | Dividend | Futures |
USA | Canada | UK | Germany | France | Italy | Rest of Europe | Mexico | India
Disclaimer: Sun Storm Investment and NexGen are not registered financial advisors, so please do your own research before trading & investing anything. This is information is for only research purposes not for actual trading & investing decision.
#debadipb #profitsolutions

Buy Long Power finance corp. at 116, for Target of 132, SL-113NSE:PFC Cup & Handle pattern break out with high volume, expected Returns-13.79%

PFCNSE:PFC
Please note that we are not a SEBI Registered Investor Adviser/PMS/ Broking House.
All the contents over here are for educational purposes only and are not investment advice or recommendations
offered to any person(s) with respect to the purchase or sale of the stocks / futures and options.
You are also requested to apply your prudence and consult your advisers in case you choose to act on
any such content available as WE claims no responsibilities for any of your actions or any outcome of
such action

Power Finance Corp Swing Trade IdeaPower Finance Corporation has taken support from a strong buy level and the price is expected to go up from this level as per previous historical data. Entry 120, Target = 160, Stop Loss = 100

PFC short trade technical analysisRefer to chart for buy and sell options , for education purpose only

POTENTIAL MULTIBAGGER OF THE DECADE 1000% 🎯🔥📈Analysis is part technical and part fundamental.
NSE:PFC has been consolidating in a sideways uptrend for almost 13 years. Price has recently taken a rejection from this channel pattern in the month of October.
Going with the price action view, price should retrace all the way back to channel support, around 80-90 levels.
An established support at these levels could present a golden buying opportunity for building wealth over long term.
Alternatively, price breaking out this year could be the breakout of the decade.
Stock's P/E ratio is currently at 2.9 whereas the sector P/E is at 22.
A breakout from this channel has potential for price to go up by 800-1000%
Company has also seen consistent growth in revenue and profits in last 5-6 years.
Do keep this stock in your watchlist. Investment horizon is over 5 years.
THIS COULD BE THE NEXT TATA POWER!
Do comment your opinions on this! Thank you!

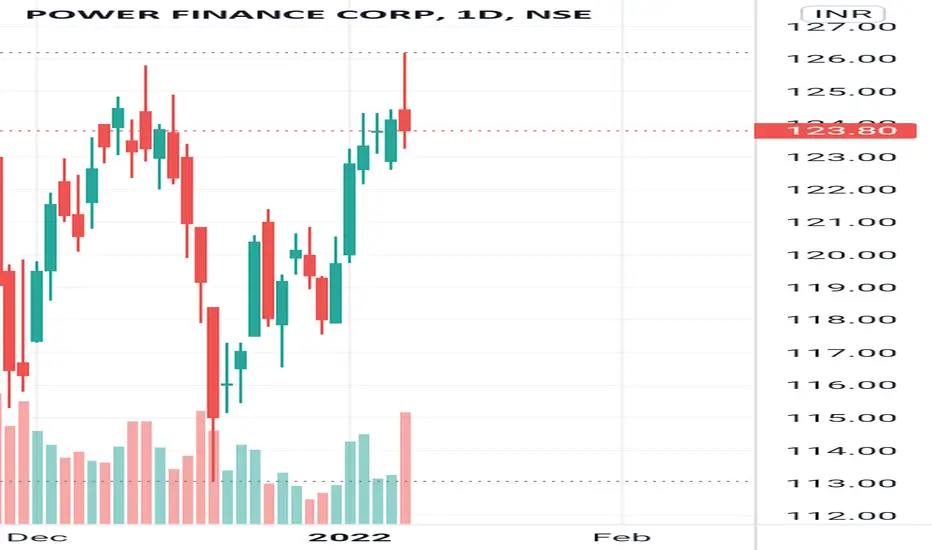
Looking bullishRecent intraday correction from 126 to 124 Give good opportunity to create Long position through Cash & Call option,
BUY PFC 124-125 SL 121 Target🎯 127/129/132/135+++
BUY PFC 125 CE @2.6-3 SL 2 Target 4/6/8+++
As a disclose I am not SEBI registered, View only for educational purpose consult your financial advisor before taking trade.
PFCNSE:PFC
Please note that we are not a SEBI Registered Investor Adviser/PMS/ Broking House.
All the contents over here are for educational purposes only and are not investment advice or recommendations
offered to any person(s) with respect to the purchase or sale of the stocks / futures and options.
You are also requested to apply your prudence and consult your advisers in case you choose to act on
any such content available as WE claims no responsibilities for any of your actions or any outcome of
such action

PFC LONG - SWING - 2 MONTHSLooks broken the strong resistance zone.
now trying go up previuosly volume also got big so hopes for go long as swing trading.
duration - 2 months
CMP- 123.65, 05/1/2021
please take trade as own risk.
im not SEBI registered.


PFC LONG ## Breakout above 155 with a weekly candle close will trigger multiyear breakout ##
Trade plan :- Accumulation around 155 to 160 levels for the targets of all time high levels can be a good plan for 50-70 % quantity followed by chasing momentum with trailing stoploss.
For education purposes only, this is not a trading recommendation. NSE:PFC

PFCNSE:PFC
Please note that we are not a SEBI Registered Investor Adviser/PMS/ Broking House.
All the contents over here are for educational purposes only and are not investment advice or recommendations
offered to any person(s) with respect to the purchase or sale of the stocks / futures and options.
You are also requested to apply your prudence and consult your advisers in case you choose to act on
any such content available as WE claims no responsibilities for any of your actions or any outcome of
such action

PFCCharts if forming CUP n Handle upon the issue of quarterly results good time to buy for quick gains.

PFC 1WNSE:PFC
IF BRKS FILTERATION FOR DOWN TREND THEN CAN GO DOWN
Please note that we are not a SEBI Registered Investor Adviser/PMS/ Broking House.
All the contents over here are for educational purposes only and are not investment advice or recommendations
offered to any person(s) with respect to the purchase or sale of the stocks / futures and options.
You are also requested to apply your prudence and consult your advisers in case you choose to act on
any such content available as WE claims no responsibilities for any of your actions or any outcome of
such action

Breakout on weekly chart in PFCNSE:PFC has broken out of a triangle on weekly chart with decent volume. As per height of the triangle, 200 could be a conservative positional target though waiting for break of 153 would be better for entry. Only concern is that this is slightly rising formation but not so much so it could still qualify as a right angle triangle.
