PFIZER🛒 Trade Plan: BUY
Parameter Value
Entry 4344
Stop Loss (SL) 3596
Risk 748 pts
Reward 4598 pts
Target 8942
Risk-Reward (RR) 6.1
🧠 Market Context
Metric Value
Last High 6269
Last Low 3596
Point Var 2673
✅ Technical Strengths
Strong confluence zone around 358–371 with multiple MTF & ITF demand overlaps.
Current price (Entry at 371) sits exactly at the Daily, Weekly, and 240M Demand Zones.
Tight Stop Loss (SL) just below 358 ensures defined risk.
All demand zones are freshly formed and respected, suggesting active buying interest.
📊 BEL Multi-Timeframe (MTF) Demand Zone Summary
TF Trend Logic Proximal Distal Avg
HTF (Yearly to Qtrly) UP Rally Base Rally 337 238 288
MTF (Monthly to Daily) UP BUFL / DMIP 387 363 375
ITF (240M to 60M) UP DMIP 369 360 364
🔹 All timeframes are aligned bullishly (UP trend), giving high confidence in upside continuation.
Target (8942) is far above recent highs (6269), suggesting ambitious long-term upside, possibly based on HTF breakouts or multi-month rallies.
RR of 6.1 is strong, especially for such a high-value stock and wide SL range.
Wide point variation (2673) suggests high volatility – suitable for swing/position traders with risk appetite.
✅ Summary Conclusion
Criteria Result
Trend (All TFs) Bullish ✅
Demand Zone Strength Strong, Deep Confluence ✅
Entry Zone Within Key Proximal DMIP ✅
RR 6.1 – Good but lower than BEL (12.6) and SBIN (32.6)
Volatility High – Requires larger capital or sizing control ⚠️
📌 Final Thought:
This PFIZER trade setup is very solid technically, especially for medium-to-long-term positional players. If you're prioritizing capital-efficient trades, BEL or SBIN may offer better RR vs. risk. But if you're aiming for large-cap momentum with long-term upside, this setup is a strong candidate
PFIZER trade ideas
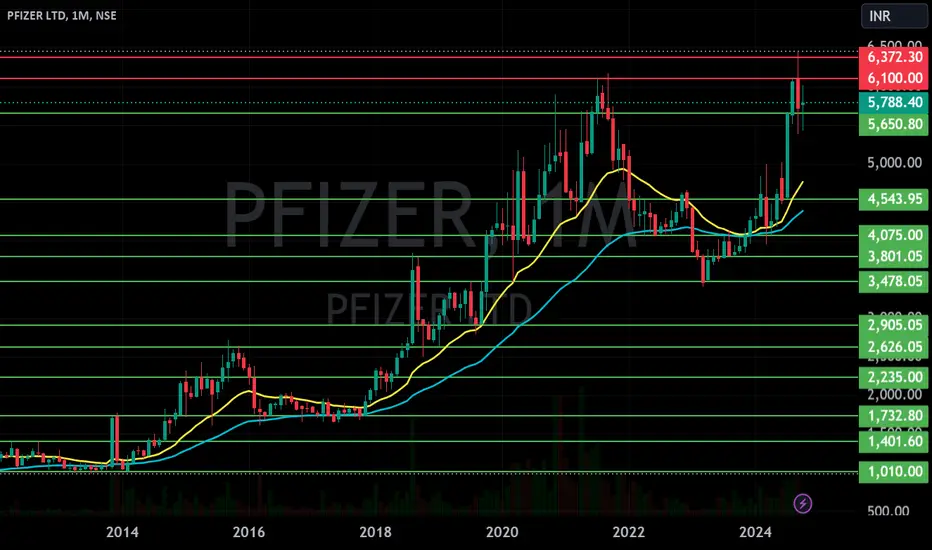
PFIZER | 2x returns | Breakout of 3 year resistance| PFIZER |
Monthly time frame
Stock has been moving along the upward blue dotted parallel channel since listing in 1994
Stock has bounced from a recent “higher low” made in Mar 2023
Stock riding above 20-, 50- & 200-month moving averages
RSI > 70, indicating solid bullish momentum
MACD crossover extended and is above the 0 line, indicating bullish momentum
Weekly time frame
Stock has been following the rounded bottom formation for last 3 years
Stock is trading near the white resistance trend line
Double Breakout on the cards, from the rounded bottom formation + trend line
Stock riding above 20-, 50- & 200-week moving averages
Golden crossover just now completed
RSI = 80, indicating aggressive bullish momentum
MACD extending the crossover & above the 0 line, indicating bullish momentum
Daily time frame
Stock riding along the dotted white parallel channel since Jul 2024
Breakout possible if the stock crosses the white resistance trend line of 6100
Stock riding above 20-, 50- & 200-day moving averages
RSI > 65, indicating bullish momentum
MACD is well above the 0 line, indicating solid momentum
Conclusion
Entry: 6,200
Stop Loss: 5,000
Target 1: 7,867
Target 2: 10,614
Target 3: 13,361
Fundamentals
ROCE = 22% {Ideal > 15}
ROE = 16.1% {Ideal > 15}
Stock PE (45) < Industry PE (48) {Stock not overvalued}
Int Coverage = 57 {Ideal > 2}
Debt to equity = 0.01 {Ideal value < 1}
Promoter stake has remained consistent over the years > 63%
FII and DII participation increased in previous 2 quarters

Pfizer It is trading near 200 ( ema + dma) and horizontal support in a weekly timeframe so, we can expect a reversal towards upwards.

Review and plan for 10th December 2024 Nifty future and banknifty future analysis and intraday plan.
Interesting stock charts.
This video is for information/education purpose only. you are 100% responsible for any actions you take by reading/viewing this post.
please consult your financial advisor before taking any action.
----Vinaykumar hiremath, CMT

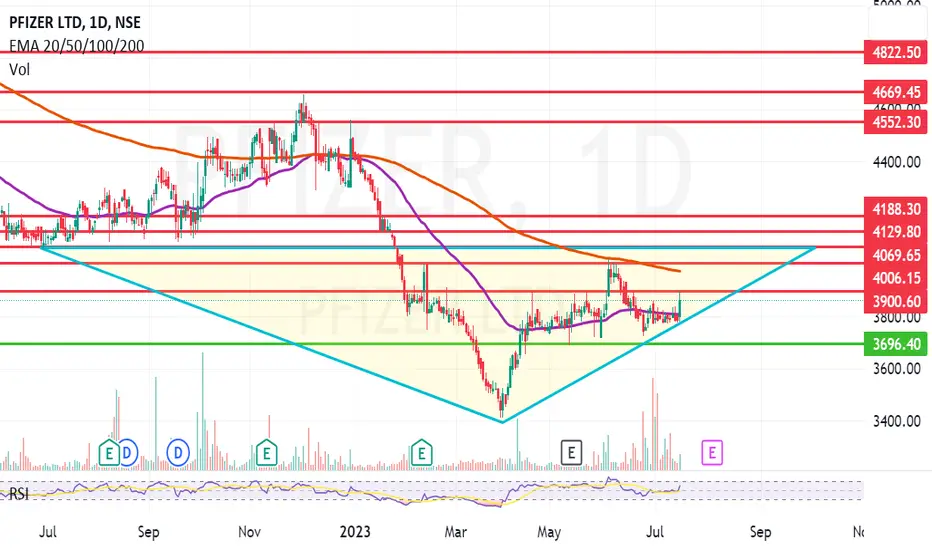
Pfizer Ltd. - Short Position AnalysisChart Overview:
The chart indicates that the stock is in a clear downtrend, following a descending channel pattern. The price is nearing a key horizontal support level (marked in black), and a breakdown below this level may present a shorting opportunity.
Trade Setup for Short Position:
1.Entry Trigger: Below ₹5,028 on a daily closing basis.
2.Targets:
Target 1: ₹4,885 (first demand zone).
Target 2: ₹4,760 (strong support and lower boundary of the descending channel).
3.Stop Loss: Above ₹5,187 (recent swing high and red-dotted resistance level).
4.Risk-Reward Ratio: Ensure a favorable ratio of at least 1:2.
Alternate Scenario:
If ₹5,028 holds as support, the stock might see a pullback toward ₹5,187, where selling pressure could resume.

PFIZER LTD S/R Support and Resistance Levels:
Support Levels: These are price points (green line/shade) where a downward trend may be halted due to a concentration of buying interest. Imagine them as a safety net where buyers step in, preventing further decline.
Resistance Levels: Conversely, resistance levels (red line/shade) are where upward trends might stall due to increased selling interest. They act like a ceiling where sellers come in to push prices down.
Breakouts:
Bullish Breakout: When the price moves above resistance, it often indicates strong buying interest and the potential for a continued uptrend. Traders may view this as a signal to buy or hold.
Bearish Breakout: When the price falls below support, it can signal strong selling interest and the potential for a continued downtrend. Traders might see this as a cue to sell or avoid buying.
20 EMA (Exponential Moving Average):
Above 20 EMA(50 EMA): If the stock price is above the 20 EMA, it suggests a potential uptrend or bullish momentum.
Below 20 EMA: If the stock price is below the 20 EMA, it indicates a potential downtrend or bearish momentum.
Trendline: A trendline is a straight line drawn on a chart to represent the general direction of a data point set.
Uptrend Line: Drawn by connecting the lows in an upward trend. Indicates that the price is moving higher over time. Acts as a support level, where prices tend to bounce upward.
Downtrend Line: Drawn by connecting the highs in a downward trend. Indicates that the price is moving lower over time. It acts as a resistance level, where prices tend to drop.
RSI: RSI readings greater than the 70 level are overbought territory, and RSI readings lower than the 30 level are considered oversold territory.
Combining RSI with Support and Resistance:
Support Level: This is a price level where a stock tends to find buying interest, preventing it from falling further. If RSI is showing an oversold condition (below 30) and the price is near or at a strong support level, it could be a good buy signal.
Resistance Level: This is a price level where a stock tends to find selling interest, preventing it from rising further. If RSI is showing an overbought condition (above 70) and the price is near or at a strong resistance level, it could be a signal to sell or short the asset.
Disclaimer:
I am not a SEBI registered. The information provided here is for learning purposes only and should not be interpreted as financial advice. Consider the broader market context and consult with a qualified financial advisor before making investment decisions.
SWING IDEA - PFIZERPrice Action and MACD have shown Convergence Divergence.
Also a new Higher High and Higher Low Pattern seems to be in play currently.
Another new MACD Crossover as well is happening now.
Could this cross take the Stock to a Swing High again?
While Weekly charts look good, even the MACD Cross on Monthly charts look promising as well.
Let's keep an eye on this.

Pfizer (PFE) – Post-Covid Growth Prospects Post-Covid Growth Prospects
Supporting Arguments
• Pipeline and portfolio advancement ensures better long-term growth prospects for Pfizer’s pharmaceutical business
• Favorable fundamental and technical analysis
Investment Thesis
Pfizer is an American multinational pharmaceutical and biotechnology corporation, specializing in the development of medicines and vaccines across a wide range of disciplines including oncology, immunology, rare diseases and other clinical areas. The Company’s stock experienced a lengthy period of falling prices after the peak earnings driven by the pandemic. In our opinion, the downturn has concluded with Pfizer now enhancing its pipeline and product lineup to secure long-term business growth.
The Company’s performance in the first half of 2024 was encouraging, as Pfizer's pipeline improvements began to translate into revenue growth within its core product portfolio. In Q2 2024, Pfizer's total revenue grew by 2.1% compared to the previous year, although the core portfolio’s growth is overshadowed by reduced earnings from COVID-19 treatments, including Paxlovid and Comirnaty. Excluding the impact of COVID products, the Company achieved a 13.4% y/y increase in revenue, with 7.5% of this growth coming from proceeds associated with Seagen, which was acquired late last year.
In our view, the updated product portfolio significantly strengthens Pfizer’s long-term revenue growth trajectory. The Company has wisely administered the funds earned during the COVID-19 pandemic, significantly revamping its product portfolio through both M&As and in-house R&D. The Q2 2024 report evoked target and recommendation revisions by analysts. We also expect Pfizer’s progress to facilitate further enhancement of investors’ perception of the Company as a growing business.
The first half of 2024 saw Pfizer achieving key milestones in the strategic directions announced at the start of the year. Key strategic priorities are establishing leadership in oncology, advancing pipeline development, and improving profitability. We believe the Company is set to emerge as the top oncology drugmaker by revenue this decade, thanks to both Seagen’s products and its own pipeline. During the Oncology Innovation Day in February 2024, Pfizer’s executives outlined their goal of introducing at least eight blockbuster cancer drugs by 2030 and expanding the proportion of biologics in their global revenue to 65%, from a previous 20% in 2023. This move is crucial as Merck (MRK), the current leader in oncology, is struggling to advance its next generation of cancer therapies. This also has the potential to support Pfizer’s valuations.
Pfizer is making strides towards improved profitability, reflecting a key strategic aim with visible results. Adjusted gross margin increased by 3 percentage points to reach 79%, thanks to a decrease in the revenue contribution from COVID products and the introduction of a cost optimization program for manufacturing, targeting $1.5 billion in cost savings by 2027 and projected to enhance gross margins. The ongoing cost reprioritization initiative aims to control the increase in operating expenses relative to revenue, potentially supporting EPS growth through 2024 and 2025.
PFE stock is trading at attractive valuations. Technical analysis implies a continued upside. PFE stock trades at P/E NTM of 10.4, which is below the Company’s pre-pandemic average of 12.5. We consider such a discount unfair, given the anticipated acceleration of Pfizer’s revenue and EPS growth over the next 2-3 years compared to the pre-covid dynamics.
The technical indicators imply the stock passed a reversal “hammer” pattern on August 16. The price rebounded from the lower limit of the new ascending channel, confirming that its position is confidently set above the 200-day moving average. In our view, the PFE price is starting a medium-term upward movement, which is evidenced by fundamental undervaluation and several technical signals: the golden cross, resistance at the lower boundary of the ascending price channel, and reversal candlestick patterns.
Based on this analysis, we assign a “Buy” rating to PFE stock with a target price of $32.90 over a two-month horizon. A stop-loss order is recommended to be set below the 200-day moving average at $26.90.

Bullish Continuation Setup in Pfizer LtdThis daily chart of Pfizer Ltd. shows a bullish continuation pattern with Fibonacci extension levels highlighting potential upside targets. The Fibonacci retracement is drawn from the recent swing low at ₹5,754.70 to the swing high at ₹6,338.25, with the price currently above the key retracement zone, suggesting a possible resumption of the uptrend.
The next significant targets based on the Fibonacci extensions are ₹6,698.95 (1.618 extension) and ₹7,282.50 (2.618 extension). These levels represent potential resistance zones where traders may consider taking profits.
Key Levels:
Support: ₹5,754.70 (Fibonacci 0.0 retracement)
Resistance: ₹6,338.25 (Fibonacci 1.0 retracement)
Potential Targets: ₹6,698.95 (1.618 Fibonacci extension), ₹7,282.50 (2.618 Fibonacci extension)
Analysis: The price action is showing bullish momentum as it approaches the 1.618 Fibonacci extension level. A sustained move above ₹6,338.25 could lead to further gains, targeting the next extension levels. Traders should monitor volume and price action around these key resistance levels to gauge the strength of the move.

PFIZERGud support from 20 & 200 MA on weekly time frame also above its recent resistance and volumes are significant on last two weekly candle it shows heavy buying from big fish
has gud potential for upside . Follow strict SL & Proper RISK REWARD RATIO. This is the only holy grail in the market..
SL 4500
FIRST TARGET - ITS ALL TIME HIGH WHICH IS 6100

PFIZER - LONGNSE:PFIZER Weekly rounding bottom showing bullish momentum in short to medium term on chart. With macd and buyers exactly near location.

PFIZER: Consolidating at the resistanceThe chart is self-explanatory as always :)
If you'd like to request an analysis, simply send us 100 coins as a token, and we'll be happy to post one for you.
⚠️Disclaimer: We are not registered advisors. The views expressed here are merely personal opinions. Irrespective of the language used, Nothing mentioned here should be considered as advice or recommendation. Please consult with your financial advisors before making any investment decisions. Like everybody else, we too can be wrong at times ✌🏻

Pfizer💥Pfizer💥-Nice Breakout
Capital to be deployed-20k
Investing Price-4835-50
Breakout Price-4835
Stoploss-4360
Targets-8070
#oswal #stockstowatch #StocksToBuy #StocksInFocus #stocks #StockMarket

Breakout may be coming soon. After a long consolidation, Pfizer looks ready to start its upward journey.
Entry: Above 4650
Targets: 6000
Stoploss: 4300

PFIZER BUY SIGNAL buy signal on pfizer based on scanner which i used got a buy signal on friday (02/02/2024). bought at 4703.
Profit 10% and trilling
sl 5%
(disclaimer: i too trade based on my analysis. do your research.)

PFIZERVERY GUD break out in pfizer. weekly breakout very gud target in near future. buy on this level 300 rs sl and 1000 rs target.

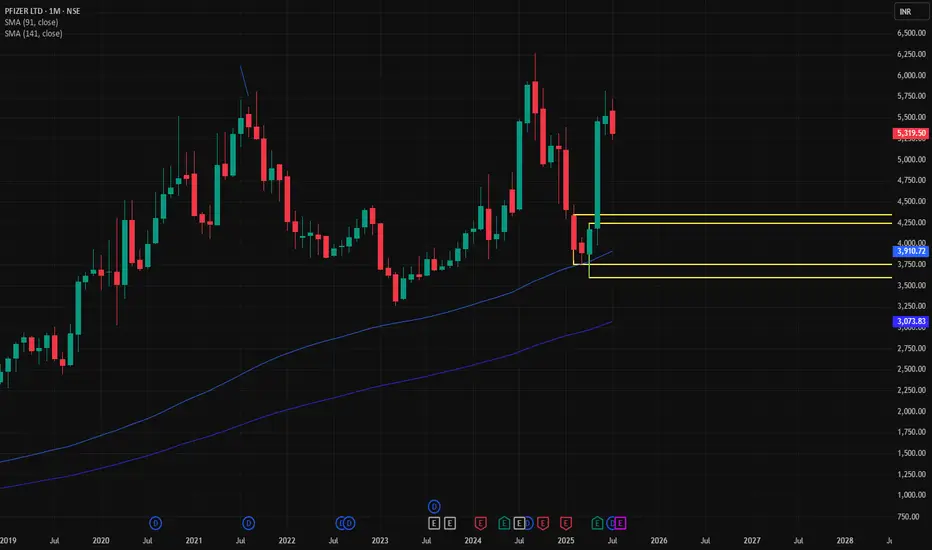
Pfizer getting ready to make rapid movesPfizer is one of the world’s leading pharmaceutical company specializes in vaccines, hospitals, internal medicines and inflammation and immunology. Their manufacturing capacity is 4 billion tablets annually and supplied in neighboring countries of India.
Pfizer CMP is 3866. Negative aspects of the company are high valuation (P.E. = 28.3), MFs are decreasing stake. Positive aspects of the company are increasing annual net profits, improving cash from operations annual, no debt, FIIs are increasing stake and zero promoter pledge.
Entry can be taken after closing above 3901. Targets in the stock will be 3975 and 4006. Long term target in the stock will be 4069 and 4129. Stop loss in the stock should be maintained at closing below 3696.
Pfizer bullishPfizer is lookng bullish. Kindly do your own study before taking any position.
Monthly ABC wave completed.


KalaGhazi|Pfizer They're buying Seagen for $43 billion so they can build an anti-cancer franchise. They need this. Pfizer has a strong pipeline, but when will they get behind their migraine drug, which was part of an acquisition? They're doing nothing with it.


Long PfizerPfizer to breakout of 4500 for multiple times on monthly chart and it can break this time on closing above 4550. First and Second Target marked
