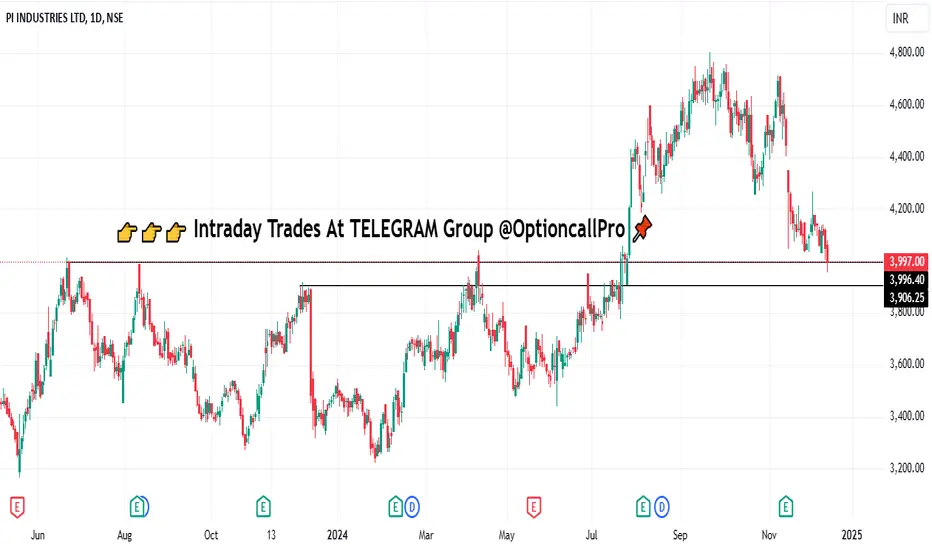
PI Industries BuyPI Industries seems to take support at trend line. Buy @CMP (4170) with SL of 4000 and target of 4340 and 4700.
Next report date
—
Report period
—
EPS estimate
—
Revenue estimate
—
109.45 INR
16.60 B INR
79.08 B INR
81.12 M
About PI INDUSTRIES LTD
Sector
Industry
Website
Headquarters
Gurgaon
Founded
1946
ISIN
INE603J01030
FIGI
BBG000CXGMM3
PI Industries Ltd. engages in the manufacturing and selling of agro-inputs, which comprises of crop protection chemicals and plant growth nutrients. Its products include insecticides, fungicides, and herbicides. The firm also focuses on activities, such as research and development, market research, and investment. The company was founded by P. P. Singhal in 1946 and is headquartered in Gurgaon, India.
Related stocks

PII Industries - Rectangular BreakoutNSE:PIIND is breaking out of Rectangle and you cna buy at this Point. 1st Target would be 4000 and Second Target would be 4070. If you are ready for Risk Reward, you can Target for 4300, with Trailing Stop loss.

PI INDUSTRIES LTD at Key Resistance !!This is the Weekly chart of PI INDUSTRIES LTD.
PIIND having good law of polarity at 4300-4400 range.
If this level is sustain , then we may see lower prices in PIIND.
Thank You !!
PIIND bullish zoneThe bullish inverse head and shoulders pattern is a chart formation that signals a potential shift from a bearish trend to a bullish one
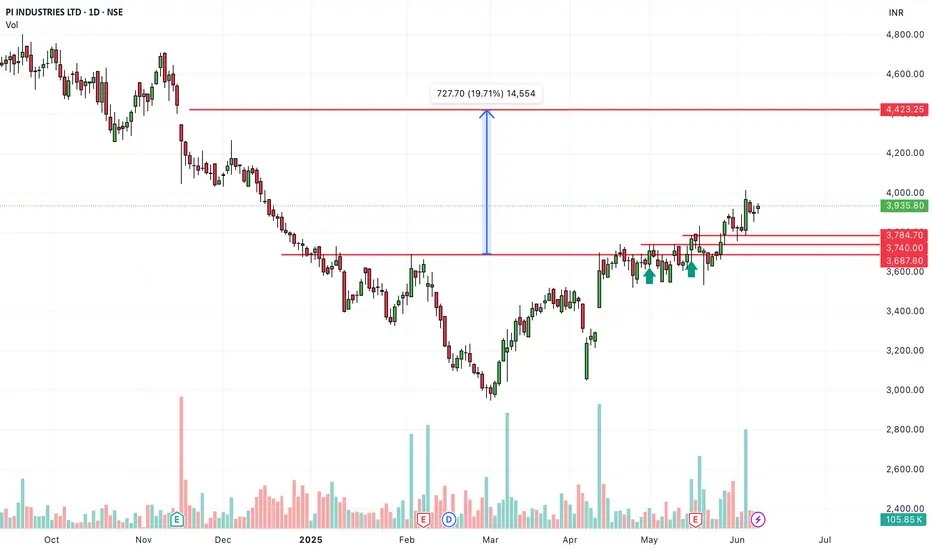
PI Industries Daily AnalysisPI Industries has broken out and closed above its recent congestion zone, as per Price Action Analysis. The stock appears poised to move toward the target levels of 4013 and 4172, with a recommended stop-loss at 3535.
This view is derived from Price Action Analysis. Traders are advised to conduct t

PIIND : Short Oppty : 1 HR TFPIIND : Short Oppty : 1 HR TF
Reason 1 : Reversal from Support turned Resistance Region
Reason 2 : Sharp Reversal with after strong Red hammer like candle from the sweep spot
Reason 3 : Reversal from 200 EMA was seen earlier , Hoping to see the same behaviour now
I have not traded this one since

PI Industries short to mid term analysisPI Industries is looking very positive on charts. We can expect the previous high of 4644+ once it crosses and sustains 3850. On the upside, it can face some resistance at 4263, but if it crosses it, we can expect levels of 4644+. But if it breaches 3429 on the downside, then we can expect it to tak

PIIND Long TradeHello,
Trend-Based Analysis. Buy the Dips, Sell The Rallies, Also Following the Trend. Let's see where the Price Action takes us, Riding the wave. Potential trade setups based on trend momentum.
Technical analysis based on trend identification and momentum, Looking for high-probability setups with
PIIND : at Interesting Risk and Reward1. Key Analysis and Levels
Wave 4 (Primary) Zone (₹3981-₹4295):
The price is currently in the Wave 4 corrective zone, as per Elliott Wave Theory.
This zone is critical for determining whether the upward trend will resume ( Wave 5 ) or break down further.
Wave C (Minor) Completion Zone:
Rep


See all ideas
Summarizing what the indicators are suggesting.
Neutral
SellBuy
Strong sellStrong buy
Strong sellSellNeutralBuyStrong buy
Neutral
SellBuy
Strong sellStrong buy
Strong sellSellNeutralBuyStrong buy
Neutral
SellBuy
Strong sellStrong buy
Strong sellSellNeutralBuyStrong buy
An aggregate view of professional's ratings.
Neutral
SellBuy
Strong sellStrong buy
Strong sellSellNeutralBuyStrong buy
Neutral
SellBuy
Strong sellStrong buy
Strong sellSellNeutralBuyStrong buy
Neutral
SellBuy
Strong sellStrong buy
Strong sellSellNeutralBuyStrong buy
Displays a symbol's price movements over previous years to identify recurring trends.
Frequently Asked Questions
The current price of PIIND is 4,092.10 INR — it has decreased by −0.53% in the past 24 hours. Watch PI INDUSTRIES LTD stock price performance more closely on the chart.
Depending on the exchange, the stock ticker may vary. For instance, on NSE exchange PI INDUSTRIES LTD stocks are traded under the ticker PIIND.
PIIND stock has fallen by −0.80% compared to the previous week, the month change is a −1.87% fall, over the last year PI INDUSTRIES LTD has showed a 4.66% increase.
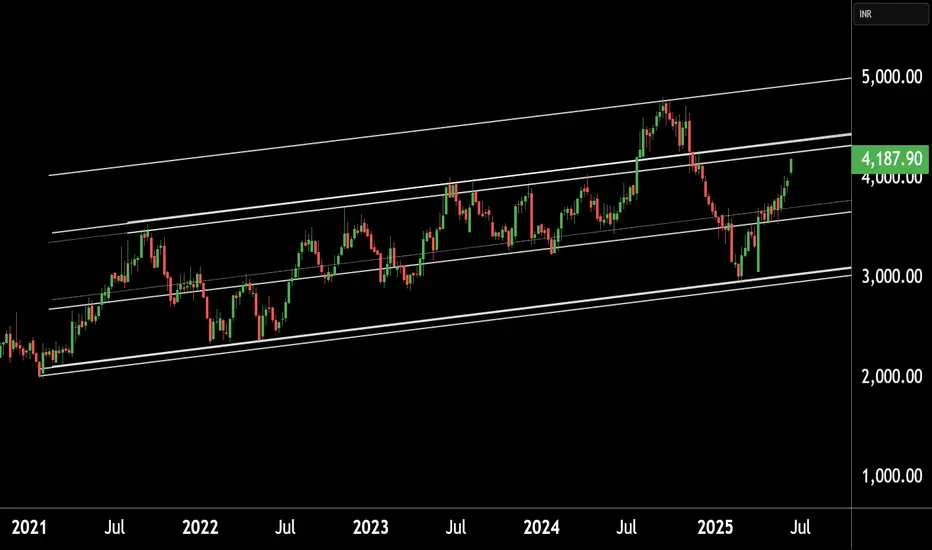
We've gathered analysts' opinions on PI INDUSTRIES LTD future price: according to them, PIIND price has a max estimate of 5,000.00 INR and a min estimate of 2,800.00 INR. Watch PIIND chart and read a more detailed PI INDUSTRIES LTD stock forecast: see what analysts think of PI INDUSTRIES LTD and suggest that you do with its stocks.
PIIND reached its all-time high on Sep 20, 2024 with the price of 4,804.05 INR, and its all-time low was 68.00 INR and was reached on Jun 21, 2011. View more price dynamics on PIIND chart.
See other stocks reaching their highest and lowest prices.
See other stocks reaching their highest and lowest prices.
PIIND stock is 2.09% volatile and has beta coefficient of 0.85. Track PI INDUSTRIES LTD stock price on the chart and check out the list of the most volatile stocks — is PI INDUSTRIES LTD there?
Today PI INDUSTRIES LTD has the market capitalization of 621.07 B, it has increased by 1.53% over the last week.
Yes, you can track PI INDUSTRIES LTD financials in yearly and quarterly reports right on TradingView.
PI INDUSTRIES LTD is going to release the next earnings report on Aug 12, 2025. Keep track of upcoming events with our Earnings Calendar.
PIIND earnings for the last quarter are 21.70 INR per share, whereas the estimation was 23.63 INR resulting in a −8.18% surprise. The estimated earnings for the next quarter are 30.47 INR per share. See more details about PI INDUSTRIES LTD earnings.
PI INDUSTRIES LTD revenue for the last quarter amounts to 17.87 B INR, despite the estimated figure of 18.47 B INR. In the next quarter, revenue is expected to reach 22.61 B INR.
PIIND net income for the last quarter is 3.31 B INR, while the quarter before that showed 3.73 B INR of net income which accounts for −11.32% change. Track more PI INDUSTRIES LTD financial stats to get the full picture.
PI INDUSTRIES LTD dividend yield was 0.47% in 2024, and payout ratio reached 14.62%. The year before the numbers were 0.39% and 13.53% correspondingly. See high-dividend stocks and find more opportunities for your portfolio.
As of Jul 27, 2025, the company has 6.34 K employees. See our rating of the largest employees — is PI INDUSTRIES LTD on this list?
EBITDA measures a company's operating performance, its growth signifies an improvement in the efficiency of a company. PI INDUSTRIES LTD EBITDA is 22.22 B INR, and current EBITDA margin is 27.55%. See more stats in PI INDUSTRIES LTD financial statements.
Like other stocks, PIIND shares are traded on stock exchanges, e.g. Nasdaq, Nyse, Euronext, and the easiest way to buy them is through an online stock broker. To do this, you need to open an account and follow a broker's procedures, then start trading. You can trade PI INDUSTRIES LTD stock right from TradingView charts — choose your broker and connect to your account.
Investing in stocks requires a comprehensive research: you should carefully study all the available data, e.g. company's financials, related news, and its technical analysis. So PI INDUSTRIES LTD technincal analysis shows the neutral today, and its 1 week rating is buy. Since market conditions are prone to changes, it's worth looking a bit further into the future — according to the 1 month rating PI INDUSTRIES LTD stock shows the buy signal. See more of PI INDUSTRIES LTD technicals for a more comprehensive analysis.
If you're still not sure, try looking for inspiration in our curated watchlists.
If you're still not sure, try looking for inspiration in our curated watchlists.