PI Industries BuyPI Industries seems to take support at trend line. Buy @CMP (4170) with SL of 4000 and target of 4340 and 4700.
PIIND trade ideas

PII Industries - Rectangular BreakoutNSE:PIIND is breaking out of Rectangle and you cna buy at this Point. 1st Target would be 4000 and Second Target would be 4070. If you are ready for Risk Reward, you can Target for 4300, with Trailing Stop loss.

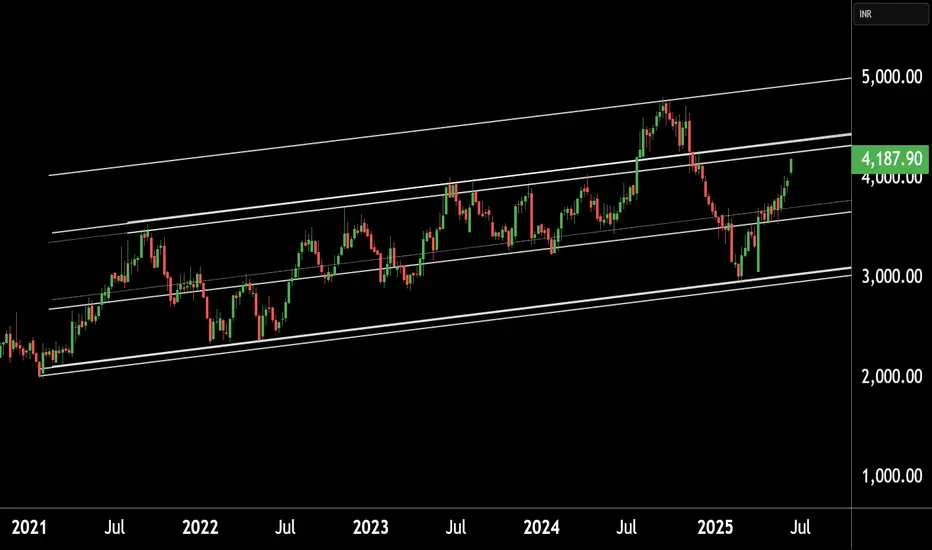
PI INDUSTRIES LTD at Key Resistance !!This is the Weekly chart of PI INDUSTRIES LTD.
PIIND having good law of polarity at 4300-4400 range.
If this level is sustain , then we may see lower prices in PIIND.
Thank You !!
PIIND bullish zoneThe bullish inverse head and shoulders pattern is a chart formation that signals a potential shift from a bearish trend to a bullish one
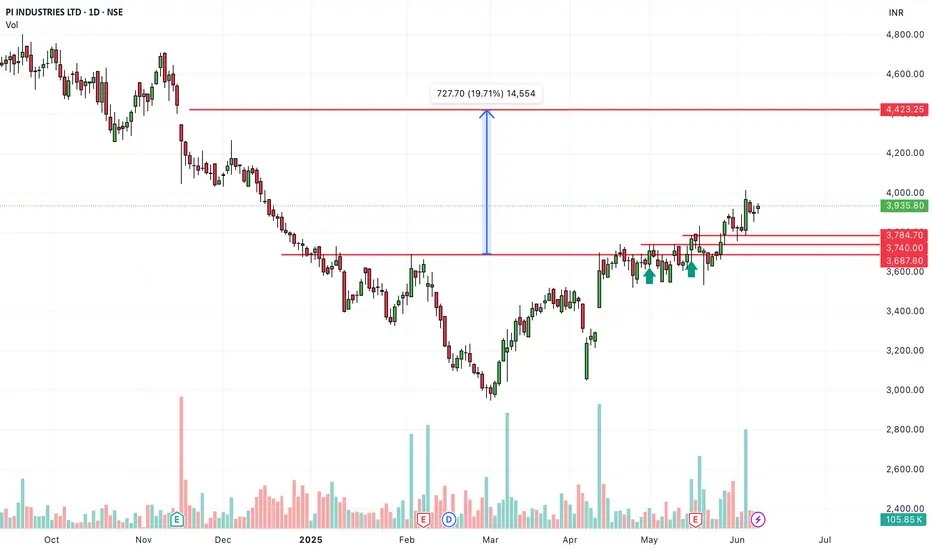
PI Industries Daily AnalysisPI Industries has broken out and closed above its recent congestion zone, as per Price Action Analysis. The stock appears poised to move toward the target levels of 4013 and 4172, with a recommended stop-loss at 3535.
This view is derived from Price Action Analysis. Traders are advised to conduct their own technical analysis and exercise due diligence before taking any trading decisions.

PIIND : Short Oppty : 1 HR TFPIIND : Short Oppty : 1 HR TF
Reason 1 : Reversal from Support turned Resistance Region
Reason 2 : Sharp Reversal with after strong Red hammer like candle from the sweep spot
Reason 3 : Reversal from 200 EMA was seen earlier , Hoping to see the same behaviour now
I have not traded this one since my capital is being utilised in another trades.
May go for it on Monday, 17th March . since Tomorrow is a Holi Holiday

PI Industries short to mid term analysisPI Industries is looking very positive on charts. We can expect the previous high of 4644+ once it crosses and sustains 3850. On the upside, it can face some resistance at 4263, but if it crosses it, we can expect levels of 4644+. But if it breaches 3429 on the downside, then we can expect it to take support between 3266-3140. Imp short covering levels on the downside would be 3012-2885.

PIIND Long TradeHello,
Trend-Based Analysis. Buy the Dips, Sell The Rallies, Also Following the Trend. Let's see where the Price Action takes us, Riding the wave. Potential trade setups based on trend momentum.
Technical analysis based on trend identification and momentum, Looking for high-probability setups within the prevailing trend.
Analyzing the current market trend and potential future price movement. Focusing on risk management and reward-to-risk ratios.
Details is Mentioned in Chart, Read carefully.. .
PIIND : at Interesting Risk and Reward1. Key Analysis and Levels
Wave 4 (Primary) Zone (₹3981-₹4295):
The price is currently in the Wave 4 corrective zone, as per Elliott Wave Theory.
This zone is critical for determining whether the upward trend will resume ( Wave 5 ) or break down further.
Wave C (Minor) Completion Zone:
Represents the lower boundary of the current corrective structure.
A bullish reversal is possible here if demand sustains.
Target at Wave 5 (₹4922-₹5041):
If the upward trend resumes, this is the extended retracement of Wave 3, and the logical profit zone for bulls.
Stop Loss Level (₹3980):
Positioned just below the Wave 4 corrective zone to manage downside risk.
2. Trade Setup
A. Long Trade Setup:
Why Long?
The price is at a critical support area within Wave 4, where buyers might step in.
Potential for continuation of the uptrend to form Wave 5.
Entry: Between ₹4000-₹4100, after observing bullish reversal signals (e.g., bullish candlesticks, volume surge).
Stop Loss: ₹3980, slightly below the Wave C completion zone.
Targets:
₹4700: Intermediate target at prior swing resistance.
₹4922-₹5041: Final target at Wave 5 extension.
B. Short Trade Setup (If Support Fails):
Why Short?
A breakdown below ₹3980 would invalidate the Wave 4 support zone, signaling further downside.
Bearish continuation could lead to lower Fibonacci levels or prior demand zones.
Entry: Below ₹3980 after confirmation of breakdown with volume.
Targets:
₹3700: Immediate support level.
₹3250-₹3300: Major demand zone from previous Wave 2.
Stop Loss: ₹4080 to limit risk on false breakdowns.
3. Explanation of Analysis
Wave 4 Correction:
Wave 4 is typically a corrective phase after a strong Wave 3 impulse. It often tests Fibonacci retracement zones ( ₹3981-₹4295 ).
Wave 5 Target:
If the uptrend resumes, Wave 5 is expected to extend to 113%-127% of Wave 3’s range ( ₹4922-₹5041 ).
Bearish Scenario:
Failure to hold Wave 4 corrective support would signal deeper correction, potentially targeting previous Wave 2 levels.
4. Confirmation Signals
For Long Entry:
Price stability within ₹3981-₹4295 and bullish reversal patterns like hammer candles or bullish divergence (e.g., RSI).
Break above ₹4300 confirms Wave 4 completion.
For Short Entry:
Decisive breakdown below ₹3980 with strong bearish momentum (e.g., large red candle, volume spike).
5. Risk Management
Risk limited to 1-2% of trading capital per trade.
Use partial profit booking at intermediate targets (e.g., ₹4700) and move stop-loss to breakeven.
Why This Plan Works
This strategy leverages Elliott Wave Theory to anticipate high-probability reversal or continuation scenarios. It accounts for both bullish and bearish outcomes, ensuring a structured approach to risk and reward. The key levels and confirmation signals allow for timely and informed decision-making.


PIIND S/RSupport and Resistance Levels:
Support Levels: These are price points (green line/shade) where a downward trend may be halted due to a concentration of buying interest. Imagine them as a safety net where buyers step in, preventing further decline.
Resistance Levels: Conversely, resistance levels (red line/shade) are where upward trends might stall due to increased selling interest. They act like a ceiling where sellers come in to push prices down.
Breakouts:
Bullish Breakout: When the price moves above resistance, it often indicates strong buying interest and the potential for a continued uptrend. Traders may view this as a signal to buy or hold.
Bearish Breakout: When the price falls below support, it can signal strong selling interest and the potential for a continued downtrend. Traders might see this as a cue to sell or avoid buying.
20 EMA (Exponential Moving Average):
Above 20 EMA: If the stock price is above the 20 EMA, it suggests a potential uptrend or bullish momentum.
Below 20 EMA: If the stock price is below the 20 EMA, it indicates a potential downtrend or bearish momentum.
Trendline: A trendline is a straight line drawn on a chart to represent the general direction of a data point set.
Uptrend Line: Drawn by connecting the lows in an upward trend. Indicates that the price is moving higher over time. Acts as a support level, where prices tend to bounce upward.
Downtrend Line: Drawn by connecting the highs in a downward trend. Indicates that the price is moving lower over time. It acts as a resistance level, where prices tend to drop.
RSI: RSI readings greater than the 70 level are overbought territory, and RSI readings lower than the 30 level are considered oversold territory.
Combining RSI with Support and Resistance:
Support Level: This is a price level where a stock tends to find buying interest, preventing it from falling further. If RSI is showing an oversold condition (below 30) and the price is near or at a strong support level, it could be a good buy signal.
Resistance Level: This is a price level where a stock tends to find selling interest, preventing it from rising further. If RSI is showing an overbought condition (above 70) and the price is near or at a strong resistance level, it could be a signal to sell or short the asset.
Disclaimer:
I am not a SEBI registered. The information provided here is for learning purposes only and should not be interpreted as financial advice. Consider the broader market context and consult with a qualified financial advisor before making investment decisions.

Ascending triangle breakoutGood volume buildup in daily and weekly timeframe.
Ascending triangle breakout with good volume.
Fundamental's are good.
DII stake increased compared to last year.
NOTE: I do my analysis, do yours before trade.

PIIND 15 mins bullish flag patternRisky bullish formation in this stock. May watch it for study purposes. risky trade.

pi industrygloble condtion is very wrost to stock market
this market codtion, like this stock, give green portpolio
Q1 2025 is beter numbers and stock trading above sentimental 4000 level
breakout ascending triangle beuty of stock
The global market is at red but this stock is closing its life high

PIIND : A must on the watchlist🎯 The chart is pretty self-explanatory as always.
🎯 A must on the watchlist.
⚠️Disclaimer: We are not registered advisors. The views expressed here are merely personal opinions. Irrespective of the language used, Nothing mentioned here should be considered as advice or recommendation. Please consult with your financial advisors before making any investment decisions. Like everybody else, we too can be wrong at times ✌🏻

PI INUSTRIES A long time(1 Year) resistance Breakout
.
I am not a SEBI Registered Analyst. Anything posted here is my own analysis and views. This is created for educational purposes only. Always consult your Financial Advisor before taking any decision or trade.

PIND | PI INDUSTRIES on Monthly BreakoutPIND | PI INDUSTRIES on Monthly Breakout
$NSE:PIND
#Forming a rising wedge on Monthly Chart
#Bullish Technically Data
# Trading Range 4061/4455/4607 around the trend
#Bearish only below sp2

PIINDPI INDUSTRIES has breakout 1 year résistance level and TGT up to 30%+ and this is just for educational purpose only

PIINDYearlong trend breakout. Wait for the strong close and good bullish trend. Do your own analysis before entering any trade. Kindly boost the idea if it helps you. Thank you

PIIND Near BreakoutPIIND is around strong resistance. If stock sustains above 4050 big move is expected.

PI Industries chart analysis PI Industries chart analysis on daily time frame.Please share your valuable feedback.
