PIIND is testing its critical resistance. Entered a "long" This script is testing the critical resistance for the third time since last January. As per the momentum and smart money theory I think there will be a big move in couple of days. www.tradingview.com
PIIND trade ideas

20% Upside Potential idea 🔥 - PI Industries🔥 20% Upside Potential idea - PI Industires
This Trade Ideas is a type of Equity Investment which is designed to give you 10% to 20% return in short-term via #Equity #Investment.
✅ Stock Name - NSE:PIIND
Trade Process :-
✅ - Buy only at Buy Level as recommended in the chart. Use GTT feature available with all online brokers
✅ - On successful purchase, immediately create a SL GTT (Stop Loss level asper chart).
✅ - Once Stock Price is at Target 1 level, move your SL to Cost Price or 3% down from Target 1.
✅ - Keep Trailing the SL as Stock Price moves to next Targets.
Thanks

My view on PIINDDouble bottom breakout
Possible in PIIND
looking good for short term
Looking tgt 4000-4100-4200++
Keeping on radar PIIND 4000 CE

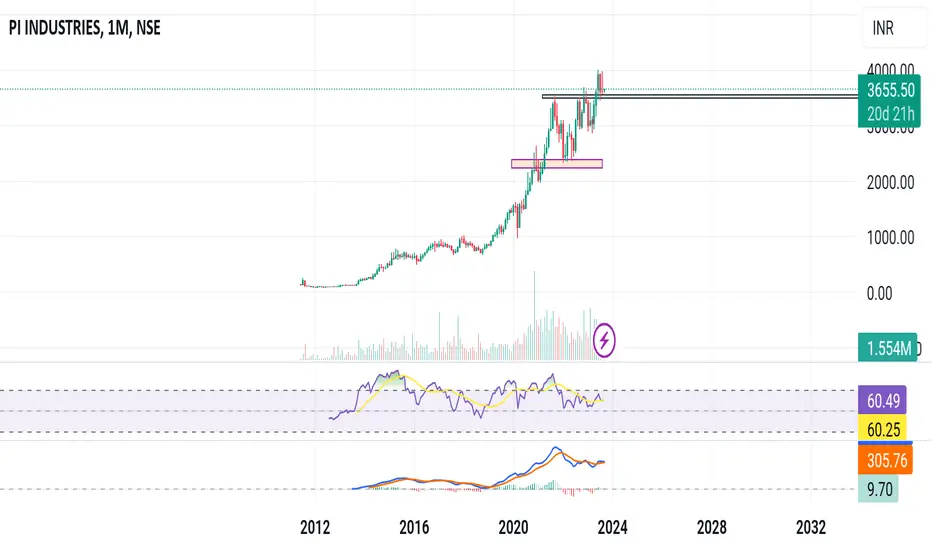
PIIND : turned goldPi industries just turned gold on our CPL indicator.
The stock has been in consolidation for over 2 years and seems to be starting its journey upwards with a 1:4 Risk reward ratio

Double Bottom Neckline Breakout Soon - PIIND📊 Script: PIIND
📊 Sector: Chemicals
📊 Industry: Chemicals
Key highlights: 💡⚡
📈 Script is trading near neckline of Double bottom patter, we may see breakout of it.
📈 Breakout is above 3891 level.
📈 One can go for Swing Trade only candle closing above 3891 level.
BUY ABOVE ONLY - 3891
⏱️ C.M.P 📑💰- 3867
🟢 Target 🎯🏆 - 4076
⚠️ Stoploss ☠️🚫 - 3763
⚠️ Important: Always maintain your Risk & Reward Ratio.
✅Like and follow to never miss a new idea!✅
Disclaimer: I am not SEBI Registered Advisor. My posts are purely for training and educational purposes.
Eat🍜 Sleep😴 TradingView📈 Repeat 🔁
Happy learning with trading. Cheers!🥂

PIIND--Rally base Rally This stock is continuously rising...
price is moving in a channel...observed rally from 2900 levels, taken the support from trendline multiple times...
we have a chance of continuation in this stock.
rally base rally is going to observe in this stock.
wait for the price to break the channel and it will retest to the channel again for continuation.
if failed to go long from this place price will test the demand zone at 2900 and 2500 levels...
once it failed will update the short side chart.
keep looking for long side in this stock.

PIIND: Outperformer name in agrochem space
The following stock is largely outperforming the agrochem space
in last couple of weeks its in an uptrend
The agrochem other peers are in downtrend largely
the result were strong and there are high chnaces for the stock to gain market share and become even stronger
coming on technicals, it gave a fake downtrend and emerged stronger thereafter
its trading n an upward slioping trendline
expected target on higher side are
1) 4288
2) 4767
3) 5540
all above with a strict stop below 3250-3230 area

PI Industries: a Power Packed Performer trying to form a bottom.PI Industries Ltd. is an Agri-sciences company with strong presence in both domestic and export market. The company has commercialized 4 new molecules during this year, which included 2 new Electronic Chemicals. PI Industries Ltd CMP is 3484.35.
The Negative aspects of the company are High Valuation (P.E. = 35.3), MFs are decreasing stake. The positive aspects of the company are No debt, zero promoter pledge, FIIs are increasing stake, improving annual net profit, Improving cash from operations annual.
Entry can be taken after closing above 3515. Targets in the stock will be 3582 and 3646. The long-term target in the stock will be 3741 and 3805. Stop loss in the stock should be maintained at Closing below 3224.
The above information is provided for educational purpose, analysis and paper trading only. Please don't treat this as a buy or sell recommendation for the stock. We do not guarantee any success in highly volatile market or otherwise. Stock market investment is subject to market risks which include global and regional risks. We will not be responsible for any Profit or loss that may occur due to any financial decision taken based on any data provided in this message.

PI Industry Not a Tip, just sharing my personal View, Very Small in It, If Hits I'll happily accepted

PIINDThese are swing ideas which you can add your watchlist and analysis for yourself !
Keep on your radar 📡
This content only education purpose!
❗I am not sebi ragister❗
PI industries Bullish M pattern active ready for big upswing On Our Harmonic pattern indicator based trade setup take trade as explained below :-
Early trades Buy or sell below/ above 23.6 %, safe trades buy or sell above / below 41% , after taking trade next upside or downside levels will be target ,
When reverse buy or sell signal appear then book profit on Target or trail SL to 23.6 % If trailing SL hit then early trade can be taken above or below 23.6 and safe trade can b taken above/ below 41% ..
Please note:-
It's working on news based and volitile market very well so exit if SL hit

W pattern in PIINDon a daily time frame of PIIND we can see it is forming a W pattern which is one of the bullish pattern so in a upcoming days we may see a good upside move in PIIND

PIIND Research Report (Rating: 8.5)Introduction
PI Industries is an integral player in its sector, and its financial trajectory demonstrates the complexities of the economic landscape it operates within. From increasing revenues to changes in profitability margins, the company exhibits a tale of growth, with some reservations.
Industry Analysis
While the specific industry isn't mentioned, PI Industries' financial metrics suggest it competes in a sector that has seen growth in recent years, evident from the increasing total revenue and income. The company has managed to stay ahead and leverage opportunities, as demonstrated by its growing EPS and CEPS.
Historic Performance
Over the past five years, PI Industries has seen an overall uptrend in both revenue and net profit margins. This growth trajectory, particularly in total income, which has been increasing at an average rate of 22.16% over the past five years, illustrates the company's strong market position and operational efficiency.
P/E Ratio Analysis
With a current P/E ratio of 40.5, PI Industries is priced higher than the industry's average. This might suggest that investors expect higher growth from PI Industries in the future or the stock could be overvalued.
D/E Ratio Analysis
With a D/E ratio of 0, PI Industries operates without leveraging any debt, indicating a strong financial stability.
Quick Ratio Analysis
A quick ratio of 3.53 signifies that PI Industries has a strong liquidity position, and can cover its short-term obligations with ease.
ROE Analysis
The current ROE stands at 19.09%, suggesting that the company is effectively generating profit from its shareholders' equity.
Net Profit Margin Analysis
Despite minor fluctuations, the net profit margin has increased from 14.35% in 2019 to 19.32% in 2023. The five-year average at 16% indicates a consistent profitability trend. The net profit margin saw a dip in 2020 by -6.76%, but recovered strongly with a growth of 25.64% in 2021.
Total Income Analysis
The total income of the company has consistently grown from ₹2,900.90 in 2019 to ₹6,429.30 in 2023. The growth rate of total income has been consistent, with the most significant rise of 30.85% in 2021.
Total Revenue Analysis
Total revenue growth mirrors the total income growth, escalating from ₹2840.90 in 2019 to ₹6270.40 in 2023. Revenue growth percentages have been healthy, indicating the company's persistent market demand.
EPS Analysis
The EPS has exhibited substantial growth from ₹29.56 in 2019 to ₹79.84 in 2023, showcasing the company's increasing profitability on a per-share basis. Notably, the EPS saw a massive 51.59% growth in 2021.
CEPS Analysis
CEPS growth is commendable as well, moving from ₹36.25 in 2019 to ₹94.28 in 2023. The increase in CEPS by 40.76% in 2023 emphasizes the company's growing cash profitability.
Interest Payments Analysis
Interest payments surged in 2021 to ₹28.10 but reduced significantly in 2022, suggesting a potential reduction in borrowings or renegotiated terms.
Interest Payments to Total Income
This ratio has remained relatively consistent, emphasizing the manageable nature of their interest obligations.
Total Income to Expenditure Analysis
The ratio indicates an improvement in the company's efficiency, rising from 1.28 in 2019 to 1.34 in 2023.
Return on Net Worth/Equity Analysis
A sharp drop is observed from 2019's 90.33% to 0.79% in 2023, indicating potential concerns in the company's use of equity. The five-year average at 46.92% is commendable but needs scrutiny considering the recent drop.
ROCE Analysis
ROCE has seen growth from 9.95% in 2019 to 10.21% in 2023, suggesting efficient capital utilization. The average ROCE over the five years stands at 8.61%, showing consistent capital employment.
ROA Analysis
ROA has improved from 4.53% in 2019 to 4.96% in 2023, displaying better asset utilization. The five-year average ROA is at 4.15%.
Financial Health Summary
PI Industries has demonstrated growth and profitability. Its no-debt status combined with increasing revenues, consistent net profit margins, and impressive EPS and CEPS growth all point to a strong financial health. However, the sharp decline in Return on Net Worth/Equity needs investigation.
Stock Rating
Considering the overall performance, growth prospects, and potential concerns, PI Industries receives a rating of 8.5/10

New beginning in pi Industries Already a multibagger and leader in agrochemicals. Large cap stock. After two years of consolidation, breakout and retesting, stock is ready for upmove
PIIND BREAKOUT Plus Retest On Weekly PIIND
Everything is clearly mentioned in the chart itself.
For Learning purpose.

A good candidate for swing. Perfect breakout and Retested Structure formed. One can go long from here with minimum sl.
Or one can add it for long time because of a good fundamentals and pattern forming in chart.

pi industries ascending breakout retest buy @ 3631 target 3988,pi industries ascending breakout retest
buy @ 3631 target 3988, 4099, 4339
risk reward 1.5
its just a view trade at your own risk
sl@3275

piind all target doneall target done in PI INDUSTRIES within 100 days and ROI more than 30% which is our 3rd target.
if you bought at 2700 and still you holding now your ROI is 45% approx.
we forgot to post this stock about target achievement.
follow for more stocks.
(note: we are not SEBI registered so please do your own analysis also)

PI INDUSTRIES PI Industries LTP 3972
Bullish RSI and MACD with breakout on weekly chart. Targets 5000/6000 with Stop-loss below 3800.

Cup & holder breakout | PI IndustryThe stock has given cup & holder breakout. The stock is open for 4400+ levels

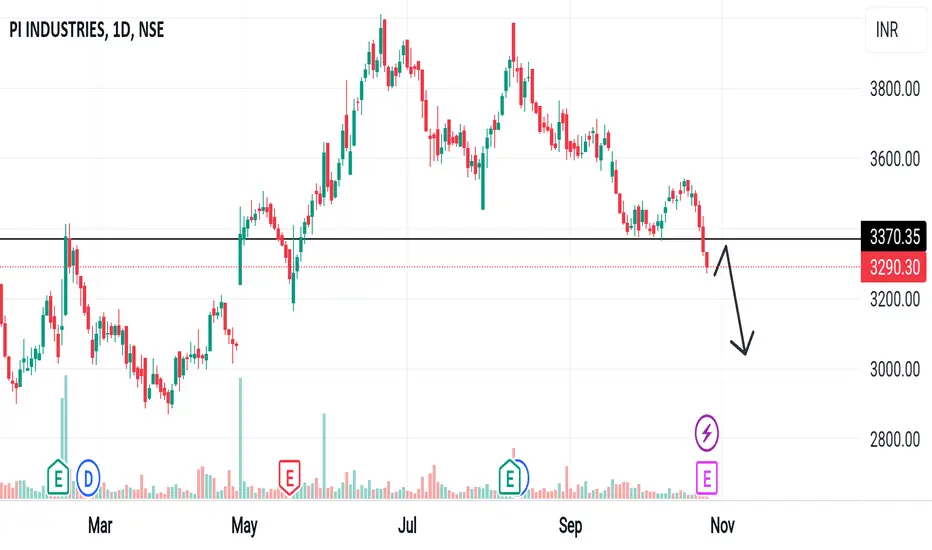
Confirmed Bearish Divergence in PIINDPrice at Major Resistance+
Bearish Divergence+
Bearish Piercing+
Good opportunity for option sellers(Bearish View).


PI INDUSTRIES DAILY CHART BREAKOUTPi industries has broken out of its resistance of 75%.
Cmp 3616.80 Target 4210 SL 3490
Not a suggestion, it's an observation.
