PIIND ANALYSISCHART IS SELF EXPLANATORY
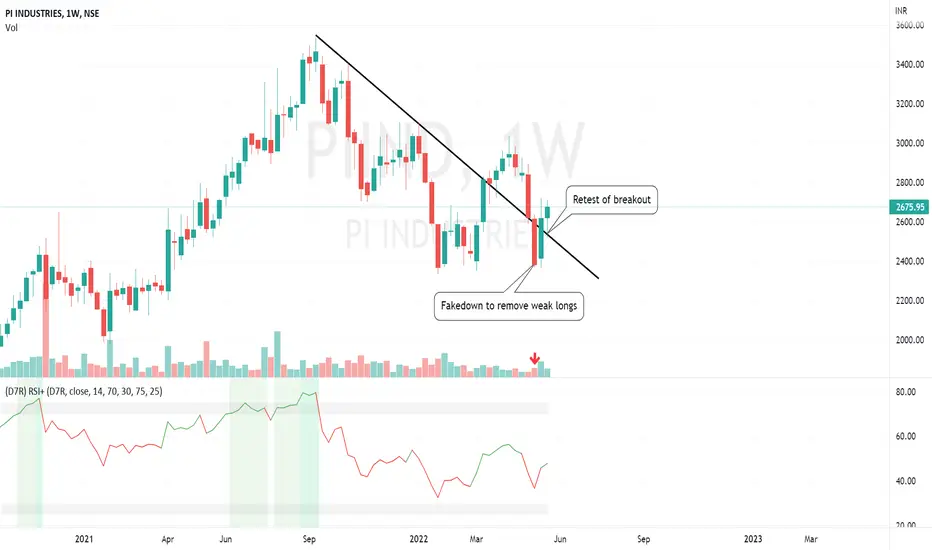
HNS fakedown
TRIANGLE breakout on weekly expected
3205 is .618 golden ratio level
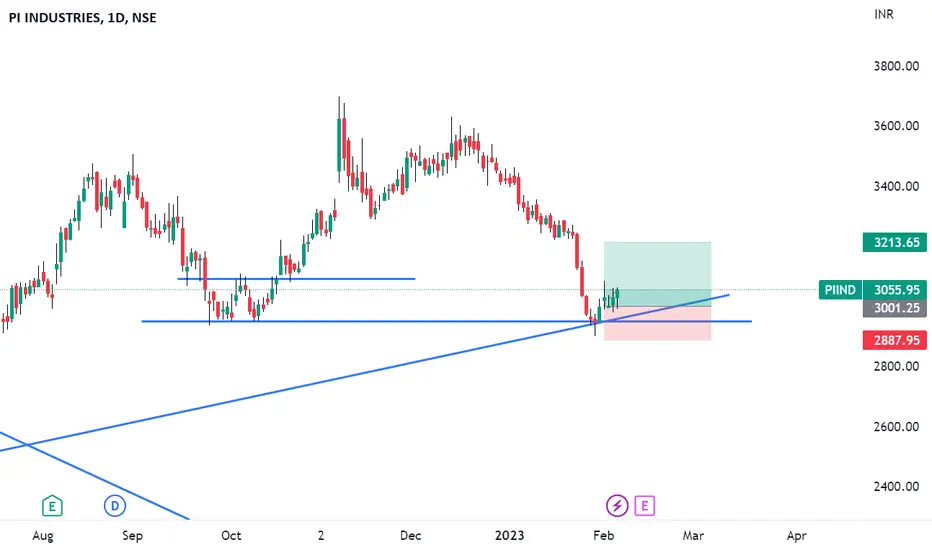
best buy at 2950 for invetment
for short term trading buy abv 3205 with 2% sl
PIIND trade ideas


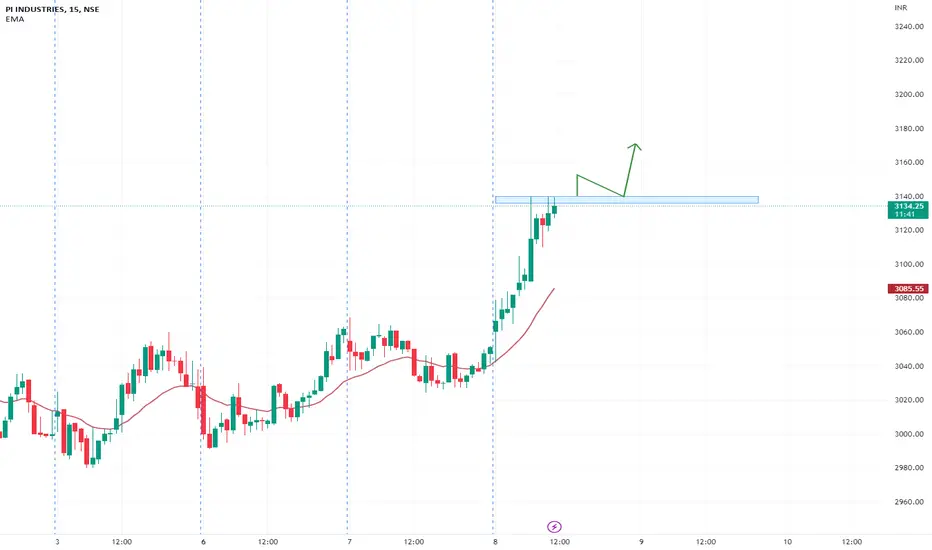
PIIND Buy for intraday tradingPIIND Buy for intraday trading if stock break the given resistence level...............
PIIND PIIND - A weekly close below point B will invite a downside target of 300 Points. Wait for affirmative closing because Point B is also a very strong reversal Point.

PIIND gonna pay for its sins!!!The sins that PIIND did are!
1. Breaking above its ATH with a big bullish candle!
2. Huge spike in volume!
3.Not sustaining above its ATH!
4. Forming a inverted hammer at resistance 2 days back!
These many sins are enough now!
Buyers are trapped!
Earlier when the similar stuff happened, the stock declined by almost 20%!
Too many negatives with only one positive!
If and only if it somehow breaks above its ATH, we may see more positive moves!
Otherwise, you know what's to be done!

PI INDUSTRY - Positional Trade + Keep an Eye📊 Script: PIIND ( PI INDUSTRIES LIMITED)
📊 Nifty50 Stock: NO
📊 Sectoral Index: NIFTY 500
📊 Sector: Chemicals ( Commodities )
📊 Industry: Pesticides & Agrochemicals
Key highlights: 💡⚡
On basis of Weekly Chart
📈 Script is trading at upper band of Bollinger Bands (BB).
📈 MACD is giving crossover.
📈 Double Moving Averages also giving crossover.
📈 Script is forming Cup & Handle pattern on weekly chart as shown into chart.
📈 Script is facing Hurdle at near 3534 level which is also Neckline of Cup & Handle Pattern.
📈 Volume is increasing along with price.
📈 Current RSI is around 64.
📈 One can go for Swing Trade above 3534.
BUY ONLY ABOVE 3534 LEVEL
⏱️ C.M.P 📑💰- 3485
🟢 Target 🎯🏆 - 4000
⚠️ Stoploss ☠️🚫 - 317
⚠️ Important: Always maintain your Risk & Reward Ratio.
⚠️ Purely technical based pick.
✅Like and follow to never miss a new idea!✅
Disclaimer: I am not SEBI Registered Advisor. My posts are purely for training and educational purposes.
Eat🍜 Sleep😴 TradingView📈 Repeat🔁
Happy learning with trading. Cheers!🥂

Long-PIInd CMO 3122PI industries consolidating above the demand zone, Probable W pattern formation. Buy CMP 3122, For a target of 3500 and stop Loss 2935

PI INDUSTRIES ANALYSIS!!RSI INDICATOR: is something which says the actually part of the price should be placed.
cups and handles is a very bullish price pattern formation.
and top of that, if rsi indicator is forming such pattern, then to speak on to it, the stock is a very great stock.
i have check the fundamentals. the rations, sales analysis are very greatly performing.
the two black line are the trend formation after the corona 2019 crash.
and blue line is the old trend.
the stock did gave its all time high recently. its possible to go more higher, since there is no drawback, or major risks associated to this stock.
recent quarters too outperformed from the analyst projected estimates.
great stock for swing trading and long term .


Cup and handle pattern formed.Cup and handle pattern formed. Accumulate on every dip for investment. Checkout my previous analysis below

#PIIND 3302.30 LONG#PI Industries, 3302.30
Stock is trying to make an A-B-C-D harmonics pattern!
Can it do 3800 ?


PI INDUSTRIES is a BUY ideaabove is 75 m chart....
stock completed the 4th corrective wave...just started the 5th wave...
buy to ride the 5th wave

Long Pi industriesWe are long Pi industries above 3108 stoploss maintain below 3035 Target 3535+
Short term Target
Risk - 73 point
Reward - 407 point
Always maintain risk to reward

PI INDUSTRY - TECHNICAL ANALYSIS 📊 Script: PIIND (PI INDUSTRIES LIMITED)
📊 Nifty50 Stock: NO
📊 Sectoral Index: NIFTY 500
📊 Sector: Chemicals (Commodities)
📊 Industry: Pesticides & Agrochemicals
📈 MACD is giving crossover.
📈Prices are increasing with volume.
📈 Already crossover at Double Moving Average.
📈 Stock is trading at upper band of BB.
📈 Right now RSI is around 74.
🟢 Target 🎯🏆 - 3450
⚠️ Stoploss ☠️🚫 - 3143
⚠️ Important: Always maintain your Risk & Reward Ratio.
✅Like and follow to never miss a new idea!✅
Disclaimer: I am not SEBI Registered Advisor. My posts are purely for training and educational purposes.

#PI IndustriesPI Industries.
Breaking out of huge 8 month base.
Very good volume last 2 days.
Break out happened on 4th August
Elliott oscillator and false bar .
Relative strength good.
Took 9 ema support nearly 30 days.
Buy above 3210 for 10% move possibly.
SL will be 3070 levels

#PIINDPI Industries need to cross the box height for a 300 Rs move probably.
Stock has very good support ar 2300 range
False bar on top.
Elliot oscillator green
There is also a cup in formation now.


PIIND PIIND - Accumulation by strong hands
PDF 1, Topic 2
Classic tactics of strong hands (Big players) who enter the stock every time it hits the above drawn demand zone.
Note how the stock has reversed and given a rally always from the mentioned zone.
Target - 2645 / 2680 / 2800
SL - 2440

PIIND PIIND - Breakout & retest set up
Look how price was taken below the trend line with low volumes to make the retailers exit.
Might come out strong now.
Maintain SL of 2620.
piind piind gives breakout and have done retest,
Entry: 2700 above
Target: 2850, 3000 and 3370 & 3500
SL: 2520
