PNB Housing... Is it worth to take risk? Fallen a lot in few days due to exit of good CEO. current level a big down from all time high. Business is intact and improving, reserves are good. Public holding reduced considerably. Key resistances are given. at current price, its a low risk bet!
Now its on a strong support.
PNBHOUSING trade ideas

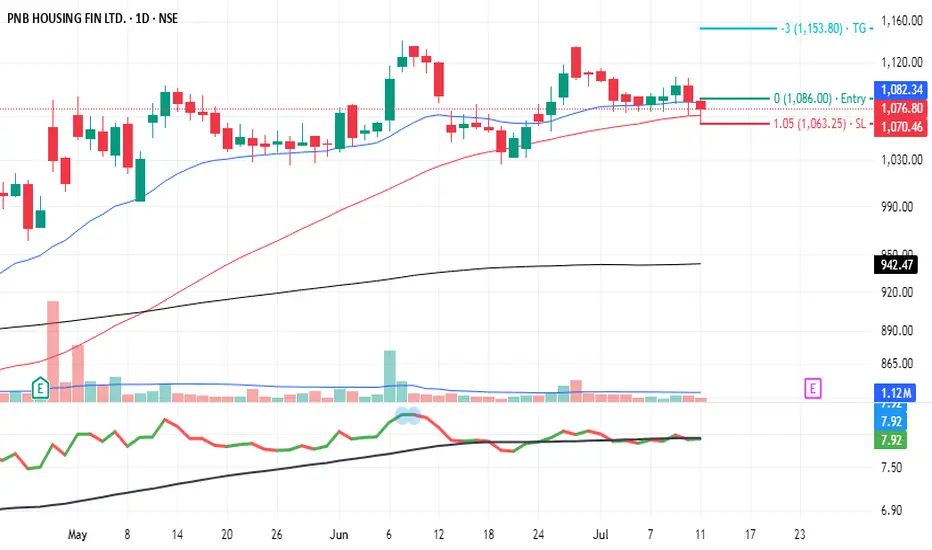
PNB Housing Finance - My Pick - No advice.Robust fundamentals indicate solid upside potential. If you believe in growth in the housing finance space, this could represent a strategic buy with a medium‑term horizon. Stock undercut 50 Day moving average and closed above it. it also undercut last several days low and close above it, showing lack of selling interest. A good close with good volume above PDH will tiggger my entry. These are my views and no advice to buy.
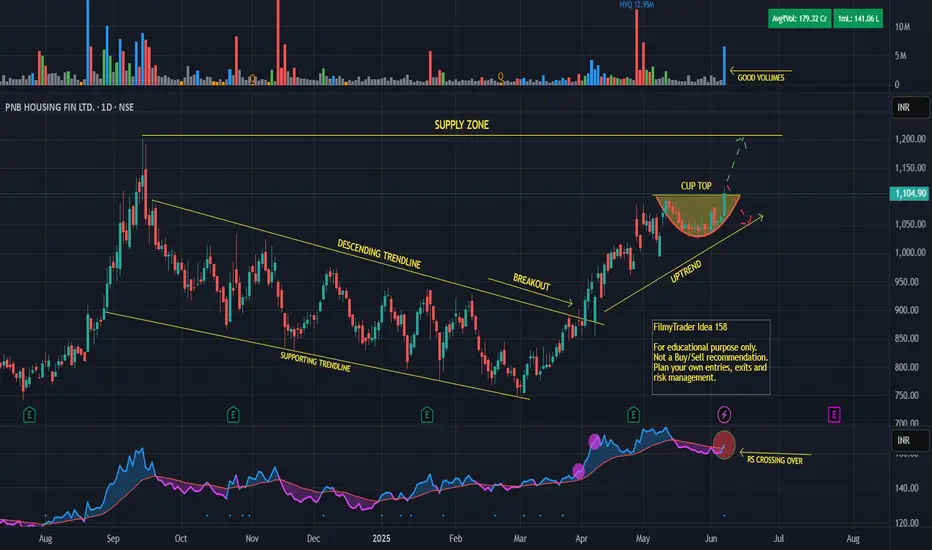
PNB housing - Cup pattern breakoutPNB Housing Finance Ltd
Breaking out of a CUP pattern in daily timeframe.
Stock in uptrend gaining momentum.
PSAR indicating bullish trend.
Close within 52 week zone.
Disclaimer:
For educational purpose only.
Please do your own research before taking any trades.
Happy Trading!
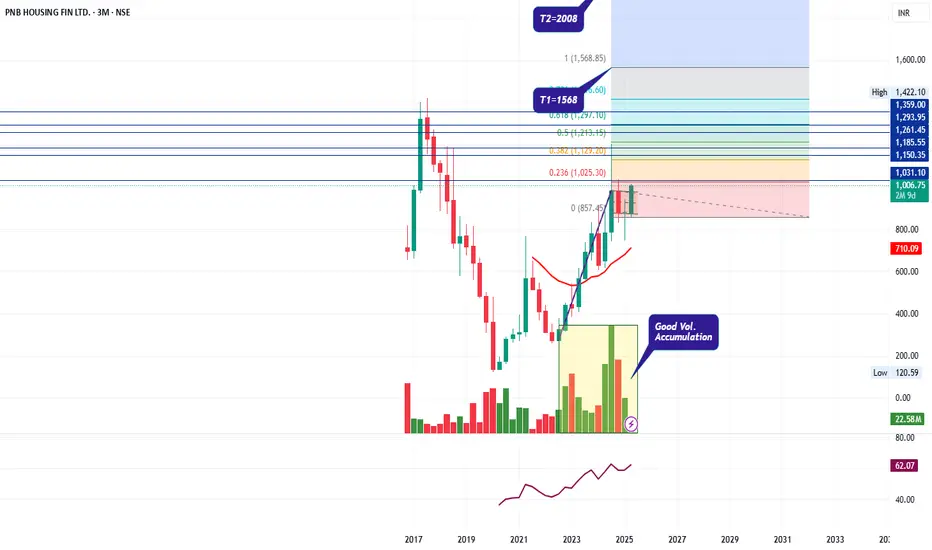
PNB Housing Fin Ltd.*PNB Housing Fin Ltd.*
P&F; Formation on Yearly Basis.
Morning Star on Monthly Basis.
Strong Retest & Upswing begins.
Good Vol. Accumulation done. Continued Traction to be watched
RSI: 1H W<M. All in Higher Bullish Zone.
EMAs: Widening Gaps amongst 20 50 100 200 levels at Weekly Basis.
_Respective Weekly Resistance levels as likely Targets. Move can be F&F; :)_
1031 / 1150 / 1185 / 1261 / 1294 / 1359
*Trail SL with Upside*
*Book Profit as per Risk Appetite*
Improving Financials. Rising Revenue on Qtrly / Yrly basis. Improving TNW & Balance Sheet.
PAN India Presence. Decline in FII Holding Absorbed by DIIs. Promotor / Retail at ~same levels.
Concerns: Any slowdown in Housing segment.
*This is an Opinion. Do your own research as well.*
*_Happy Investing_*🤓

Review and plan for 9th April 2025Nifty future and banknifty future analysis and intraday plan in kannada.
This video is for information/education purpose only. you are 100% responsible for any actions you take by reading/viewing this post.
please consult your financial advisor before taking any action.
----Vinaykumar hiremath, CMT

PNBHOUSING|Buy if close above 900 with SL below 835 |Target 1245Disclaimer:
This is not financial advice. Please do your own research or consult with a financial advisor before making any investment decisions. Investments in stocks can be risky and may result in loss of capital.

LONGReady for the trend change? chart is positive! Positive RSI divergence seen. Good Q3 numbers add fuel into it..levels of supports and resistance given. cheers!

SWING IDEA - PNB HOUSING FINANCEPNB Housing Finance , a prominent housing finance company in India, is exhibiting a promising swing trade setup supported by strong technical signals.
Reasons are listed below :
Breakout and Retest of 800 Zone : The stock previously broke a strong resistance at 800 and is now retesting it, showing potential for upward momentum.
Bullish Marubozu Candle : A strong bullish marubozu candle on the weekly timeframe indicates robust buying interest.
Golden Fibonacci Zone : The stock is bouncing back from a key Fibonacci retracement level, suggesting a continuation of the uptrend.
50 EMA Support : Price action is well-supported by the 50 EMA on the weekly timeframe, affirming bullish sentiment.
Volume Spike : A significant increase in trading volumes highlights growing investor confidence.
Target - 1190 // 1380
Stoploss - weekly close below 825
DISCLAIMER -
Decisions to buy, sell, hold or trade in securities, commodities and other investments involve risk and are best made based on the advice of qualified financial professionals. Any trading in securities or other investments involves a risk of substantial losses. The practice of "Day Trading" involves particularly high risks and can cause you to lose substantial sums of money. Before undertaking any trading program, you should consult a qualified financial professional. Please consider carefully whether such trading is suitable for you in light of your financial condition and ability to bear financial risks. Under no circumstances shall we be liable for any loss or damage you or anyone else incurs as a result of any trading or investment activity that you or anyone else engages in based on any information or material you receive through TradingView or our services.
@visionary.growth.insights

Ready for Breakout...NSE:PNBHOUSING trade @ 865. Resistence @ 950 Support @ 750.
After the Breakout you can watch it next resistence @ 1200 and 1400.

PNBHOUSINGDisclaimer:
This is not financial advice. Please do your own research or consult with a financial advisor before making any investment decisions. Investments in stocks can be risky and may result in loss of capital.

Cup and Handle pattern.Several fund houses have been making massive purchases around the ₹900 level, indicating strong interest. The stock appears poised to reach a new all-time high. It’s currently the most affordable housing finance stock in the Indian market. Best of luck!

Cup and handle patternMany institutions have acquired stakes in the company, which bodes well for the next five years. Best of luck!

Long PNB Housing. Chart patternDaily time frame
Symetrical Triangle brekout .
Volume seen growing.
20% down from previous high

PNB Housing Finance : HDFC Fin no more dominatingMerger of HDFC (Finance) with HDFC Bank paved the way for other Housing Finance Companies like LIC Housing Finance and PNB Housing Finance and other peer group companies.
Performance of these companies is a function of Interest Rates, Real Estate Inventory in Metros and B Grade Towns. That is why these are subject to volatility and unpredictable Price Swings.
From Price Action perspective, PNB Housing Finance can be a good Fractal Play.

PNB HOUSING FIN LTD S/R Support and Resistance Levels:
Support Levels: These are price points (green line/share) where a downward trend may be halted due to a concentration of buying interest. Imagine them as a safety net where buyers step in, preventing further decline.
Resistance Levels: Conversely, resistance levels (red line/shade) are where upward trends might stall due to increased selling interest. They act like a ceiling where sellers come in to push prices down.
Breakouts:
Bullish Breakout: When the price moves above resistance, it often indicates strong buying interest and the potential for a continued uptrend. Traders may view this as a signal to buy or hold.
Bearish Breakout: When the price falls below support, it can signal strong selling interest and the potential for a continued downtrend. Traders might see this as a cue to sell or avoid buying.
20 EMA (Exponential Moving Average):
Above 20 EMA: If the stock price is above the 20 EMA, it suggests a potential uptrend or bullish momentum.
Below 20 EMA: If the stock price is below the 20 EMA, it indicates a potential downtrend or bearish momentum.
Trendline: A trendline is a straight line drawn on a chart to represent the general direction of a data point set.
Uptrend Line: Drawn by connecting the lows in an upward trend. Indicates that the price is moving higher over time. Acts as a support level, where prices tend to bounce upward.
Downtrend Line: Drawn by connecting the highs in a downward trend. Indicates that the price is moving lower over time. It acts as a resistance level, where prices tend to drop.
RSI: RSI readings greater than the 70 level are overbought territory, and RSI readings lower than the 30 level are considered oversold territory.
Combining RSI with Support and Resistance:
Support Level: This is a price level where a stock tends to find buying interest, preventing it from falling further. If RSI is showing an oversold condition (below 30) and the price is near or at a strong support level, it could be a good buy signal.
Resistance Level: This is a price level where a stock tends to find selling interest, preventing it from rising further. If RSI is showing an overbought condition (above 70) and the price is near or at a strong resistance level, it could be a signal to sell or short the asset.
Disclaimer:
I am not a SEBI registered. The information provided here is for learning purposes only and should not be interpreted as financial advice. Consider the broader market context and consult with a qualified financial advisor before making investment decisions.

PNB HOUSING S/R for 15/7/24Support and Resistance Levels: In technical analysis, support and resistance levels are significant price levels where buying or selling interest tends to be strong. They are identified based on previous price levels where the price has shown a tendency to reverse or find support.
Support levels are represented by the green line and green shade, indicating areas where buying interest may emerge to prevent further price decline.
Resistance levels are represented by the red line and red shade, indicating areas where selling pressure may arise to prevent further price increases. Traders often consider these levels as potential buying or selling opportunities.
Breakouts: Breakouts occur when the price convincingly moves above a resistance level (red shade) or below a support level (green shade). A bullish breakout above resistance suggests the potential for further price increases, while a bearish breakout below support suggests the potential for further price declines. Traders pay attention to these breakout signals as they may indicate the start of a new trend or significant price movement.
20 EMA: The yellow line denotes 20 EMA, to interpret the 20 EMA, you need to compare it with the prevailing stock price. If the stock price is below the 20 EMA, it signals a possible downtrend. But if the stock price is above the 20 EMA, it signals a possible uptrend.
Disclosure: I am not SEBI registered. The information provided here is for learning purposes only and should not be interpreted as financial advice. It is important to consult with a qualified financial advisor before making any investment decisions. Tweets neither advice nor endorsement.

8 months breakout?This monthly chart shows that the stock is under consolidation since last 8 months. Extremely good volume seen this month with big FIIs checking in at 785 so close to the resistance zone. This could be a very very special breakout. We might see new all time high in next 6 months.

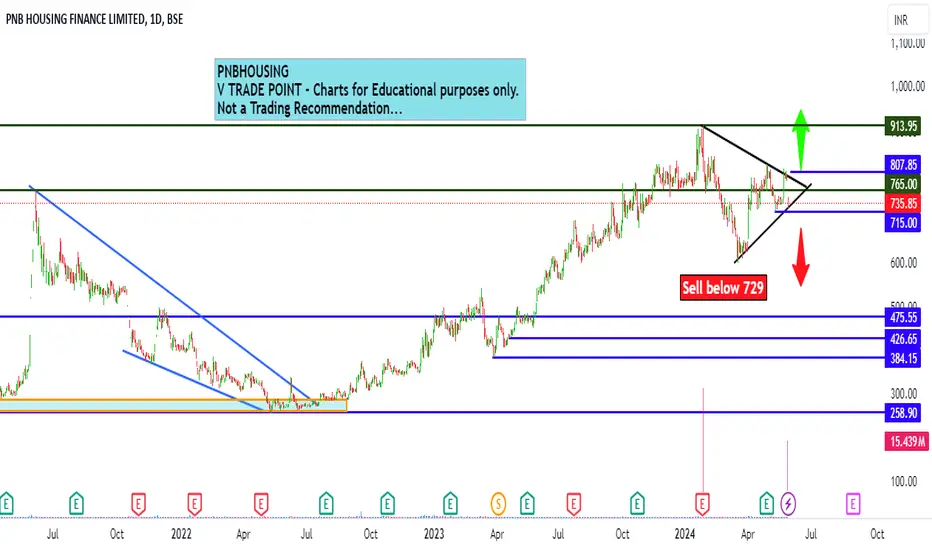
Intraday level for PNB Housing Finance for 30th MayIntraday level for PNB Housing Finance for 30th May
#PNBHOUSING
Selling opportunity for intraday below 729
Resistance and Stop Loss area around 740
Charts for Educational purposes only.
Please follow strict Risk Reward and Stop Loss if you follow the levels.
Thanks,
V Trade Point.
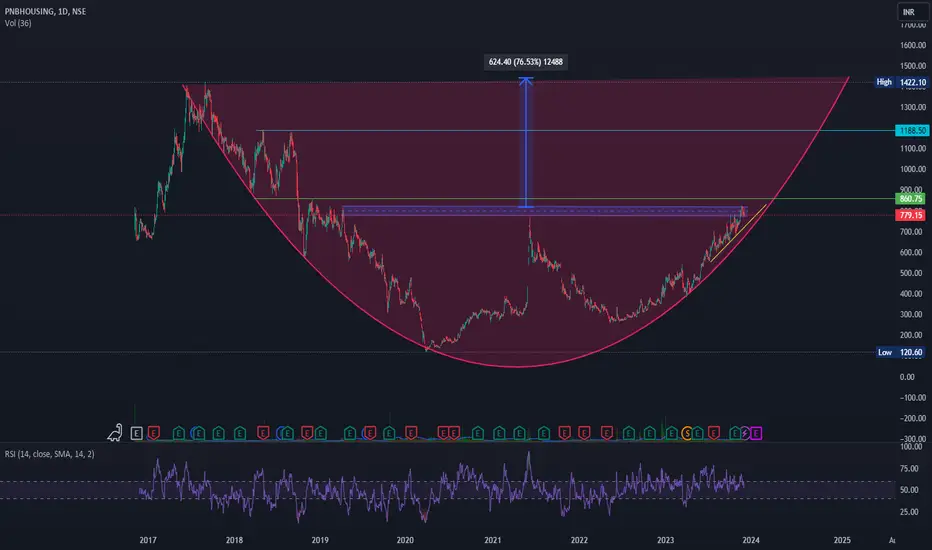
PNB Housing financePNB housing is trading around 779. on the chart it look like it will complete a cup pattern.
It is a good risk and reward ratio. one can invest for at least 2 quarter. If you are a trader then put stop loss (closing basis) below the trend line as shown in chart.
First target 863 after that it can achieve 1087 /1188/1422.
This is not a stock recommendation.
VCP & bullish pattern in PNB housingThis script is showing VCP pattern which is discussed by Mark Minervini . This is also forming inverse head and shoulders bullish pattern. The volumes in up moves are high showing script is going in strong hands. I have marked the targets in the chart. Risk reward is favourable to enter near 480 levels.

PNBHOUSING Box Breakout with Good VolumesNSE:PNBHOUSING is breaking out from the congestion with good volumes. It's a daily chart hence we need to wit till end of day to see if this breakout sustains. If it does and more volume is seen contributing to upside then it could be a good trading opportunity.
Based on the box height, target would be around 870.

PNB HF multi year breakoutPNB HF is showing strength in current market. Showing multi year breakout. Keeping an eye on it myself.
