POLYCAB INDIA SHORT SELLTrade Idea : Polycab India Ltd (NSE: POLYCAB) SHORT SIDE
Current Price : ₹6,740
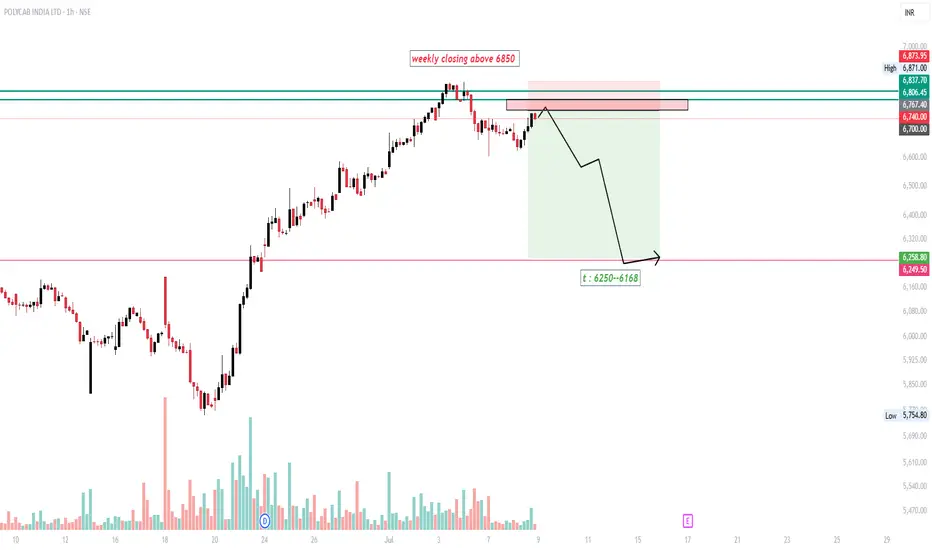
Resistance Zone: ₹6,800 – ₹6,875
Bias : Short (Sell) below resistance
Rationale
Polycab India Ltd is currently facing strong resistance in the ₹6,800–₹6,875 zone. The price has attempted to break above this area but failed to sustain, indicating potential exhaustion of bullish momentum. Unless there is a weekly closing above ₹6,850, the setup favors a short position targeting a pullback.
Trade Plan
Entry: Near ₹6,800–₹6,875 resistance zone or red zone
Stop Loss: Above ₹6,875 (weekly close above ₹6,850 invalidates the setup)
Target: ₹6,250–₹6,260 zone
Risk-Reward: Favorable, with a clear invalidation point and defined downside target
Chart Observations
Price action shows repeated rejection in the marked supply zone.
Volume analysis supports the likelihood of a reversal.
The projected path anticipates a move down to the ₹6,250 area, as highlighted on the chart.
Disclaimer
This analysis is for educational purposes only and does not constitute financial advice or a recommendation to buy or sell any securities. Trading and investing in the stock market involves risk. Please do your own research or consult a qualified financial advisor before making any trading decisions. The author is not responsible for any losses incurred as a result of following this analysis.
POLYCAB trade ideas
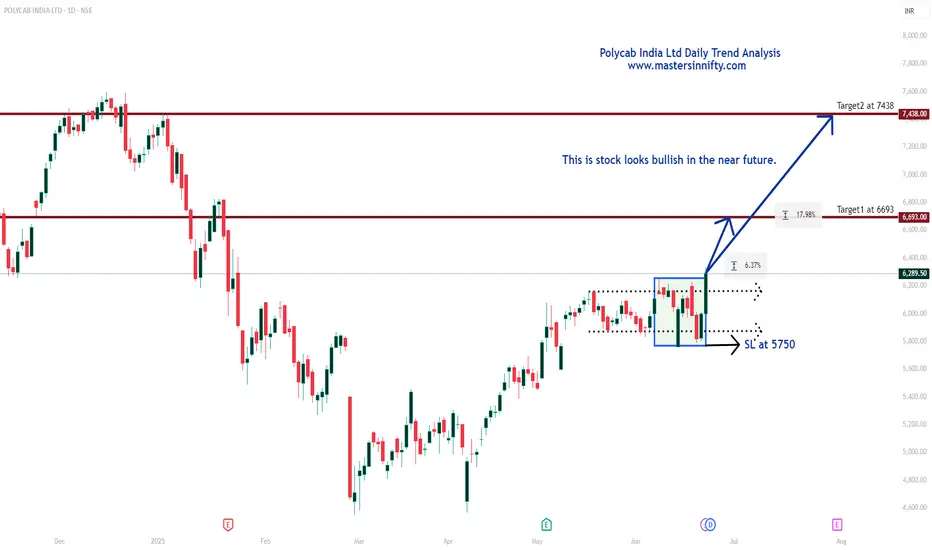
Polycab India Ltd Daily Trend AnalysisBased on my analysis, the stock has a potential target of 6693. If it manages to sustain above this level, it could further advance toward 7438. A stop loss can be considered at 5750 for risk management.
Please note, this is my personal view. Traders are advised to conduct their own analysis before making any entry or exit decisions.
Review and plan for 20th June 2025Nifty future and banknifty future analysis and intraday plan.
This video is for information/education purpose only. you are 100% responsible for any actions you take by reading/viewing this post.
please consult your financial advisor before taking any action.
----Vinaykumar hiremath, CMT

Review and plan for 19th June 2025Nifty future and banknifty future analysis and intraday plan.
This video is for information/education purpose only. you are 100% responsible for any actions you take by reading/viewing this post.
please consult your financial advisor before taking any action.
----Vinaykumar hiremath, CMT


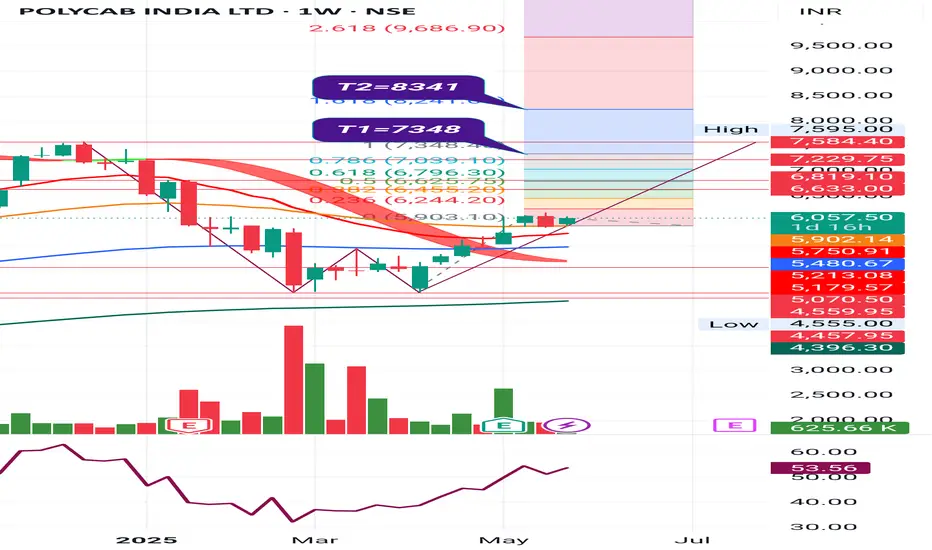
Polycab India Ltd*_Polycab India_* :
P&F / *W* on Weekly Basis
1st Target almost 10% Up from current levels.
Do Your Own Research as well.
Happy Investing 🤓
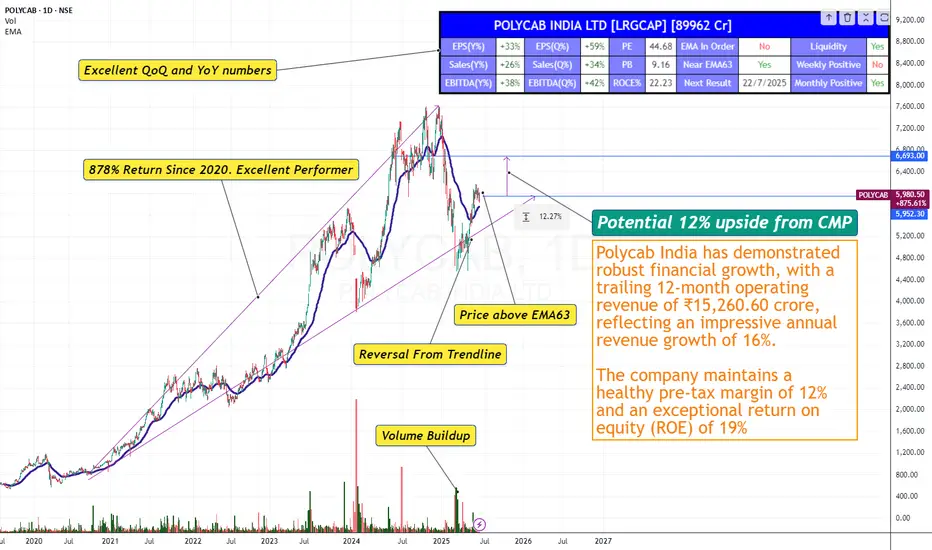
Equity Research Report – Polycab India Ltd.✅ Buy Levels
Buy Above: ₹5,800 (post breakout confirmation)
Ideal Entry on Dip: ₹5,765–₹5,785
🎯 Targets
Timeframe Target 1 Target 2 Target 3
15-min ₹5,870 ₹5,950 ₹6,070
1-hour ₹6,070 ₹6,220 ₹6,427 (Fib 61.8%)
🔻 Stop Loss
Intraday SL: ₹5,720
Positional SL: ₹5,650 (below trendline support and 20 EMA)
For Education purposes only

Polycab India Ltd- Potential TargetsNSE:POLYCAB
Polycab India Ltd.,is retraced to 41% from its recent higher highs of 7794.95 and innear its buy zone. Script is below its all moving averages 10...200 days EMA.
Elliot wave analysis also supports to the idea of potentail buying interest as 8 wave cycle is completed at 4636.45
On daily chart Bullish Shark pattern is visible . Current market price is, at its Potential Price Reversal Zone (PRZ), and price trend reversal can unfold in coming days. It can be rewarding bet for aggressive traders with risk to profit of 1:3.
Entry at: 4918
Stoploss: 4236
Target-1: 5827
Target-2: 7605
✅ For More Such Trading Idea stream Like this, Share and Follow, MY IDEA STREAM ✅

POLYCABPOLYCAB,
watch above levels. redline is our SL.
DISCLAIMER : I am NOT a SEBI registered advisor or a financial adviser. All the views are for educational purpose only.

Review and plan for 28th February 2025 Nifty future and banknifty future analysis and intraday plan.
This video is for information/education purpose only. you are 100% responsible for any actions you take by reading/viewing this post.
please consult your financial advisor before taking any action.
----Vinaykumar hiremath, CMT

POLYCAB (The Multi Bagger)Stock Is falling Just because ULTRATECH announced its entry in Cables but Entering its just an Investment Opportunity for you guys
As Cable is Complied by long term Growth in Infrastructure of the country and Management is Very Bullish on FUTURE so don't sell the stock. Rather Average on levels

Polycab Trend Reversal Pattern
Taken Support 5384
Bullish Engulfing
RSI Reversal 40
Expected level 6278

POLYCAB - SHORTNSE:POLYCAB Weekly extremely bearish chart setup may continue to fall stock upto 4000 in short to medium term.

PolycabThe stock has almost broke the crucial support level
and now a good green body retest followed by the red body then can lead to a good breakdown.

POLYCABpolycab broke the channel and going up looks strong closing above 7600.
keep your eye on it.
education purpose only.

Polycab - BulllishPolycab is going to touch all time high.. Although the stock is bullish.. we need to wait for a retracement up to 7100-7050 levels to enter.
Short term traders can wait for a target of 8245, 8425 levels
Strict stop loss near 6920
Long term investors can accumulate in every dip and wait for the targets of 9,473 and 9,735 levels
5927 level is the best lower support for this stock. if this price comes anytime in future due to market fall.. we can go all IN to make huge profits
This idea is only education purpose and not for serious investing or trading. kindly consult your financial advisor before taking any financial decision

Polycab India Ltd. - Short Position SetupAnalysis for Short Position Condition:
1.Key Breakdown Level:
₹7,282 is a critical horizontal support level. A decisive breakdown below this level could trigger a bearish move.
2.Volume Profile Analysis:
Below ₹7,282, the volume profile shows limited buying interest until ₹6,997, suggesting a potential drop to this level.
Further weakness could see the stock test ₹6,746, where significant buying activity has previously occurred.
3.Trendline Breakdown:
The stock is trading within an ascending channel. A breakdown below ₹7,282 will confirm the failure of this channel, indicating a trend reversal.
4.Moving Averages:
The 20-day EMA is currently acting as dynamic support near ₹7,282. A breakdown will likely push the stock toward the 50-day EMA around ₹6,997.
The 200-day EMA near ₹6,746 is a long-term support level to monitor.
5.RSI (Relative Strength Index):
RSI is neutral but could head toward oversold levels if the breakdown occurs, strengthening the bearish view.
6.Volume Confirmation:
Watch for an increase in sell-side volume during the breakdown for confirmation.
Trade Plan for Short Positions:
Entry Trigger: Below ₹7,282.
Targets:
Target 1: ₹6,997
Target 2: ₹6,746
Stop Loss: Above ₹7,438 (previous high near resistance).
Risk-Reward Ratio: Ensure an ideal ratio of at least 1:2 for the trade.
Alternate Scenario:
If ₹7,282 holds and the stock bounces, the immediate upside resistance is ₹7,654, above which the stock may resume its bullish trend.

Polycab chart analysisPolycab chart analysis on daily time frame. This stock is at resistance level and can give breakout.

Review and plan for 9th October 2024Nifty future and banknifty future analysis and intraday plan in kannada.
Positional trading ideas included.
This video is for information/education purpose only. you are 100% responsible for any actions you take by reading/viewing this post.
please consult your financial advisor before taking any action.
----Vinaykumar hiremath, CMT

POLYCAB S/R Support and Resistance Levels:
Support Levels: These are price points (green line/shade) where a downward trend may be halted due to a concentration of buying interest. Imagine them as a safety net where buyers step in, preventing further decline.
Resistance Levels: Conversely, resistance levels (red line/shade) are where upward trends might stall due to increased selling interest. They act like a ceiling where sellers come in to push prices down.
Breakouts:
Bullish Breakout: When the price moves above resistance, it often indicates strong buying interest and the potential for a continued uptrend. Traders may view this as a signal to buy or hold.
Bearish Breakout: When the price falls below support, it can signal strong selling interest and the potential for a continued downtrend. Traders might see this as a cue to sell or avoid buying.
20 EMA (Exponential Moving Average):
Above 20 EMA(50 EMA): If the stock price is above the 20 EMA, it suggests a potential uptrend or bullish momentum.
Below 20 EMA: If the stock price is below the 20 EMA, it indicates a potential downtrend or bearish momentum.
Trendline: A trendline is a straight line drawn on a chart to represent the general direction of a data point set.
Uptrend Line: Drawn by connecting the lows in an upward trend. Indicates that the price is moving higher over time. Acts as a support level, where prices tend to bounce upward.
Downtrend Line: Drawn by connecting the highs in a downward trend. Indicates that the price is moving lower over time. It acts as a resistance level, where prices tend to drop.
RSI: RSI readings greater than the 70 level are overbought territory, and RSI readings lower than the 30 level are considered oversold territory.
Combining RSI with Support and Resistance:
Support Level: This is a price level where a stock tends to find buying interest, preventing it from falling further. If RSI is showing an oversold condition (below 30) and the price is near or at a strong support level, it could be a good buy signal.
Resistance Level: This is a price level where a stock tends to find selling interest, preventing it from rising further. If RSI is showing an overbought condition (above 70) and the price is near or at a strong resistance level, it could be a signal to sell or short the asset.
Disclaimer:
I am not a SEBI registered. The information provided here is for learning purposes only and should not be interpreted as financial advice. Consider the broader market context and consult with a qualified financial advisor before making investment decisions.

Review and plan for 3rd October 2024Nifty future and banknifty future analysis and intraday.
This video is for information/education purpose only. you are 100% responsible for any actions you take by reading/viewing this post.
please consult your financial advisor before taking any action.
----Vinaykumar hiremath, CMT

Supply zone breakoutGood volume buildup in daily timeframe.
ATH breakout with good volume.
Fundamentals are good.
FII stakes are up.
NOTE: I do my analysis, do yours before trade.
Eat🍜 Sleep😴 TradingView📈 Repeat 🔁
