POWER GRID🔹 Trade Setup Summary
Trade Type: Buy (Long)
Entry: ₹278
Stop Loss (SL): ₹258
Target: ₹485
Risk: ₹20
Reward: ₹207
Risk-Reward Ratio (RR): 10.4:1
Last High: ₹366
Last Low: ₹247
✅ All timeframes are UPTREND
✅ Entry at ₹278 is inside strong demand zones
✅ SL ₹258 is well protected by zone boundaries
✅ Target ₹485 is ambitious but realistic in trend continuation
🔹 Why This Trade Works
📊 All trends are UP – from yearly to 60-min.
💪 Strong support between ₹277–278, where price is likely to bounce.
🎯 Target is above previous high (₹366) – next leg of uptrend.
🛡️ Risk is limited (₹20) with a very high reward potential (₹207).
🔹 Clear Strategy
Action Price Reason
Buy ₹278 Inside monthly/weekly/daily demand zone
Stop Loss ₹258 Below all key demand zones
Target ₹485 Swing target based on trend & breakout
🔹 Zone Analysis (Multi-Timeframe Demand Zones)
Timeframe Zone (Proximal – Distal) Zone Avg Remarks
Yearly 240 – 153 197 Strong long-term base
Half-Yearly 240 – 226 233 Long-term support
Quarterly 298 – 226 262 Deep demand, includes entry
Monthly 299 – 257 278 Entry matches exact average
Weekly 278 – 258 268 Entry + SL inside this zone
Daily 285 – 277 281 Strong recent demand
Intraday 285 – 277 281 Multiple overlaps here
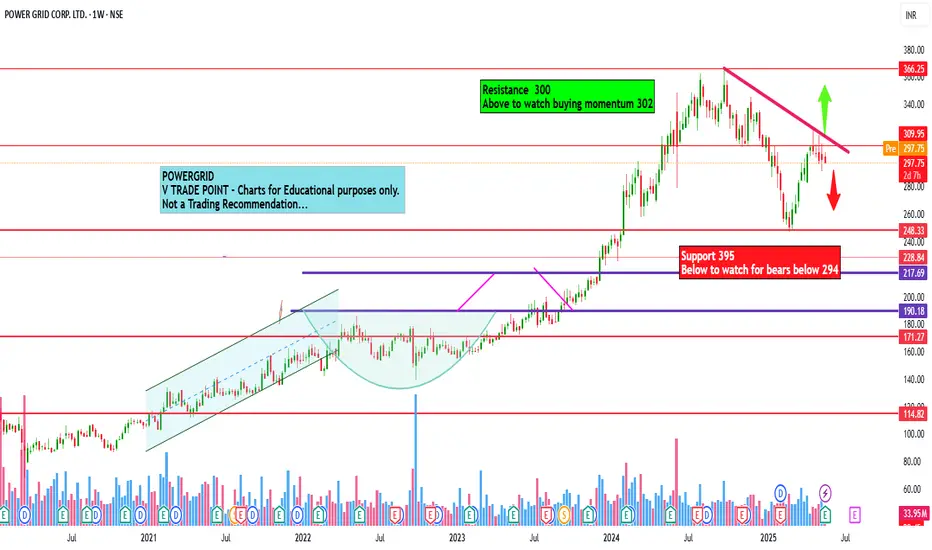
POWERGRID trade ideas

Powergrid Corporation of INdia view for Intraday 21st May #POWERPowergrid Corporation of INdia view for Intraday 21st May #POWERGRID
Resistance 300 Watching above 302 for upside momentum.
Support area 295 Below 300 ignoring upside momentum for intraday
Watching below 294 for downside movement...
Above 300 ignoring downside move for intraday
Charts for Educational purposes only.
Please follow strict stop loss and risk reward if you follow the level.
Thanks,
V Trade Point
PowergridOne holding company that works in the power transmission industry is Power Grid Corp. of India Ltd. Transmission Services, Consultancy Services, and Telecom Services are its three business divisions. Bulk electricity transmission between India's states is referred to as the Transmission Services segment.
I've seen that it's attempting to surpass the high from the prior day. It might attempt to ramp up to the 335–340 level, in my opinion. After it crosses the 302 level with small SL 280, I anticipate an increase of 10–15%.
This is merely my view and is meant to be educational.
Disclaimer: We are not SEBI registered, and all of the information on this page is only meant for educational purposes. Please consult a SEBI-registered financial counsellor before to investing or making any financial decisions. We are not liable for any profit or loss you may have made.
I would welcome your participation and support by liking, commenting, and following in order to express encouragement.
GLORIOUS TRADING 👍

Power grid corporation This depicts a technical pattern known as the "Cup and Handle" pattern.
If the breakout is successful, an upward bullish trend can be expected
If you find this helpful and want more FREE forecasts in TradingView, Hit the 'BOOST' button
Drop some feedback in the comments below! (e.g., What did you find most useful?
How can we improve?)
Your support is appreciated!
Now, it's your turn!
Be sure to leave a comment; let us know how you see this opportunity and forecast.
Have a successful week
DISCLAIMER: I am NOT a SEBI registered advisor or a financial adviser. All the views are for educational purpose only

POWERGRID – Breakout Setup with Volume Spike📍 Entry Zone: ₹310.10 – ₹311.10
🎯 Target: ₹330.00
🛑 Stoploss: ₹302.00
📈 RSI has crossed above 60, volume confirms breakout momentum (🔵 arrow), and price is supported above key EMAs.
🔍 Strong bullish structure with clear higher lows and a clean breakout candle. Momentum shift confirmed with increasing volume.
For Education Purposes Only

Powergrid Corporation Ltd view for Intraday 21st April #POWERGRIPowergrid Corporation Ltd view for Intraday 21st April #POWERGRID
Resistance 310 Watching above 311 for upside movement...
Support area 300 Below 305 ignoring upside momentum for intraday
Watching below 299 for downside movement...
Above 305 ignoring downside move for intraday
Charts for Educational purposes only.
Please follow strict stop loss and risk reward if you follow the level.
Thanks,
V Trade Point

powergirdpowergird
Power grid analysis is a crucial process in electrical engineering and semiconductor design. It involves evaluating the performance and reliability of power distribution networks to ensure stable voltage delivery and prevent issues like excessive voltage drops or power dissipation.

Power grid bulish bat patternPower grid bulish bat pattern cmp 278 on 09.02.25 trading in demand zone now it can move to upside .. will see the bulish candle in this zone ..

power gridthe support level for Power Grid Corporation of India Ltd. (POWERGRID) is around ₹295, and the resistance level is around ₹300.

Powergrid - sell on riseNSE:POWERGRID Sell on rise set up on weekly chart , distribution using double top with lower low tops.

POWERGRID : Disconnected ?
🚀 Power Grid Corp poised for a breakout? 📈
### Chart Analysis
Swing Target Zone : 349-359 INR
Deep Retracement Zone : 309-315 INR
Wave C Completion Zone : 308-311 INR
Stop Loss : 305 INR
### Trade Plan
Entry : Consider entering around the Wave C completion zone (308-311 INR) .
Target : Aim for the swing target zone between 349-359 INR .
Stop Loss : Place a stop loss at 305 INR to manage risk.
### Conclusion
The chart suggests a potential move towards the target zone .
Monitor closely and adjust the plan as needed.
The setup offers a favorable risk-reward ratio .
📢 Disclaimer : This trade plan is for informational purposes only and does not constitute financial advice. Always conduct your own research and consult with a qualified financial advisor before making any investment decisions.
#PowerGrid #TechnicalAnalysis #TradingPlan #StockMarket #Investment

POWERGRID MAY FALL DUE TO DOUBLE TOP FORMATION
DOUBLE TOP FORMATION :
powergrid has formed a perfect double top pattern on weekly timeframe and seemed to be positioned for further fall.
Although it had shooted up suddenly 2 weeks back due to the uncertainty which bubbled up surrounding maharashtra election which affected whole whole stock market. But after the release of the election results it has started going down again
BEARISH DIVERGENCE :
Apartfrom double top it has also formed strong bearish divergence pattern on the chart with 2 divergent peaks having formed on chart & rsi 4th mar & 29th july respectively indicating strong bearish momentum for powergrid
BEARISH MACD :
macd indicator has also become extremely bearish with macd line hovering below signal line by large margin
PROFIT TARGET :
The stock will fall till 299 level which is 22 points away from current level

Power Grid Corporation i*Power Grid Corporation*
P&F Formation on Monthly Basis
Price BreakOut >357 Needed & to be Sustained.
RSI: 1H (Super Bullish) > D >W <M (Getting into Bullish)
EMAs: Widening Gaps amongst 20/ 50/ 100/ 200 levels on Weekly/Monthly Basis.
Vol. BuiltUp need to be watched.
*Trail SL with Upside*
*Book Profit as per Risk Appetite*
Financially stable.
*This is an Opinion. Do your own research as well*
*_Happy Investing_*

POWER GRID CORP. LTD S/R Support and Resistance Levels:
Support Levels: These are price points (green line/shade) where a downward trend may be halted due to a concentration of buying interest. Imagine them as a safety net where buyers step in, preventing further decline.
Resistance Levels: Conversely, resistance levels (red line/shade) are where upward trends might stall due to increased selling interest. They act like a ceiling where sellers come in to push prices down.
Breakouts:
Bullish Breakout: When the price moves above resistance, it often indicates strong buying interest and the potential for a continued uptrend. Traders may view this as a signal to buy or hold.
Bearish Breakout: When the price falls below support, it can signal strong selling interest and the potential for a continued downtrend. Traders might see this as a cue to sell or avoid buying.
20 EMA (Exponential Moving Average):
Above 20 EMA(50 EMA): If the stock price is above the 20 EMA, it suggests a potential uptrend or bullish momentum.
Below 20 EMA: If the stock price is below the 20 EMA, it indicates a potential downtrend or bearish momentum.
Trendline: A trendline is a straight line drawn on a chart to represent the general direction of a data point set.
Uptrend Line: Drawn by connecting the lows in an upward trend. Indicates that the price is moving higher over time. Acts as a support level, where prices tend to bounce upward.
Downtrend Line: Drawn by connecting the highs in a downward trend. Indicates that the price is moving lower over time. It acts as a resistance level, where prices tend to drop.
RSI: RSI readings greater than the 70 level are overbought territory, and RSI readings lower than the 30 level are considered oversold territory.
Combining RSI with Support and Resistance:
Support Level: This is a price level where a stock tends to find buying interest, preventing it from falling further. If RSI is showing an oversold condition (below 30) and the price is near or at a strong support level, it could be a good buy signal.
Resistance Level: This is a price level where a stock tends to find selling interest, preventing it from rising further. If RSI is showing an overbought condition (above 70) and the price is near or at a strong resistance level, it could be a signal to sell or short the asset.
Disclaimer:
I am not a SEBI registered. The information provided here is for learning purposes only and should not be interpreted as financial advice. Consider the broader market context and consult with a qualified financial advisor before making investment decisions.

52 Week High Breakout - Positional Trade - Long TermDisclaimer: I am not a Sebi registered adviser.
This Idea is publish purely for educational purpose only before investing in any stocks please take advise from your financial adviser.
52 Week Breakout. Stock has Crossed 52 week High. Keep in watch list. Buy above the high. Suitable for Positional Trade. Stop loss & Target Shown on Chart. Stop loss Trail by 30 SMA. Exit if Price Close below 30 SMA on Weekly Chart.
Be Discipline because discipline is the Key to Success in the STOCK Market.
Trade What you see not what you Think
Its also dividend paying stock
Buy above the High important as it is a Confirmation that Stock will continue in uptrend.

POWERGRID 1D TFPowergrid breaking current high and moving towards new highs.
Good to go long in this stock at the current level or we can wait for retesting of 360 levels.
The first target can be 382 and 2nd target will be 418.
If it breaks down we can expect till recent support zone of 325 levels.
Trade safe. Manage risk. Be profitable.
Please follow us for more simple trading analysis and setups. Also, let me know in the comment if you have any queries.
Disclaimer:- This is my view. Please analyze the charts yourself and then decide to take any trades.

Power Grid Corporation Ltd Observations:
Cup and Handle Formation: A bullish continuation pattern, suggesting that the price may break out upward after the handle formation completes.
Breakout Level: The resistance around the ₹364-366 zone, marked by the top of the "cup."
Strong Volume: There seems to be a spike in buying volume near the breakout, which is a positive signal for the trade.
Trade Setup:
Entry:
Buy Power Grid if it sustains above the ₹366 level with good volume confirmation.
Alternatively, enter on a pullback to the ₹360-364 region after the breakout, if the price retests the breakout zone.
Target:
First Target (T1): ₹380-385, based on the height of the cup pattern.
Second Target (T2): ₹400-410, assuming the broader trend remains bullish and market conditions are favorable.
Stop Loss:
Place a stop loss below ₹350, just below the recent low in the handle or a strong support level.
For a more conservative approach, use a stop loss below ₹340.
Timeframe:
This is a positional trade; it may take a few weeks to play out. Keep an eye on the price action and volume for further cues.
Risk Management:
Position Size: Limit the position size to avoid large losses, as the overall market conditions could still influence the trade. Allocate only a portion of the capital.
Trailing Stop Loss: Once the stock reaches the first target, trail your stop loss to protect profits.
In summary, Power Grid is showing a potentially bullish continuation pattern, and a breakout above ₹366 could lead to significant upside, provided the broader market remains supportive.

POWERGRID Swing Long SetupEntry Zone - 335.30 - 336.82
Target - 358.80
Stoploss - 323.55
Stoploss only when 1 day candle closes below the price - 323.55
Note: This is not any financial advice, this is for education purpose only

Powergrid Buy. Demand zone in confluence with 50 FibboDemand zone in confluence with 50 Fibbo.
Target can be all time high.
Entry around 340 mark. SL below 335. Fantastic Risk reward ratio

POWERGRID Bearish Flag sell side A sell-side scenario for Powergrid could be triggered by a breakdown below a key support level, indicating a potential reversal of the uptrend. This could be fueled by a decline in buying interest, profit-booking, or a negative news event impacting the stock.

Powergrid can become PowerfulPower Grid Corp. of India Ltd. is a holding company, which engages in the power transmission business. It operates through the following segments: Transmission Services, Consultancy Services, and Telecom Services. It is a PSU company with high dividend yield of 3.3% at current market price.
Power Grid Corp. of India Ltd. CMP is 337.40 The positive aspects of the company are moderate Valuation (P.E. =20), Company with Zero Promoter Pledge, MFs increased their shareholding last quarter, Growth in Quarterly Net Profit with increasing Profit Margin and The Negative aspects of the company are Inefficient use of shareholder funds - ROE declining in the last 2 years and Declining Net Cash Flow : Companies not able to generate net cash.
Entry can be taken after closing above 343. Targets in the stock will be 348 and 356. The long-term target in the stock will be 364. Stop loss in the stock should be maintained at Closing below 328 or 291 depending on your risk taking ability.
The above information is provided for educational purpose, analysis and paper trading only. Please don't treat this as a buy or sell recommendation for the stock. We do not guarantee any success in highly volatile market or otherwise. Stock market investment is subject to market risks which include global and regional risks. We will not be responsible for any Profit or loss that may occur due to any financial decision taken based on any data provided in this message.

Dividend Paying Stock - Long TermI am not a Sebi registered adviser.
This Idea is publish purely for educational purpose only before investing in any stocks please take advise from your financial adviser.
It One of the Dividend Paying Stock for Long Term Investors and Right Now in Good Position to take Entry.
Always take entry near the Support to Moving average.
Be Discipline because discipline is the Key to Success in the STOCK Market.

Power Grid-Bullish Swing-More power expected!! NSE:POWERGRID
01.08.2024
Buy 359.7
Target 386
Stop Loss 342
Risk: Reward: 01:1.5
1. Inside bar breakout in day TF and Weekly TF
2. Good Uptrend
3. Price has broke strong resistance level
4. Good Volumes from past few days
5. Energy sector and public sector is in good mood
