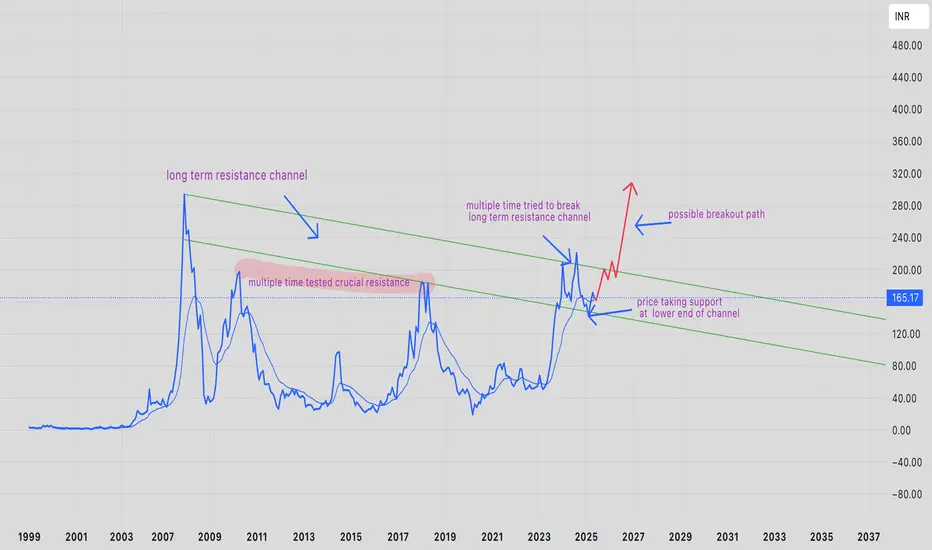
High chance of PRAKASH-EQ to break ATH and make new highPRAKASH-EQ has traded in range for about 14 years ( from 2010 high to recent 2024 high ). This time the breakout is different because price has managed to break and trade above its crucial resistance zone.
currently price of PRAKASH-EQ has taken support at the lower end of its long term resistance channel and there is high chance of price breaking its all time high.
as and when price reaches near the upper band of its long term resistance band, it is expected to have a sudden and fast momemtum which will be volume supported.
right now price is in value zone (for people planning for momentum breakout) but it is advised to carry this for the next 1-3 years to reap the benefits of compounding
as always people are advised to trade as per their risk capacity.
PRAKASH trade ideas
PRAKASH INDUSTRIES- COME-ON LIT OUR LIVES!!Chart Analysis & Summary:
Stock Overview:
Stock: Bhagyanagar India Ltd (NSE)
Current Price: ₹71.60
Change: -₹3.47 (-4.62%)
Timeframe: Weekly (1W)
Technical Levels & Fibonacci Retracement:
Resistance & Highs:
Recent high at ₹163.30.
Another key level around ₹128.89.
Fibonacci Levels:
0.5 retracement at ₹81.19.
0.618 retracement at ₹70.16 (a critical support level).
Current Support Zones:
Strong support around ₹63.66 - ₹60.02 (highlighted in orange).
Trend & Price Action:
Price broke below a green trendline indicating a loss of bullish momentum.
Now testing the 0.618 Fibonacci retracement (₹70.16), a key area where price might react.
If this level breaks, further downside toward ₹63.66 - ₹60.02 is possible.
RSI (Relative Strength Index) Analysis:
Current RSI: 31.83 (near the oversold zone of 30).
RSI Moving Average: 41.65.
This suggests the stock is approaching oversold territory, indicating a potential bounce if buyers step in.
Conclusion & Possible Scenarios:
Bullish Scenario: If price holds ₹70-₹63, a rebound could occur with targets toward ₹81 - ₹100.
Bearish Scenario: If support at ₹60 fails, the next major downside could be toward ₹38.13 or lower.
Watch for: RSI reversal, price action near ₹70, and volume confirmation.
Would you like a more detailed trading strategy based on this?
Chart Analysis & Summary:
Stock Overview:
Stock: Prakash Industries Ltd (NSE)
Current Price: ₹133.49
Change: -₹8.74 (-6.14%)
Timeframe: Weekly (1W)
Key Technical Levels:
Major Resistance:
₹183.84 (strong resistance level).
₹239.90 (previous high).
₹329.15 (long-term bullish target).
Support Levels:
₹142.29 (Fibonacci 0.5 retracement, broken).
Current price is near ₹128-130 (potential support zone).
Trendline Support: Further downside could test trendline near ₹100.
Elliott Wave Analysis:
The chart follows an Elliott Wave structure.
Currently in Wave 4 correction after a strong Wave 3 rally.
Wave 5 projection suggests an upside target near ₹329 if Wave 4 holds support.
RSI (Relative Strength Index) Analysis:
Current RSI: 37.94 (weak, but not fully oversold yet).
RSI Moving Average: 43.82.
RSI is in a downtrend, indicating weak momentum.
Conclusion & Possible Scenarios:
Bullish Scenario: If price holds ₹128-130 support, a reversal toward ₹183, ₹240, or higher could occur.
Bearish Scenario: If price breaks below ₹128, it may test ₹100 or lower.
Watch for: Reversal signals, RSI improvement, and break above ₹142 for bullish confirmation.

Prakash- looking bright!!The chart represents a technical analysis of Prakash Industries Ltd. on a weekly time frame from the NSE (National Stock Exchange of India). Here are the key takeaways from the analysis:
Elliott Wave Analysis
The chart follows Elliott Wave Theory, with waves 1 to 5 labeled.
The stock appears to be in Wave 4 consolidation, preparing for a potential Wave 5 rally.
Cup and Handle Formation
A large cup and handle pattern is visible, suggesting a bullish breakout potential.
Fibonacci Retracement Levels
The 0.5 Fibonacci retracement level (142.29) is a key support area.
The stock is consolidating around this zone, potentially forming a base.
Resistance & Support Levels
Resistance: Around 183.84 (red line) and 239.90 (previous high).
Support: Around 140.00, which aligns with Elliott Wave Wave 4 bottom.
Target Projection
If the stock follows Elliott Wave principles, the next target is around 329.15 (marked in green).
This suggests a potential bullish move, provided it breaks key resistance levels.
Summary:
Current Status: Consolidating within a range.
Trend: Bullish outlook if it holds support and breaks resistance.
Key Watch Levels: 140 as support, 183.84 as resistance, 329.15 as a target.
Risk: If the price breaks below 140, the bullish setup might weaken.


Prakash Ind Long Weekly BOIt has been consolidating for the last 16 years and is now giving a breakout on both weekly and monthly timeframes. Whenever a breakout occurs, it's often accompanied by changes in revenue, profits, and other fundamental ratios, indicating that the company is performing well.
Remember to do your own research before investing.

PRAKASHHi guys,
In this chart i Found a Demand Zone in PRAKASH CHART for Positional entry,
Observed these Levels based on price action and Demand & Supply.
*Don't Take any trades based on this Picture.
... because this chart is for educational purpose only not for Buy or Sell Recommendation..
Thank you

LONGPrakash Ind.
Cup n handle pattern, if crossed the resistance, it may to the target given. Volume buzz seen.
Fundamentally strong.

PRAKASH1. Anything can happen.
2. You don't need to know what is going to happen next in order to make money.
3. There is a random distribution between wins and losses for any given set of variables that define an edge. No other thoughts
4. An edge is nothing more than an indication of a higher probability of one thing happening over another.
5. Every moment in the market is unique.


"Prakash Industries: Bullish Breakout Imminent on 1D Chart – PotPrakash Industries Limited on the 1D timeframe is showing a bullish setup, signaling an imminent breakout. With the technical indicators aligning, this stock is poised to deliver significant returns in the coming weeks. Keep an eye on the price action for a potential entry point to capitalize on this opportunity. Perfect for traders looking to enhance their portfolio with a promising mid-term pick.

Technical Analysis of PRAKASH (Bullish)Technical Analysis of PRAKASH based on Price Action
Overview of the Stock - The provided chart shows a 1-hour timeframe of PRAKASH INDUSTRIES LTD . on the NSE. The analysis will focus on price action and the provided indicators.
My Observations about the Stock
Uptrend: The overall price action suggests an uptrend, with higher highs and higher lows.
Support and Resistance:
The 185 level appears to be a crucial support level.
The 200 EMA (Exponential Moving Average) is acting as a dynamic resistance.
Fibonacci Retracement: -The 0.618 Fibonacci level (around 205.42) is a potential resistance zone.
RSI (Relative Strength Index): The RSI is currently above 50, indicating bullish momentum, but it's not overbought, suggesting there might be room for further upside.
My Personal Opinion - Based on the chart's technical analysis, here are some potential trading ideas:
Bullish Perspective:
Buy on Dip: If the price retraces to the 185 support level and shows signs of bullish reversal (e.g., bullish candlestick patterns, increased volume), a long position can be considered.
Breakout: A decisive break above the 200 EMA could signal a stronger uptrend. A stop-loss can be placed below the recent swing low.
Fibonacci Retracement: If the price retraces to the 0.618 Fibonacci level and finds support, it could be a buying opportunity.
Overbought Conditions: If the RSI reaches overbought levels (above 70), a potential pullback might occur.
Resistance: The 200 EMA and the 0.618 Fibonacci level are significant resistance zones. A failure to break through these levels could lead to a price correction.
Remember, this is a general analysis based on the 1H Time Frame chart. It's crucial to conduct your own research and consider various factors before making any investment decisions. This is not an investment advice because I am not SEBI registered person and this is my personal opinion about the stock based on my technical understandings
Thanks for your support as always

Prakash IndustriesVolatilty compression is visible in prakash industries, stock to breakout soon for target above 200+ in very short term.

PRAKASHThese are swing ideas which you can add your watchlist and analysis for yourself !
Keep on your radar!
This I am not sebi ragister I am not sebi ragister I

PRAKASH ind formed a cup and handle @ 202PRAKASH is perfect example of cup and handle.
huge consolidation at 190 range past 2 months.
buy @ 202-210.
target 300-400.
big target for subscribers

PRAKASH QUARTERLY CHARTIts my article
Chart Check: This smallcap stock doubled in 3 months; should you buy, sell or hold?
Read more at:
economictimes.indiatimes.com

Monthly breakout - Prakash IndustriesMonthly breakout in Prakash Industries. Can enter in small quantities.

Resistance Breakout (Weekly TF) - PRAKASH INDPlease look into the chart for a detailed understanding.
Consider these for short-term & swing trades with 4% profit (In my observation, I found that most of the stocks reached 3% to 4% on weekly basis)
Please consider these ideas for educational purposes.

PRAKASH | Continuation Pattern Such a Beautiful Chart
Nice Volume on Green Candle
Monthly, Weekly, Daily RSI above 60

Prakash Industries At a strong support zone now and looks good to make an upward rally as the RSI and MACD indicators suggest.
SL -63

Prakash: out of darknessShort term, cup n handle formation, a close above 63 may take it to 72 in short term which is also a rounding bottom completion.

Prakash industries Ltd Good for long term 🚀Inside bar candle formed in daily chart and stock successfully gave breakout

Prakash: darkness ahead?To maintain the rising channel, it needs to breakout the triangle shown in the chart, if it fails it will leave the channel and go bearish. Very important juncture.

Prakash Industries - BreakOut PointHi
As per the analysis, we can see prakash industries has given a breakout.
It has gone above last month high of 77.20 and currently trading at 80.45.
it tested the lows of 19 around 3 times till date.
As of now its above Rsi - 50.
Macd is positive
Potential for the upside is huge.
We can keep a SL of 67 and wait for the target of 130 and above that 230
