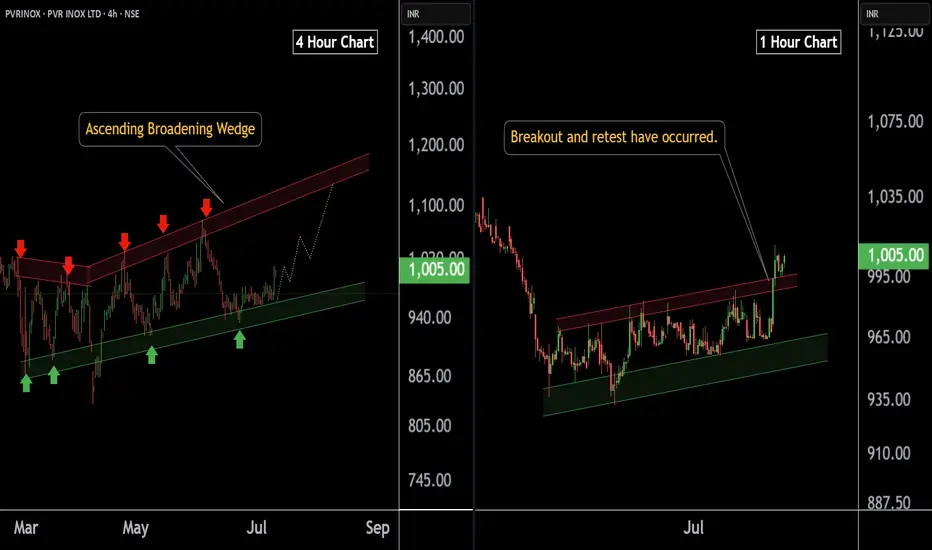
PVR INOX LTD at Best Support !! Breakout Alert !!Here are two charts of PVERINOX — one in the 4-hour timeframe and the other in the 1-hour timeframe.
4-Hour Timeframe Chart:
In the 4-hour timeframe, Power Inox is respecting its lower boundary, with a support range between 930–950.
ChatGPT said:
1-Hour Timeframe Chart:
In the 1-hour timeframe, the stock has given a breakout and has now completed a retest at 980-990 level.
If this level is sustain then , we may see higher in PVRINOX.
Thank you !!
PVRINOX trade ideas
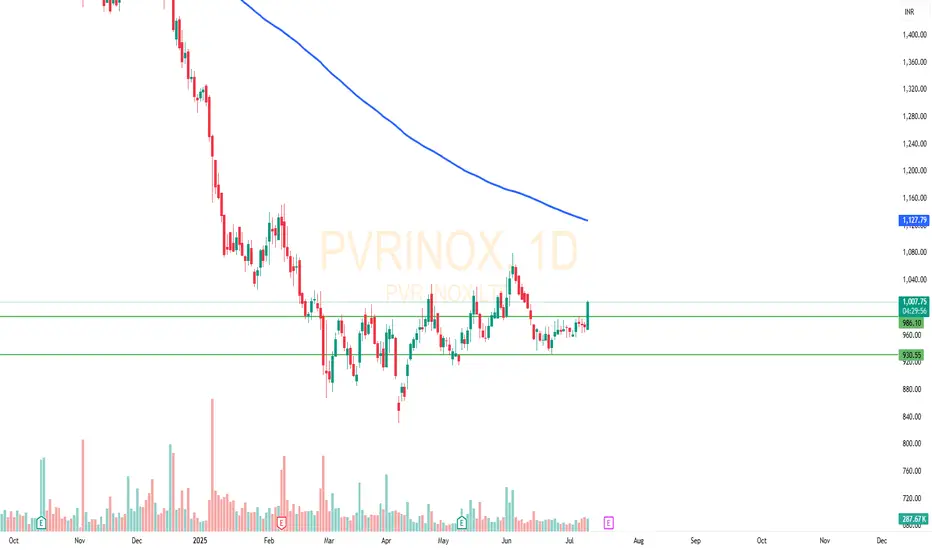
PVR INOX | Bullish Breakout📊 *Stock:* PVR INOX (PVRINOX)
🕒 *Timeframe:* Daily Chart
📈 *Technical Structure:* Breakout from a multi-month consolidation zone
The stock has successfully broken out above the crucial ₹965 resistance level, with a noticeable rise in volume — indicating potential momentum building up.
🔹 *Breakout Zone:* ₹990
🔹 *Next Resistance Targets:* ₹1050 and ₹1170 (near 200 EMA)
🔹 *Support Levels:* ₹915 and ₹870
🔹 *Short-Term Trend:* Bullish Bias
🔹 *Volume Confirmation:* Yes
This setup indicates strength, but traders must watch for follow-up candles and volume support for sustained movement.
🔴 *Disclaimer:*
I am not a SEBI registered investment advisor.
This idea is shared solely for educational and informational purposes, based on technical chart analysis.
It should not be considered as financial advice or a recommendation to buy or sell any stock.
Please consult a SEBI-registered financial advisor before making any trading or investment decision.
PVR INOX LTD at Support Zone.This is the 4 hours Chart of PVRINOX.
PVRINOX having good law of Polarity at 930 range.
If this level is sustain , then we may see higher prices in PVRINOX.
Thank You !!


Pvrinox 1Hr & Daily TFafter falling significantly from the highs, it has taken support and has formed a triangle pattern. a good close above might trigger a up move.
wait for the proper breakout and put stoploss as per the nature of the trade
#pvrinox

PVRINOX PlungesPVRINOX on the 1-day timeframe demonstrated a sharp bearish move, successfully hitting all targets in a precise short trade setup. Identified using the Risological Swing Trading Indicator , this trade perfectly captured the market's downward momentum.
PVRINOX Key Levels:
Entry: ₹1520.80
SL: ₹1570.40
TP1: ₹1459.45 ✅
TP2: ₹1360.25 ✅
TP3: ₹1261.05 ✅
TP4: ₹1199.75 ✅
Technical Analysis:
The trade initiated at ₹1520.80 with a calculated stop-loss at ₹1570.40, offering an impressive risk-to-reward ratio.
The consistent downtrend was confirmed as prices respected the resistance levels marked by the Risological indicator.
The achievement of all targets reflects the trade's efficiency and the indicator's accuracy.
The break below key support levels and sustained bearish momentum ensured the targets were met seamlessly.

PVR inox best for accumulation 1200 to 1300 Zone for investmentHello Frds ,
buy PVR 1200 to 1300 Zone as investment
Target 2200 to 2300 expected .
NO stoploss requiered , pure invest call.

STOCK IDEA for 4th December & 5Th December - PVR INOX
Disclaimer : For Education & Study Purpose Only
Stock Analysis: PVR INOX
Technical Analysis:
Breakout from Consolidation: The stock has closed above the critical level of ₹1595 (22nd October 2024 high) after over a month of consolidation.
Strength Since 27-Nov-2024: Indicates a potential build-up in momentum, possibly driven by anticipation or broader market movements.
Fundamental Catalyst:
Pushpa 2 Release: The release of a blockbuster movie like Pushpa 2 (5th Dec 2024) is a strong revenue driver. Pre-release hype and massive advance bookings point to record-breaking collections, expected to generate significant footfalls and F&B revenues for PVR INOX.
Brokerage View:
UBS has upgraded its target to ₹2000 with a BUY recommendation, reflecting confidence in the company's growth trajectory.
Forecast: ₹1000 crore opening day box office collection could provide a substantial revenue boost.
I hope this study helps & Happy trading.

PVR INOX GOING ON UPTRENDTaget 2024
Entry=1663-1675
SL= 1647.50
Completed Double correction
This chart is only for educational purpose

SWING IDEA - PVRINOXPrice Action was forming a Lower Low Pattern and the MACD Levels has slightly started to form a Higher High Pattern.
1280 is holding as a good Support Zone. Any revisits to this level again or below this level could invalidate setup and also bring more lows for NSE:PVRINOX
As long as the stock continues its momentum upward, everything looks good until its Swing High levels.

PVR S/R Support and Resistance Levels:
Support Levels: These are price points (green line/shade) where a downward trend may be halted due to a concentration of buying interest. Imagine them as a safety net where buyers step in, preventing further decline.
Resistance Levels: Conversely, resistance levels (red line/shade) are where upward trends might stall due to increased selling interest. They act like a ceiling where sellers come in to push prices down.
Breakouts:
Bullish Breakout: When the price moves above resistance, it often indicates strong buying interest and the potential for a continued uptrend. Traders may view this as a signal to buy or hold.
Bearish Breakout: When the price falls below support, it can signal strong selling interest and the potential for a continued downtrend. Traders might see this as a cue to sell or avoid buying.
20 EMA (Exponential Moving Average):
Above 20 EMA(50 EMA): If the stock price is above the 20 EMA, it suggests a potential uptrend or bullish momentum.
Below 20 EMA: If the stock price is below the 20 EMA, it indicates a potential downtrend or bearish momentum.
Trendline: A trendline is a straight line drawn on a chart to represent the general direction of a data point set.
Uptrend Line: Drawn by connecting the lows in an upward trend. Indicates that the price is moving higher over time. Acts as a support level, where prices tend to bounce upward.
Downtrend Line: Drawn by connecting the highs in a downward trend. Indicates that the price is moving lower over time. It acts as a resistance level, where prices tend to drop.
RSI: RSI readings greater than the 70 level are overbought territory, and RSI readings lower than the 30 level are considered oversold territory.
Combining RSI with Support and Resistance:
Support Level: This is a price level where a stock tends to find buying interest, preventing it from falling further. If RSI is showing an oversold condition (below 30) and the price is near or at a strong support level, it could be a good buy signal.
Resistance Level: This is a price level where a stock tends to find selling interest, preventing it from rising further. If RSI is showing an overbought condition (above 70) and the price is near or at a strong resistance level, it could be a signal to sell or short the asset.
Disclaimer:
I am not a SEBI registered. The information provided here is for learning purposes only and should not be interpreted as financial advice. Consider the broader market context and consult with a qualified financial advisor before making investment decisions.

SWING IDEA - PVR INOXPVR INOX , a leading cinema exhibition company, is displaying technical indicators that suggest a promising swing trading opportunity.
Reasons are listed below :
1440 Resistance Zone : The 1440 level has been a significant resistance zone. The price is now attempting to break through this level, indicating strong bullish momentum.
Bullish Engulfing Candle on Daily Timeframe with Volume : The recent formation of a bullish engulfing candle on the daily chart, accompanied by increased volume, suggests strong buying pressure and potential for further upward movement.
Breaking 5-Month Consolidation : The stock is breaking out of a 5-month consolidation phase, signaling a potential new bullish trend.
Double Bottom Pattern on Weekly Timeframe : The formation of a double bottom pattern on the weekly chart indicates a potential reversal from the downtrend, signaling a bullish outlook.
Bouncing Back from Golden Fibonacci Support : The stock is finding support at the golden Fibonacci retracement level (0.618), a key area where prices often bounce back, indicating potential for an upward move.
Target - 1560 // 1720 // 1825
Stoploss - daily close below 1330
DISCLAIMER -
Decisions to buy, sell, hold or trade in securities, commodities and other investments involve risk and are best made based on the advice of qualified financial professionals. Any trading in securities or other investments involves a risk of substantial losses. The practice of "Day Trading" involves particularly high risks and can cause you to lose substantial sums of money. Before undertaking any trading program, you should consult a qualified financial professional. Please consider carefully whether such trading is suitable for you in light of your financial condition and ability to bear financial risks. Under no circumstances shall we be liable for any loss or damage you or anyone else incurs as a result of any trading or investment activity that you or anyone else engages in based on any information or material you receive through TradingView or our services.
@visionary.growth.insights

PVR: Flops & Disasters40% jump in last 3 months
Losses for straight 2 quarters
Rs 1700 levels should be a hard SELL

PVR INOX 1WPVR INOX are currently forming a pattern (the crab pattern) that historically suggests a potential reversal from a downward trend to an upward trend. This is a positive indication for investors who are looking to buy the stock
I'm not a SEBI-registered analyst. All posts and levels shared are just for educational purposes. I'm not responsible for any losses or profits. No claims, all rights reserved

PVR on the Verge of breakout (Double Bottom on weekly chart)After 6 month of consolidation PVR now can give a good move toward the 1747 level .It's making double bottom on weekly chart .Stoploss would be 1420 for a target of 1547 & 1747 respectively

PVR: Lights, camera, ACTION 🎯 The chart is self-explanatory as always.
🎯 A beautiful contraction pattern from a long perspective
🎯 Bounce came from a strong support zone.
🎯 Stock recently gave a double-bottom breakout
🎯 1500 is acting resistance. A break can show some good momentum.
⚠️Disclaimer: We are not registered advisors. The views expressed here are merely personal opinions. Irrespective of the language used, Nothing mentioned here should be considered as advice or recommendation. Please consult with your financial advisors before making any investment decisions. Like everybody else, we too can be wrong at times.


1474 pvrinox volume breakout at lower level1474 pvrinox volume breakout at lower level
Long term breakout visible with volume.
At good level for value buying for long term 2 to 3 years

PVR INOX trend has changed to bullish, crossed 200EMA today...PVR INOX trend has changed to bullish crossing its 200 EMA today. TARGET 1750

PVR has reached its cheapest price ever PVR has fulfilled his overvalued price. 40% reduced from all time high and this is too much cheap in nature. DO SIP or invest doesn't matter, do whatever you want
Fair value has come and we may invest now .
1st target will be around 18% and 2nd one is 28%.
ENTRY PRICE 1340
TARGET 1 1590 (18%)
TAEGET 2 1720 (28%)
BACKUP PLAN if you will have some profits in your hand you should CREATE TRAILING GTT order to breakeven or COST TO COST entry price. don't be so greedy.
see you soon

PRVINOX Bullish RSI Divergence on weekly- Multiple indicators showing levels of support
- RSI Div at current levels

sell at zone ~ intradayexpecting small fall from the zone . look for confirmation inside zone in smaller tf.
- good for intraday trade
- entry inside zone
- sl is day close above zone
- for target draw fib retracement from C to latest swing high , use 0.236 fib as tgt 1 (safe place for intraday), 0.382 as tgt 2 (risk takers).
- don't trade , if u didn't get selling confirmation inside zone
- if day close is above this zone , this pattern becomes invalid.
