Quess corpI saw that the nearly 18–20% correction from its recent high is currently crossing the trendline and attempting a positive retracement. Quess corp is looking attractive above the 325 level.
I believe there is a chance to offer a reward of roughly 10-15% as positioning base with SL 305, or as you feel comfortable, if you accumulate here (as described above 320–325).
Disclaimer: We are not SEBI registered, and all of the information on this page is only meant for educational purposes. Please consult a SEBI-registered financial counsellor before to investing or making any financial decisions. We are not liable for any profit or loss you may have made.
I would welcome your participation and support by liking, commenting, and following in order to express encouragement.
GLORIOUS TRADING 👍
QUESS trade ideas

Quess Corp Ltd | 75% returns | 6 year resistance brokenQUESS CORP LIMITED
Monthly time frame
Stock in uptrend since March 2023
Stock has broken out of the 6-year resistance trend line
Stock is following a rounded bottom pattern
Stock riding above 20- & 50-month moving averages
20MMA about to cross 50MMA
RSI > 60
MACD bullish crossover in place
Weekly time frame
Breakout and retest of the trend line resistance confirmed
Stock is following a rounded bottom pattern
Stock riding above 20-, 50- & 200-week moving averages
20WMA has just crossed 50WMA
Stock is approaching the golden crossover as well
RSI > 60
MACD signaling beginning of bullish momentum
Volumes are very encouraging for Jul and Aug 2024
Daily time frame
Stock possibly in the process of making a higher low
Stock is in the yellow channel of upward consolidation
Stock riding above 20-, 50- & 200-week moving averages
RSI > 50 which is still considered the bull zone
Conclusion
Entry: 680
Stop Loss: 630
Target 1: 850
Target 2: 1,000
Target 3: 1,200

Hela Star Breakout A breakout in the stock market is when a financial instrument's price crosses a resistance level or falls below a support level. Breakouts can indicate the start of a significant price trend and can be used by traders to identify opportunities.

Hela Star BreakoutStocks trading near their high in the past 4 months with rising volumes and closing strong, indicating a possible breakout

40% Breakout Candidate in Month40% Breakout Candidate in Month.You get 40 percent of a number by multiplying it by . 40 or the fractional equivalent, 2/5. So, 40 percent of 20 is 8. 40 percent of 30 is 12.

QUESS NSE 6Yr Trend LINE Breakout WTF/MTF QUESS NSE , Price has Broken out of a 6Yr Trendline on the Weekly and Monthly time Frame (WTF/MTF)
Price is currently hovering above 50 EMA with 21EMA above 50 and 200 respectively in DTF suggesting a Corrective/Pullback of a Bullish Trend
QUESS is trading above the 50% FIBO Retracement Range on DTF
Enter when Price closes above High on WTF with 25% Quantity.
SL @720
Add progressively. at higher Close Add 50% when price closes above 1000 completing the RBC with a retest.

QUESS CORP DOW Theoryvolume growth
support 432 as 200 EMA
expected level 660
RSI above 60 daily an weekly

QUESS Looks good CMP 730Strong chart recent Volumes are good,
RSI Strong looking good for 788/862
QUESS Short to mid term targets 900+

Quess Corp - Break out Quess corp recently broke out of its multi-year contracting triangle pattern
It is one of India's biggest employer in terms of number of employees!

Quess crop Ltd Reverse Head & Shoulder on Weekly ChartQuess crop Made Reverse H&S pattern on weekly chart, Give breakout above neckline & retest it. Target will be around 950 with a stop loss of 615

Quess Corp Ltd.Quess Corp Ltd.'s stock is currently trading at the same level it was in December
2016, around ₹700. Despite this, the company's net profit has grown
significantly, from ₹81 crore in March 2016 to ₹344 crore on a trailing twelve
months (TTM) basis—more than a fourfold increase over eight years.
Interestingly, the stock is still at the same level as it was in December 2016.
The stock fits within the "cup with handle" pattern, and it recently broke out,
dipped slightly to retest the breakout level, and has since bounced back,
showing upward momentum. Based on this strategy, there's a potential gain of
39.40% from the current price of ₹706, setting a target price of ₹986.
Although this target is below the stock's lifetime high of ₹1,302.75 reached in
June 2018, it still represents a strong opportunity to buy the stock at its current
level.

QUESS CORP LTDQuess Corp Limited provides business services across four segments - Global Technology Solutions Group, Industrial Asset Management Group, Integrated Facilities Management, and People & Services.
Chart pattern - Bulling Triangle classic:
Long @ 750
Stop Loss @ 500
Market cap - 10561 Cr
Current Price - 711
High/Low 1303.15 / 165.00
Stock PE - 35.2
Price to book value - 3.77
Debt to equity - 0.30
Pledged = 0.00%
Interest coverage - 3.75
EPS growth 3years - 85.7%
EPS in Rupees
2021 - 3.92 Cr
2022 - 16.30 Cr
2023 - 15.14 Cr
2024 - 18.71 Cr which is greater than past 3years
Cash Flow as of MARCH 2024
OCF - 529 Cr
FCF - 82 Cr
Shareholding as of JUNE 2024
Promoters - 56.64%
Mutual Funds - 9.07%
FIIs - 15.93%
DIIs - 1.89%
Retail and others - 16.48%
DIIs - 10.95%
Disclaimer
ONLY FOR EDUCATIONAL PURPOSE.

GURSS CORP LTDSupport and Resistance Levels: In technical analysis, support and resistance levels are significant price levels where buying or selling interest tends to be strong. They are identified based on previous price levels where the price has shown a tendency to reverse or find support.
Support levels are represented by the green line and green shade, indicating areas where buying interest may emerge to prevent further price decline.
Resistance levels are represented by the red line and red shade, indicating areas where selling pressure may arise to prevent further price increases. Traders often consider these levels as potential buying or selling opportunities.
Breakouts: Breakouts occur when the price convincingly moves above a resistance level (red shade) or below a support level (green shade). A bullish breakout above resistance suggests the potential for further price increases, while a bearish breakout below support suggests the potential for further price declines. Traders pay attention to these breakout signals as they may indicate the start of a new trend or significant price movement.
20 EMA: The yellow line denotes 20 EMA, to interpret the 20 EMA, you need to compare it with the prevailing stock price. If the stock price is below the 20 EMA, it signals a possible downtrend. But if the stock price is above the 20 EMA, it signals a possible uptrend.
Disclosure: I am not SEBI registered. The information provided here is for learning purposes only and should not be interpreted as financial advice. It is important to consult with a qualified financial advisor before making any investment decisions. Tweets neither advice nor endorsement.
Quess A Swing CandidateQuess: This is a relatively good setup. Accumulated by big hands. A great swing trading script in this overheated Marketplace.
Good Contraction, Base on Base Formation, Volume accumulation tower and a good quarterly growth
PS: Not a trading advice

Quess : BreakoutThis stock is about to Give Daily breakout RSI is also strong As per my View on Future Price may come at Rs.671 , 685
Please keep in mind that markets are inherently unpredictable, and there are no guarantees in trading. This view is based on my analysis as of Dated 02-July-2024, and conditions may change. It's important to do your own research and consider your risk tolerance before making any trading decisions .Feel free to reach out .Your feedback and insights are always appreciated.
Disclaimer: Mention Information is only for Educational Purpose I am not a SEBI registered analyst.

Quess Corp LTD.Quess Corp LTD.
Quess Corp Limited (Quess) is India’s leading business services provider, leveraging its extensive domain knowledge and future-ready
digital platforms to drive client productivity through outsourced solutions.
Good Fundamental MIDCAP Company.
Below are the few strong technical points to buy.
1. Market structure has changed.(Price is above 30 Weekly SMA).
2. Stock is consolidating in a small range for for than 5 weeks.
3. Uptrend is with huge volume.
Buy above 528

Quess Corp - Rounding Bottom and Cup & handle Quess Corp - Rounding Bottom formation and ready to give breakout of Cup & handle pattern? - Buy above 446

Quess Positional PickQuess Positional Pick (Duration few weeks)
Buy @ : CMP
Targets : 486, 515, 545, 604, 678 & 753
Stop Loss : below 343

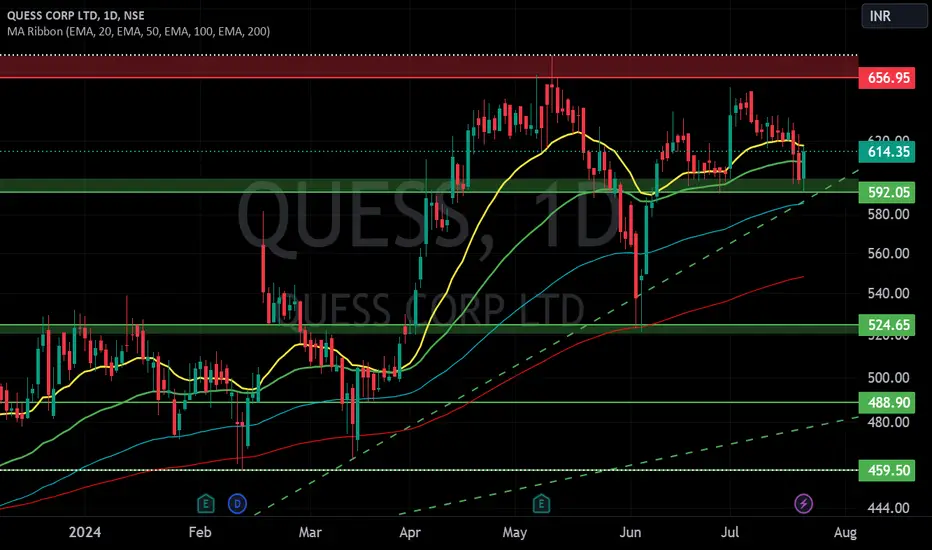
Keep An Eye - Consolidation Zone - QUESS 📊 Script: QUESS
📊 Sector: Diversified
📊 Industry: Diversified - Large
Key highlights: 💡⚡
📈 Script is trading in consolidation zone at support.
📈 Script has to break either resistance of 640 or support 620 make it or break it.
📈 Keep An Eye on stock for Breakout or Breakdown.
⏱️ C.M.P 📑💰- 626
⚠️ Important: Always maintain your Risk & Reward Ratio.
✅Like and follow to never miss a new idea!✅
Disclaimer: I am not SEBI Registered Advisor. My posts are purely for training and educational purposes.
Eat🍜 Sleep😴 TradingView📈 Repeat 🔁
Happy learning with trading. Cheers!🥂

Go long in quess corpquess corp looking bullish.go long with the target of t1-569 t2-610 and t3 710 with the stop loss of 460(day close )

Strong Momentum. Looks good for Swing Trade. There is a good breakout of consolidation zone as well as good momentum.

quess corp looking bulishquess corp looking bullish.go long with the target of t1-569 t2-610 and t3 710 with the stop loss of 460(day close )

Watch if QUESS can overcome 580/600 zone Observations
- Drop from Jun'18 High was 85%
- Drop from Sep'21 High was lesser extent; of 65% and lesser number of months (even though the pace of move was almost similar)
- Buy Support came at 350 in Jan'23-Mar'23 when price was supported at that level with higher volume that was noticeable
- The next support to price was at higher level of 400 in Aug'23-Oct'23
- Price has help up above 450 even though volume has increased in Feb'24
- Pace of Upmove appear lesser in intensity compared to earlier buying from 2020 low.
- Given above, it could be possible that distribution is still continuing by FII as is evident from the drop in their shareholding
- Going forward -- plan to watch if it is able to overcome 580/600 zone and sustains above that area in face of increase in supply that might emerge at higher levels
