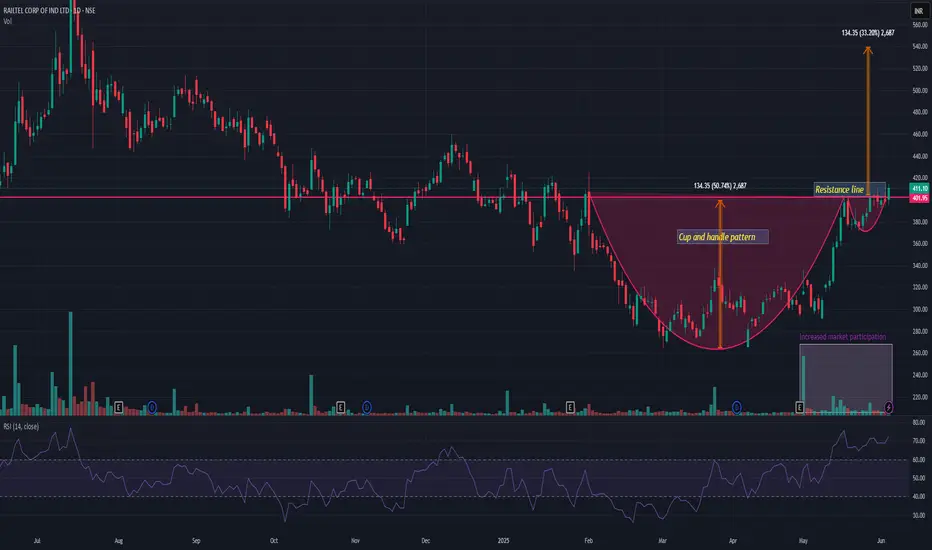
RAILTELsecond leg up soon? cooling off after a good move up north with volumes... good r:r for right now. also a cup & handle formation happening!
RAILTEL trade ideas


RAIL TAILSEBI-Disclosure for Stock Analysis
For Informational Purposes Only: The analysis provided above is for educational and informational purposes only and is based on the technical interpretation of the supplied stock chart. It should not be construed as financial advice, investment advice, or a recommendation to buy, sell, or hold any security.
Not a Financial Advisor: I am an AI assistant and not a registered or qualified financial advisor, investment advisor, or stockbroker. The information presented is generated without considering your individual financial situation, risk tolerance, or investment objectives.
Risk of Loss: Trading and investing in financial markets, including equities, carry a significant risk of loss. The value of stocks can fluctuate, and you may lose part or all of your investment. Past performance is not indicative of future results.
Consult a Professional: Before making any investment decisions, you should conduct your own thorough research and/or consult with a qualified financial professional to assess your personal circumstances and the suitability of any investment.
Information Accuracy: While this analysis is based on the data visible in the chart, it does not account for all possible market variables, including fundamental factors (like company earnings, debt, management) or macroeconomic events (like interest rate changes, government policies) that can impact the stock's price.

RAILTELRAILTEL showing very good strength and currently trading above resistance line. It has also been observed cup and handle pattern breakout with decent increased volume in recent days. If I consider recent depth then we may see approx 30-33% rally in coming days provided that it holds and closing above 380 levels all the time. Strong up move is on the table!
Trendline Breakout - RAILTELCurrent Price: ₹385
Technical Analysis:
Trendline Pattern Breakout: This is a bullish technical signal. A breakout from a trendline (especially a downtrend line) often indicates a shift in momentum and the potential for an upward move. For confirmation, it's ideal to see the breakout accompanied by strong trading volume.
Targets:
Target 1: ₹450
Target 2: ₹585
Time Frame: 1 Year to 3 Year (This suggests a medium to long-term horizon for achieving these targets, which aligns well with the nature of infrastructure projects RailTel undertakes).
Fundamental Analysis (Based on the images provided for RailTel):
Market Cap: ₹12,361 Cr.
Stock P/E: 39.2
Book Value: ₹62.3
Sales (Revenue from Operations): Consistently growing, from ₹572 Cr in Mar 2016 to ₹3,478 Cr in Mar 2025.
Operating Profit: Steady increase from ₹206 Cr in Mar 2016 to ₹533 Cr in Mar 2025.
Net Profit: Shows consistent growth, from ₹102 Cr in Mar 2016 to ₹300 Cr in Mar 2025.
EPS in Rs.: Increased from ₹3.18 in Mar 2016 to ₹9.34 in Mar 2025.
Compounded Sales Growth: 1 Year: 35%, 3 Years: 32%, 5 Years: 26%, 10 Years: %.
Compounded Profit Growth: 1 Year: 19%, 3 Years: 23%, 5 Years: 19%, 10 Years: 13%.
Return on Equity: Last Year: 16%, 3 Years: 15%, 5 Years: 15%, 10 Years: 13%.
Corporate Actions:
Dividend: The Dividend Payout % has fluctuated but has been consistently paid, with a 11% payout in Mar 2025. (As per previous information, the board recommended a total dividend of ₹2.85 per share for FY25.)
Recent News: Latest news would generally highlight the company's strong Q4 FY25 financial results, substantial order book wins, and its strategic positioning in government-led digital infrastructure and railway modernization projects.
Company Order Book:
While specific order book figures are not in the provided images, public information suggests RailTel consistently secures new contracts from Indian Railways and government bodies, providing strong revenue visibility for coming years.
Overall Assessment:
RailTel presents a robust bullish case, supported by both strong technicals and impressive fundamentals:
Technical Tailwinds: The Trendline Breakout suggests a positive shift in market sentiment.
Strong Growth: The company demonstrates consistent and healthy growth in Sales, Operating Profit, and Net Profit over multiple years. The EPS shows strong year-on-year growth and a significant jump in the latest quarter. The "Profit growth" is 18.9%.
Healthy Ratios: Excellent ROCE (21.8%) and ROE (16.5%).
Financial Strength: Extremely low Debt to Equity (0.02) indicates a very strong and stable balance sheet.
Valuation: While the P/E of 39.2 is a premium, it's slightly below the industry P/E of 41.2, suggesting it's potentially more reasonably valued than some peers given its growth trajectory and strategic role.
The targets of ₹450 / ₹585 within a 1 to 3-year timeframe appear achievable, backed by the technical breakout and the consistent fundamental growth, strategic positioning, and expected future projects in digital infrastructure and railway modernization.
Disclaimer: This analysis is for informational purposes only and does not constitute investment advice. Always conduct your own thorough research, carefully analyze the stock chart, assess your risk tolerance, and consult with a qualified financial advisor before making any investment decisions. The stock market carries inherent risks.

RAILTEL Ready To Move UpsideThe Stock is just below 200 day moving average and trying to move upside.
As per Fixed Range Volume Profile the balance lies around 508 while going down.
Fibonacci Golden Ratio value is around 483.
All the other shorter Moving Averages have turned looking upward.
It can be expected that the stock has potential to take out ATH of 617 in Medium to Long Term (6 to 12+ months).
In Short term (Upto 3months), 483 to 508 is more probable.

RAIL TELRail Tel
MTF Analysis
Rail TelYearly Demand Breakout 190.0
Rail Tel 6 Month Demand Breakout 190.0
Rail Tel Qtrly Demand 256.0
Rail TelMonthly Demand 256.0
Rail TelWeekly Demand BUFL 258.0
Rail Tel Daily resistnce Now support 295.0
ENTRY -1 Long 295.0
SL 275.0
RISK 20.0
Target as per Entry 959.0
RR 33.2
Last High 617.0
Last Low 275.0

RAILTEL: Building Strength at Demand ZoneRAILTEL (Railtel Corp of India Ltd.)
Key Levels:
Demand Zone: ₹348 - ₹357
First Target Zone: ₹452
Second Target Zone: ₹561
Stop Loss: Below ₹345 (demand zone failure)
Structure & Trend:
Stock has been in a corrective phase, respecting the demand zone multiple times.
A potential double bottom structure may be forming around ₹348-₹357.
Golden retracement of the last swing low offers a bounce opportunity.
Trade Plan:
Entry: Around ₹355 - ₹365 within the demand zone.
Targets:
First target: ₹452
Second target: ₹561
Stop Loss: ₹345 on a daily close basis.
Note: A breakdown below ₹345 could lead to further downside; monitor price action.

RAILTEL LONGRAILTAIL
After Long Time RSI Cross Above 60
Price Close Above EMA
Buy :- 435.90
SL :- 392
Target :- 477 / 500 / 523/ 595

RAILTELKeep on radar, Took a stance from bottom level, Now Buying is coming from low level, Price are expected to be seen for 420, 430, 450 in few weeks...

railtel chart analysisrailtel chart analysis on daily time frame. This stock is at good support and can bounce from here.
please share your feedback and follow for more such charts.

Railtel corp view for Intraday 2nd September #BIOCON Railtel corp view for Intraday 2nd September #BIOCON
Buying may witness above 495
Support area 490.. Below ignoring buying momentum for intraday
Selling may witness below 486
Resistance area 490
Above ignoring selling momentum for intraday
Charts for Educational purposes only.
Please follow strict stop loss and risk reward if you follow the level.
Thanks,
V Trade Point

RAILTEL GIVES BRAKEOUT ON DAILYCHARTNSE:RAILTEL
RAILTEL gives brake out on daily chart.
I am buying this stock
Near 550-570
And follow sl on 450
My target will be 690
My risk reward ratio is 1:1.50
Return on capital 20%

Railtel - on full steam!The chart speaks for itself.
Beautiful expanding channel and clean trend based movement within this channel.
Also, a big contributor within the Railway sub theme of Kavach stocks.
730-ish target on the cards...

Railtel Corp for LongRailtel Corp gave a nice base breakout with strong volume...
Railway Theme will support the momentum..
Disclaimer:
This analysis is for informational purposes only and does not constitute investment advice. Trading involves significant risk and may result in the loss of capital. Always conduct your own research or consult a financial advisor before making investment decisions. I am not responsible for any actions taken based on this analysis.

RAILTEL TO 650 IN JULY?#RAILTEL bull breakout done!
Its a buy on dips and retest would be an amazing opportunity.
Expecting something good for Railway sector in Budget.


Double Moving Averages Crossover Swing Trade - RAILTEL📊 Script: RAILTEL
📊 Sector: Telecomm-Service
📊 Industry: Telecommunications - Service Provider
⏱️ C.M.P 📑💰- 434
🟢 Target 🎯🏆 - 478
⚠️ Stoploss ☠️🚫 - 412
⚠️ Important: Always maintain your Risk & Reward Ratio.
✅Like and follow to never miss a new idea!✅
Disclaimer: I am not SEBI Registered Advisor. My posts are purely for training and educational purposes.
Eat🍜 Sleep😴 TradingView📈 Repeat 🔁
Happy learning with trading. Cheers!🥂


Railtel retestthis is a swing trade analysis of railtel which is showing breakout and then retesting its resistance level. One can go long in this.

RailTel corp of indiaMonthly BB it should be challange -good sign to(buy)
In weekly it should be retest 50% good sign to (buy)
and weekly mother candle make be broken it can be go 568.
ABOUT TO INDICATOR
Weekly MACD is uptick
Daily RSI and STOCH RSI giving a buy signal
Daily BB is should be challange it can go up
Daily volume is also good
overall we can go buy it with proper risk management

Double Moving Averages Crossover Swing Trade📊 Script: RAILTEL
📊 Sector: Telecomm-Service
📊 Industry: Telecommunications - Service Provider
⏱️ C.M.P 📑💰- 433
🟢 Target 🎯🏆 - 475
⚠️ Stoploss ☠️🚫 - 415
📊 Script: TATASTEEL
📊 Sector: Steel
📊 Industry: Steel - Large
⏱️ C.M.P 📑💰- 174
🟢 Target 🎯🏆 - 183
⚠️ Stoploss ☠️🚫 - 170
📊 Script: SUZLON
📊 Sector: Capital Goods - Electrical Equipment
📊 Industry: Electric Equipment
⏱️ C.M.P 📑💰- 44
🟢 Target 🎯🏆 - 48
⚠️ Stoploss ☠️🚫 - 42
📊 Script: ADANIPORTS
📊 Sector: Marine Port & Services
📊 Industry: Miscellaneous
⏱️ C.M.P 📑💰- 1385
🟢 Target 🎯🏆 - 1454
⚠️ Stoploss ☠️🚫 - 1361
📊 Script: MTARTECH
📊 Sector: Aerospace & Defense
📊 Industry: Engineering
⏱️ C.M.P 📑💰- 2110
🟢 Target 🎯🏆 - 2231
⚠️ Stoploss ☠️🚫 - 2046
⚠️ Important: Always maintain your Risk & Reward Ratio.
✅Like and follow to never miss a new idea!✅
Disclaimer: I am not SEBI Registered Advisor. My posts are purely for training and educational purposes.
Eat🍜 Sleep😴 TradingView📈 Repeat 🔁
Happy learning with trading. Cheers!🥂

RAILTEL STOCKI have updated my analysis on the RAILTEL stock
Railway stocks are most important in indian growth must focus
